Blocks per week as an indicator of the difficulty bomb

It can be automatized using Dune.

4 Likes

Oh. This is great. So I don’t have to update it. Cheers.

1 Like

The graph is a little clunky, though. From my perspective the bomb is starting to be visible.

It doesn’t update already?

As far as the bomb, I don’t think it’s started to go off yet.

That’s why I had the horizontal lines across at each ‘second’. So the top-most one is how many blocks there would be in a week if each block was 14 seconds. If each was 16 seconds, it would be down at the next horizontal line. This is the latest chart – you can see it hasn’t really started to decend.

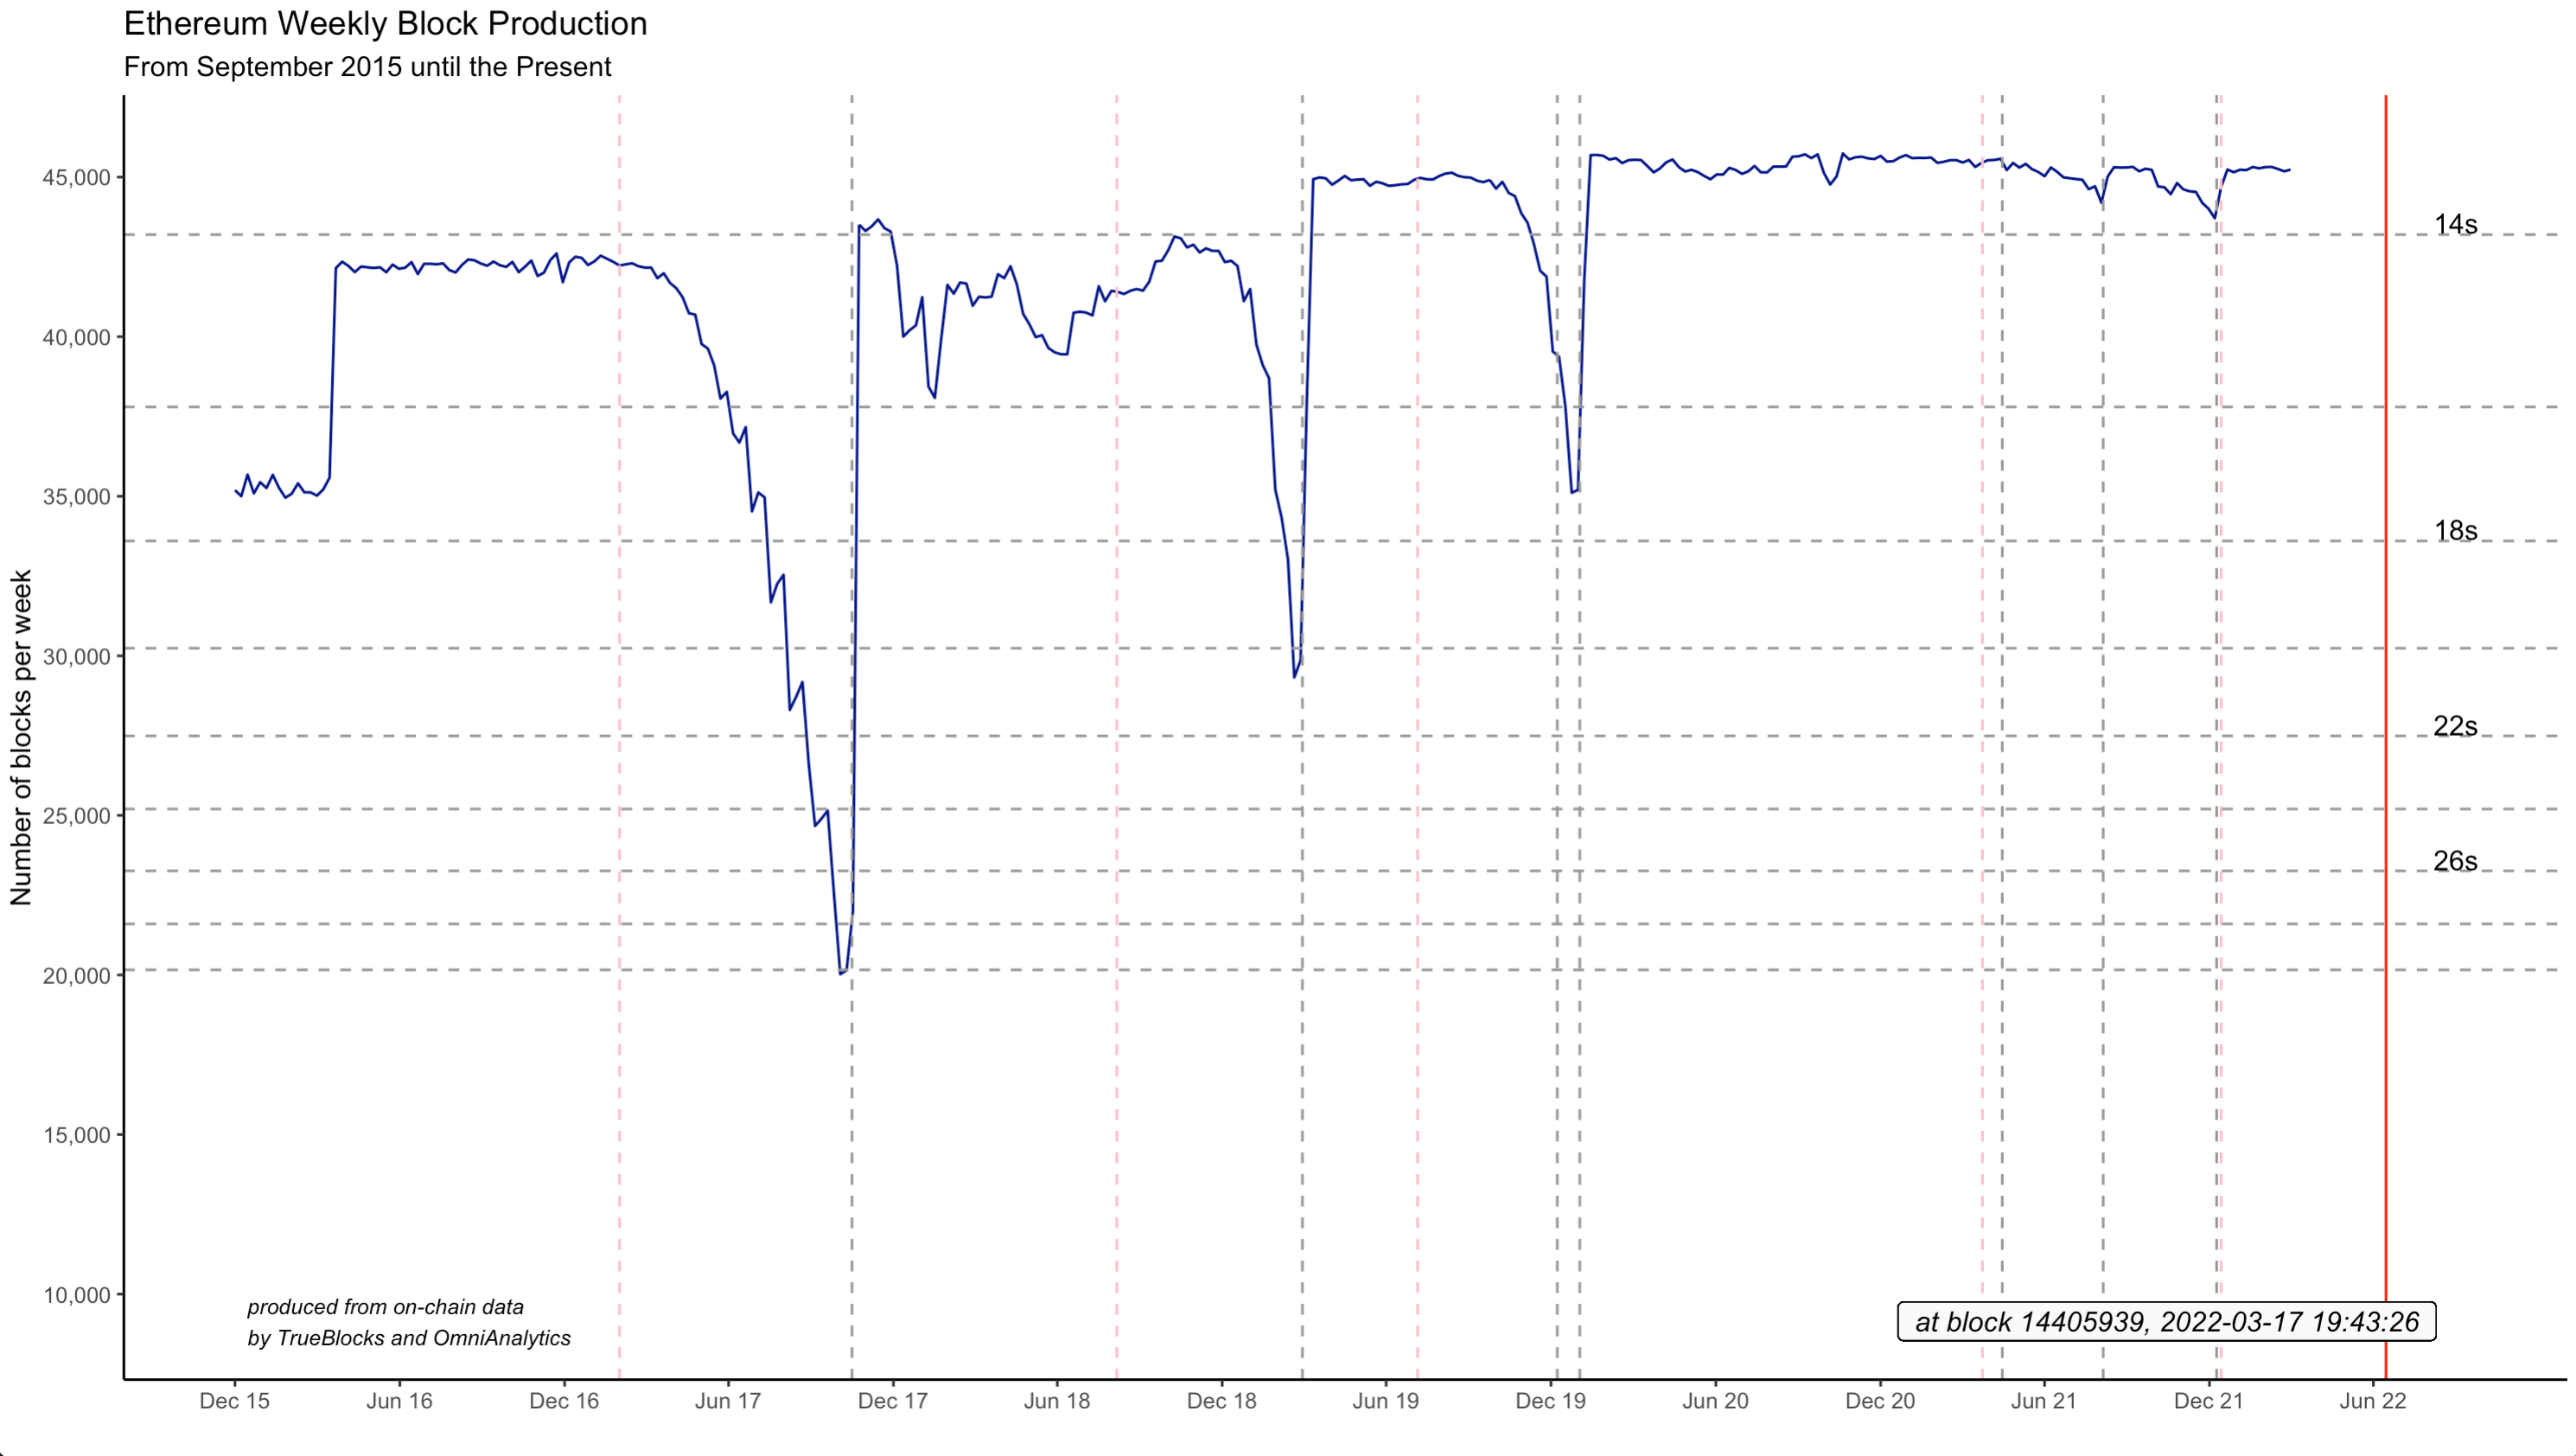
It would be great to get someone to double-check this work? Repo link above. The solid red line is June 15. The dashed red lines are each time the bomb’s period was at period 31 for comparison. (Period 31 is where it was reset in December.)

2 Likes

Latest installment. I guess we’re starting to see a very slight effect. Notice from previous bombs how quickly it comes once it starts to come. Red vertical line is June 15.

Stay tuned…

Latest installment. I see a slight dip. I expect we will start seeing an effect in the coming weeks. A higher hash rate delays the first ‘appearance’ of the bomb, but there’s a concern that once the bomb appears it will be more virulently.

The horizontal grey lines are the number of seconds between blocks given the number of blocks produced in a week on the y-axis.

I’m going to post another chart shortly to show another view.

This chart shows the real block number (in red), the fake block number (in green), and the bomb’s period (the staggered blue line which changes discontinuously every 100,000 blocks).

The dashed grey horizontal line is what I call the “We should start paying attention” line. If you look closely at previous bombs, you can see the slight diminishment in the block number over time. We’re not seeing that yet, but stay tuned.

is a “bomb” a stark decrease in the block-production rate over a certain period of time? what is it about the time preceding hard-forks that cause such down-spikes? is it because node-runners deactivate their nodes to update the software?

what does this mean for the transaction rate for ethereum? does it remain at a stable rate? do these bombs have measure-able impact on gas prices?

I’ve written about a lot of this here: Adventures in Difficulty Bombing. An exercise in predicting the future… | by Thomas Jay Rush | Coinmonks | Medium. That link also has links to a bunch of other articles as well.

About the impact on gas price, I’m not sure. It has had, mistakenly I think, a serious effect (at least on the arguments surrounding) the block reward, but I don’t know about gas prices.

1 Like

It’s coming…

1 Like

At block 14,600,000, which happened this week, we entered into period 39, which based on previous bombs is when we usually start seeing a diminishment in block times. I’m not seeing that yet. This is not yet concerning, but is becoming “interesting.” (See below).

Here is an estimate, assuming no growth in block times, of when the next three doublings in difficulty will happen. (A doubling happens when the period changes – period = fakeBlockNum/100000 – fakeBlockNum = realBlockNum-10,700,000 – the additional difficulty at each block is 2^period).

blockNumber	timestamp	date	name
14000000	1642114795	2022-01-13 22:59:55 UTC
14100000	1643450273	2022-01-29 09:57:53 UTC
14200000	1644784417	2022-02-13 20:33:37 UTC
14300000	1646123109	2022-03-01 08:25:09 UTC
14400000	1647466065	2022-03-16 21:27:45 UTC
14500000	1648811420	2022-04-01 11:10:20 UTC
14600000	1650160464	2022-04-17 01:54:24 UTC
14700000	1651492241	2022-05-02 11:50:41 UTC	 (est flat)
14800000	1652822241	2022-05-17 21:17:21 UTC	 (est flat)
14900000	1654152241	2022-06-02 06:44:01 UTC	 (est flat)

In this estimate, which extends to period 42 (the same period just prior to the Byzantium fork–see above charts), I add NO additional seconds to each block. This may seem conservative, but it tries to take into account the possibility that the much higher hash rate we’re seeing now (compared to the past) may be masking the increasing difficulty of each change of period (bomblet).

This next group of data is a slightly less conservative estimate showing a one-second slowing down of blocks with each doubling. If this happened, we may be at 16-second blocks by the end of June):

blockNumber	timestamp	date	name
14000000	1642114795	2022-01-13 22:59:55 UTC
14100000	1643450273	2022-01-29 09:57:53 UTC
14200000	1644784417	2022-02-13 20:33:37 UTC
14300000	1646123109	2022-03-01 08:25:09 UTC
14400000	1647466065	2022-03-16 21:27:45 UTC
14500000	1648811420	2022-04-01 11:10:20 UTC
14600000	1650160464	2022-04-17 01:54:24 UTC
14700000	1651837086	2022-05-06 11:38:06 UTC	 (est onesec)
14800000	1653730218	2022-05-28 09:30:18 UTC	 (est onesec)
14900000	1655823350	2022-06-21 14:55:50 UTC	 (est onesec)

My growing concern is that due to a much higher hash rate, unlike previous bombs, this bomb’s effect may not appear at all until it appears massively. (In other words, this bomb may truly explode!)

The higher hash rate may be hiding the initial, smaller shocks to the system (the bomblets) which are being recovered from more quickly, so much so that they don’t reveal themselves in the weekly production. (I looked at a daily chart that also does not show much of a slow-down.)

The concern is that once the system loses its ability to recover from the shock of a doubling, it will lose that ability in a serious way.

I’ll keep watching it.

We should start seeing a recognizable diminishment in block times soon. If not, we’ll need to dig deeper.

3 Likes

You can also track this on Coin Metrics here

2 Likes

Latest chart fresh off the presses…

2 Likes

Chart as of today. The bomb is clearly starting to show. It’s reasonable to estimate its future progress based on previous bombs.

3 Likes

I guess a new hardfork for delaying the difficulty bomb is around the corner

On the basis of daily block time we’re already at the point where Arrow Glacier kicked in.

3 Likes

Some new charts. Back in December, I was asked to predict 15-second blocks by mid-June. Impossible to be certain, but I wouldn’t be surprised if this were the case.

The red line is June 15.

The dashed red lines are the last time we were at the same period in each of the previous forks. Much higher hash rates now has tamped down the effect, but that won’t last forever.

The blue dashed vertical lines are the previous forks.

The table tries to compare past forks with the current one and predicts the next bomblet to be around May 18.

4 Likes

Latest chart as of last night…I’m quite confident that the is the correct data, but I would be happy to have others produce similar results independently if possible.

It looks to me like it’s getting close the time to make a decision. I think we can expect a fairly quick decline from here (based on previous bombs).

2 Likes