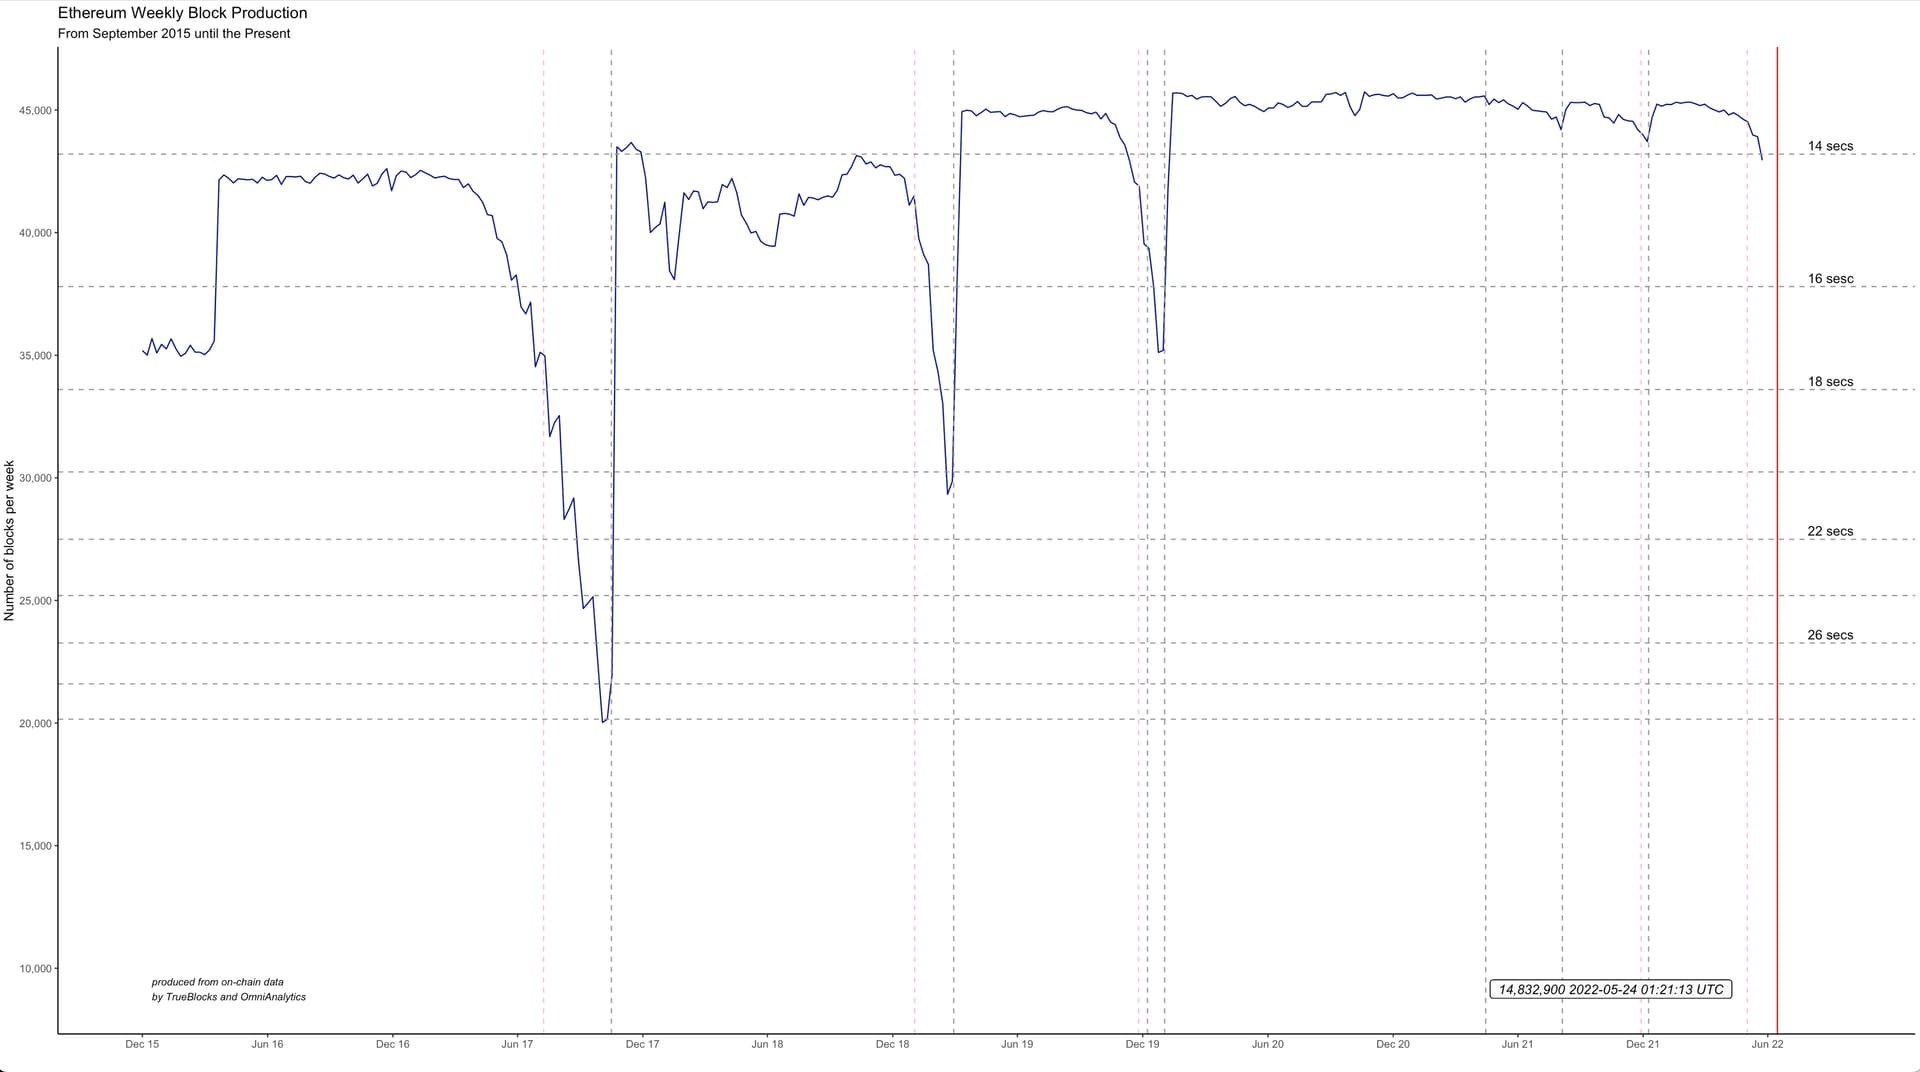
Latest chart as of last night…I’m quite confident that the is the correct data, but I would be happy to have others produce similar results independently if possible.
It looks to me like it’s getting close the time to make a decision. I think we can expect a fairly quick decline from here (based on previous bombs).
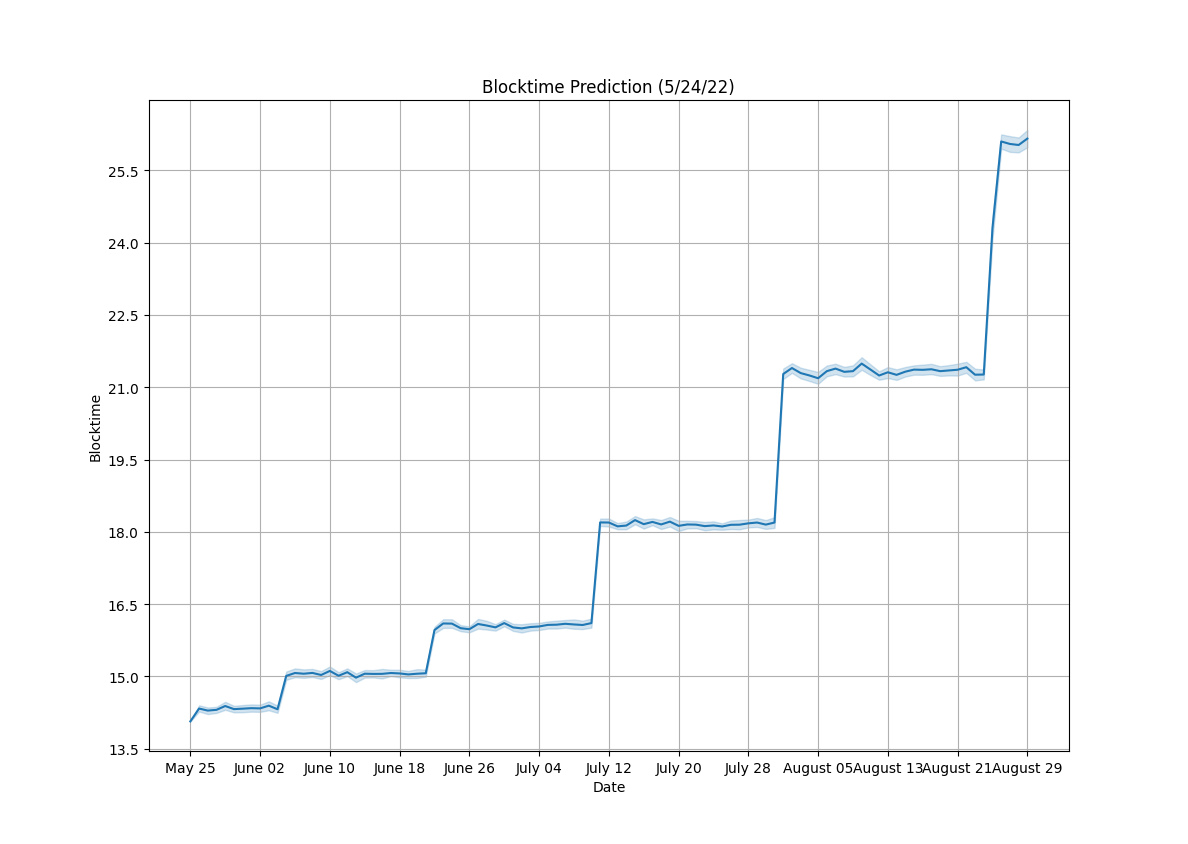
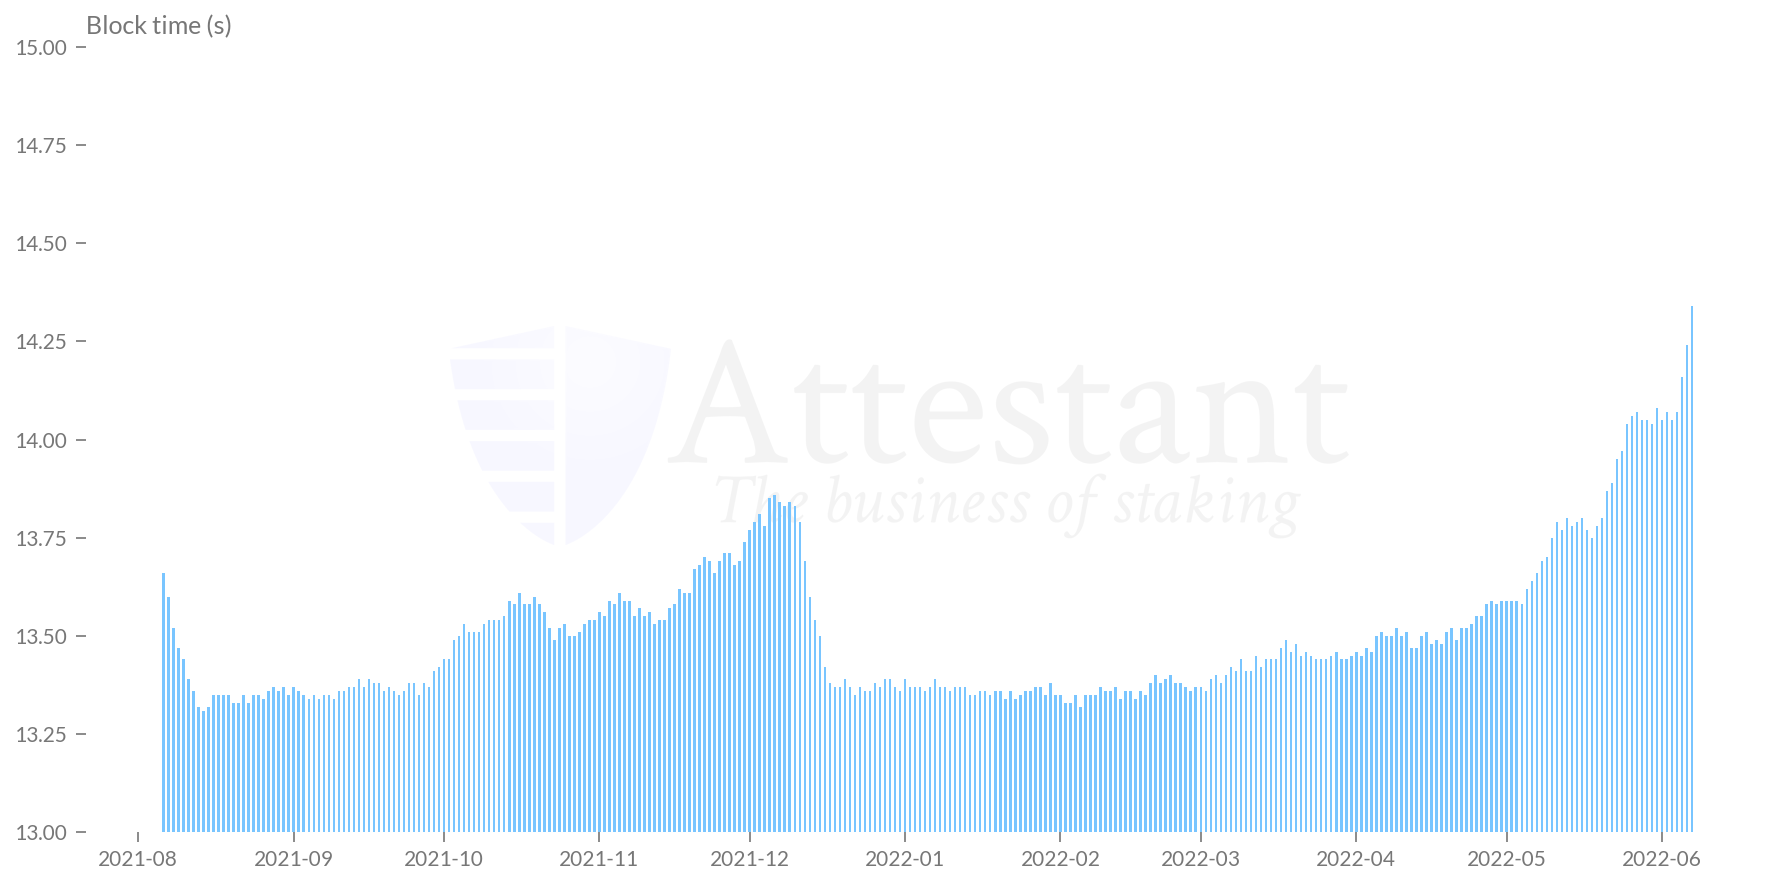
Here’s my prediction for blocktimes assuming hashrate stays consistent. Disclaimer: This is based on reported block timestamps which may differ materially from the actual time between blocks.
I used the recorded block timestamps (as set by the miners) when looking at historical blocktimes for a given hashrate. These timestamps are often quite different from the actual time the block was produced. So, for instance, it may have taken 20 seconds to mine the block, but the block timestamp could be set at just 5 seconds ahead of the previous block. My data would read that as a 5 second blocktime, whereas the 20 seconds is really what we are interested in for purposes of network congestion etc…
I haven’t thought through exactly how or if this would impact the results when averaged over a large dataset, but I thought it was worth mentioning.
ETA: This (potentially) matters for my data since I plugged one simulated block at a time into the difficulty formula to get this result. If you use blocks/day or something like that as a metric it wouldn’t matter.
Thanks. While I don’t really make predictions (purposefully), it seems that the actual data as shown by my chart and your prediction (at least for late May and early June) align fairly well. Would you say that’s true?
Just using my eyeballs, my charts is hinting at 15-second blocks through mid-June and 16-second blocks into late June / early July which align pretty much with your prediction.
Apparently, there’s talk of setting back the bomb. I think that’s totally reasonable.
There’s a link above to an article I wrote in November trying to figure out how far back and when to set the bomb for Arrow Glacier. I’d love any comments/thoughts about that.
Also, here’s a spreadsheet I put together to try to figure out how far back and when to set back the bomb this time.
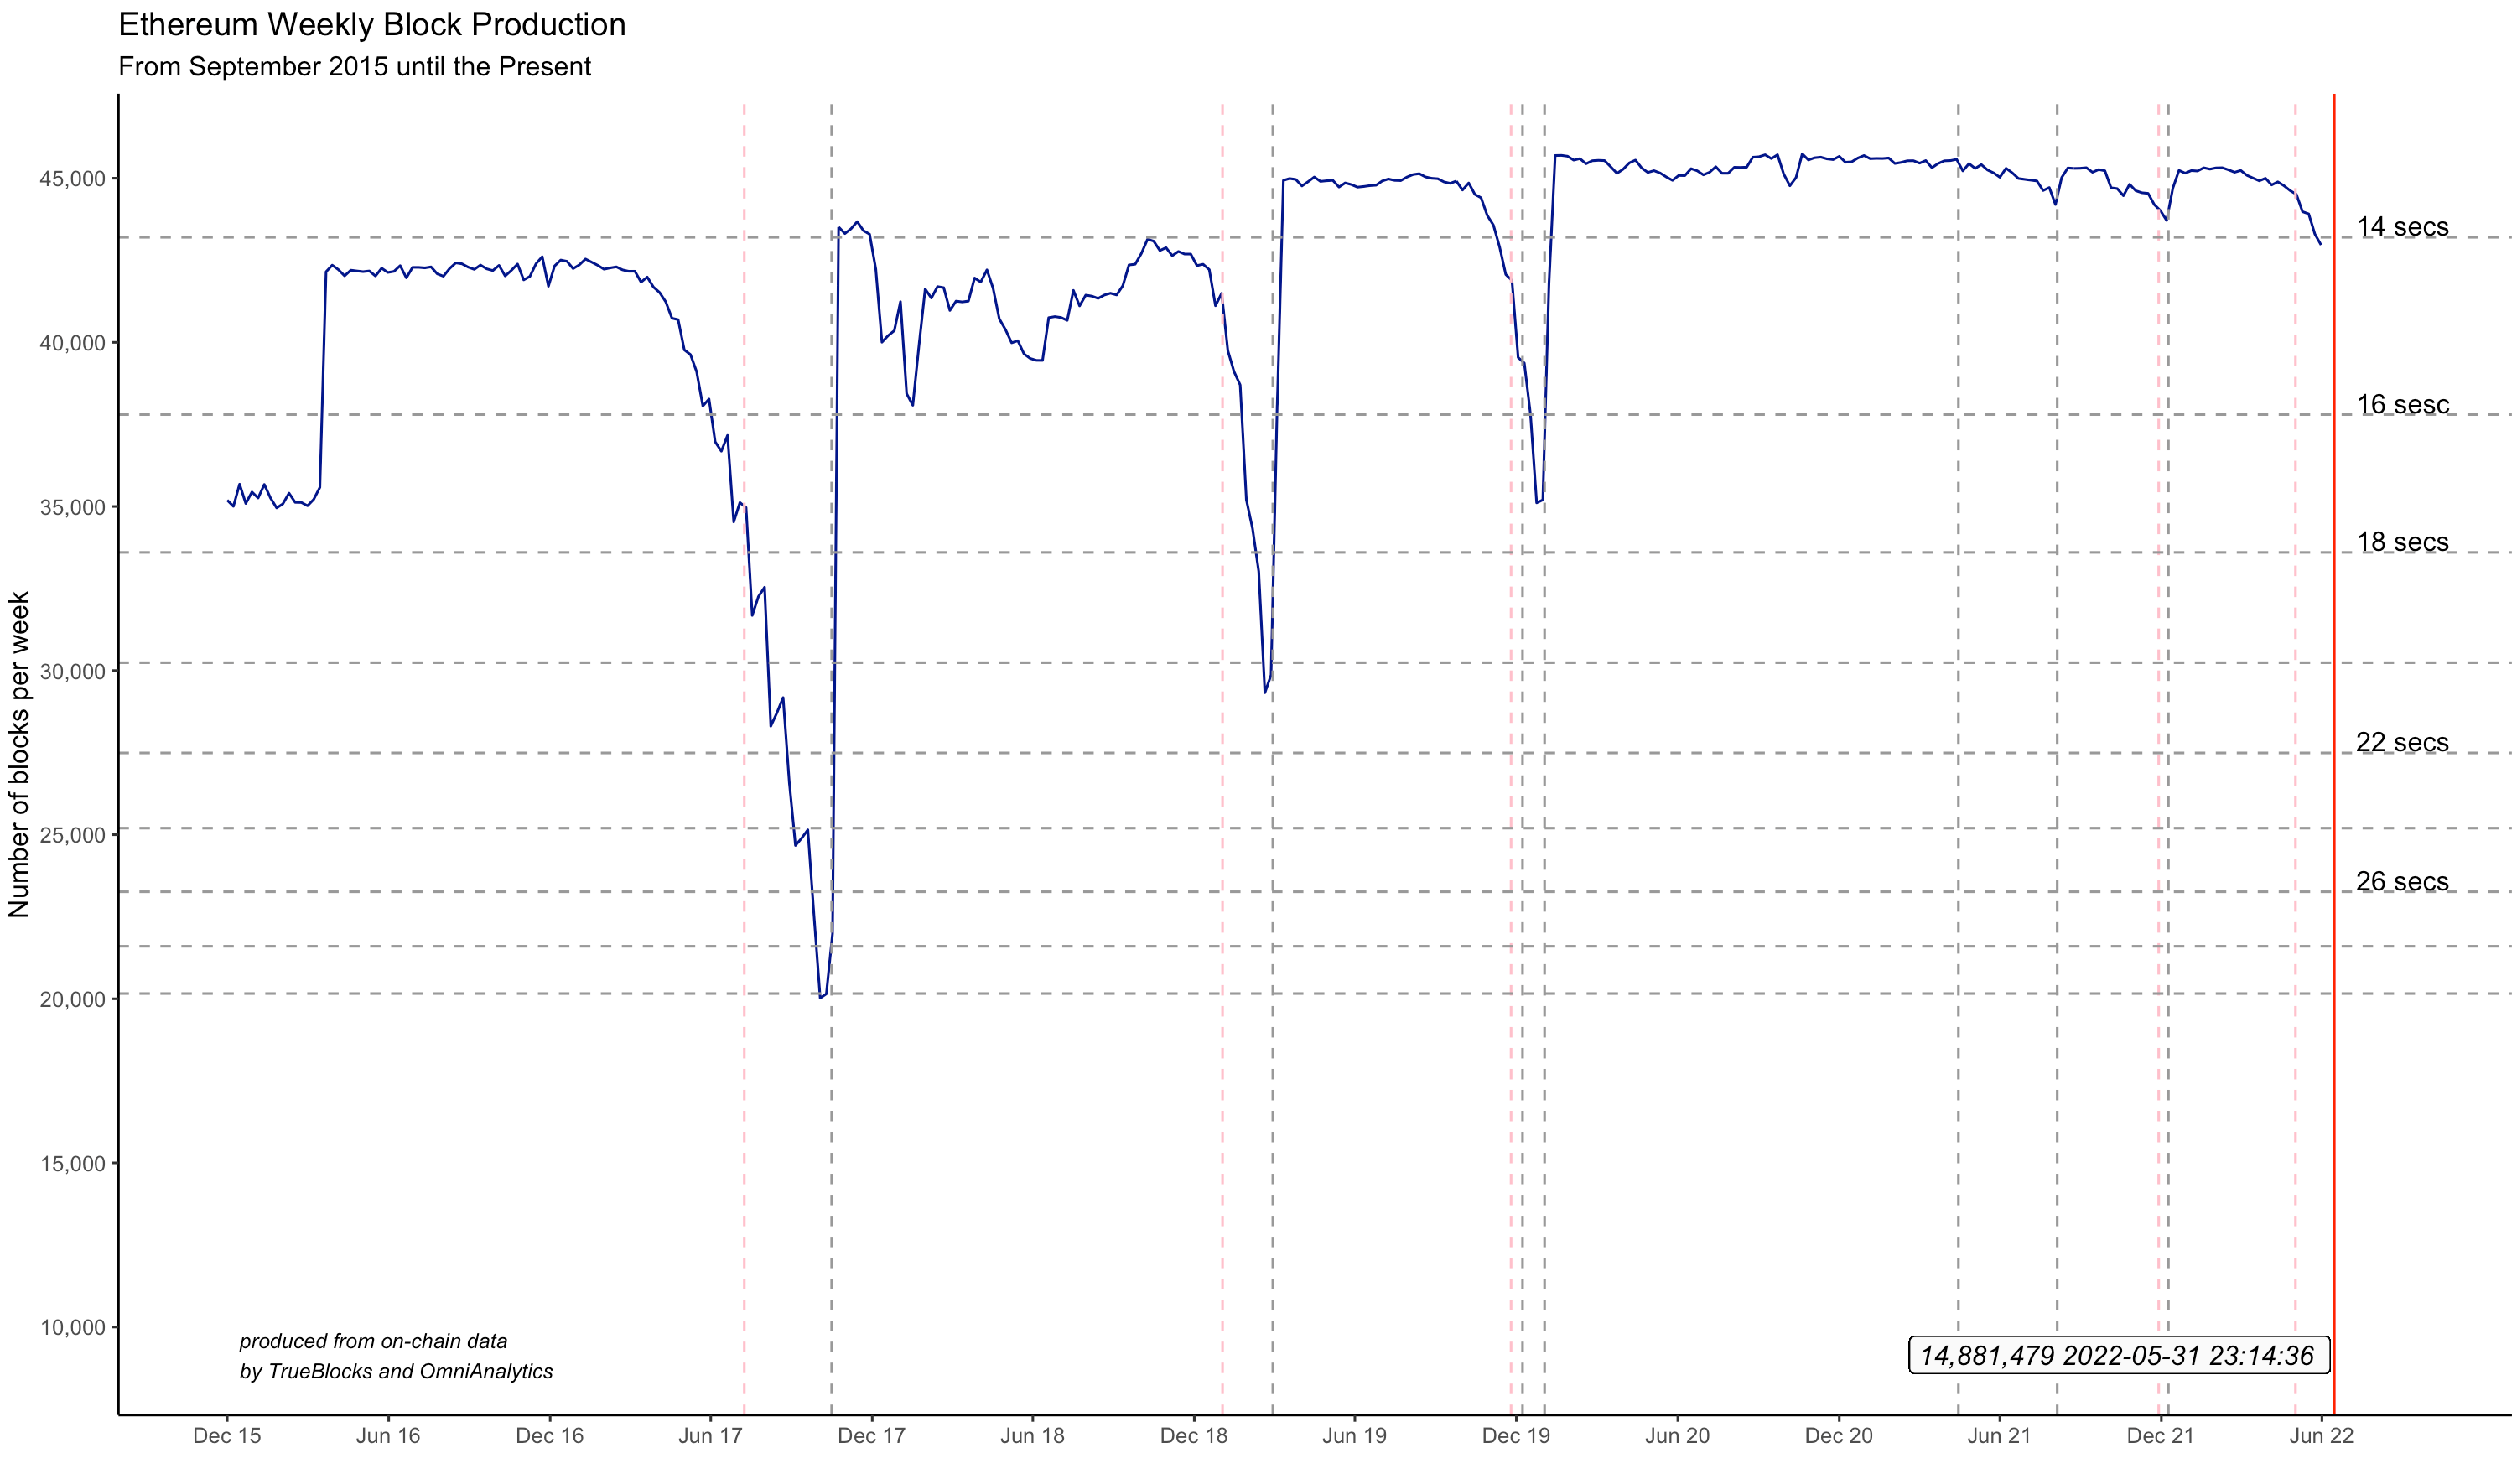
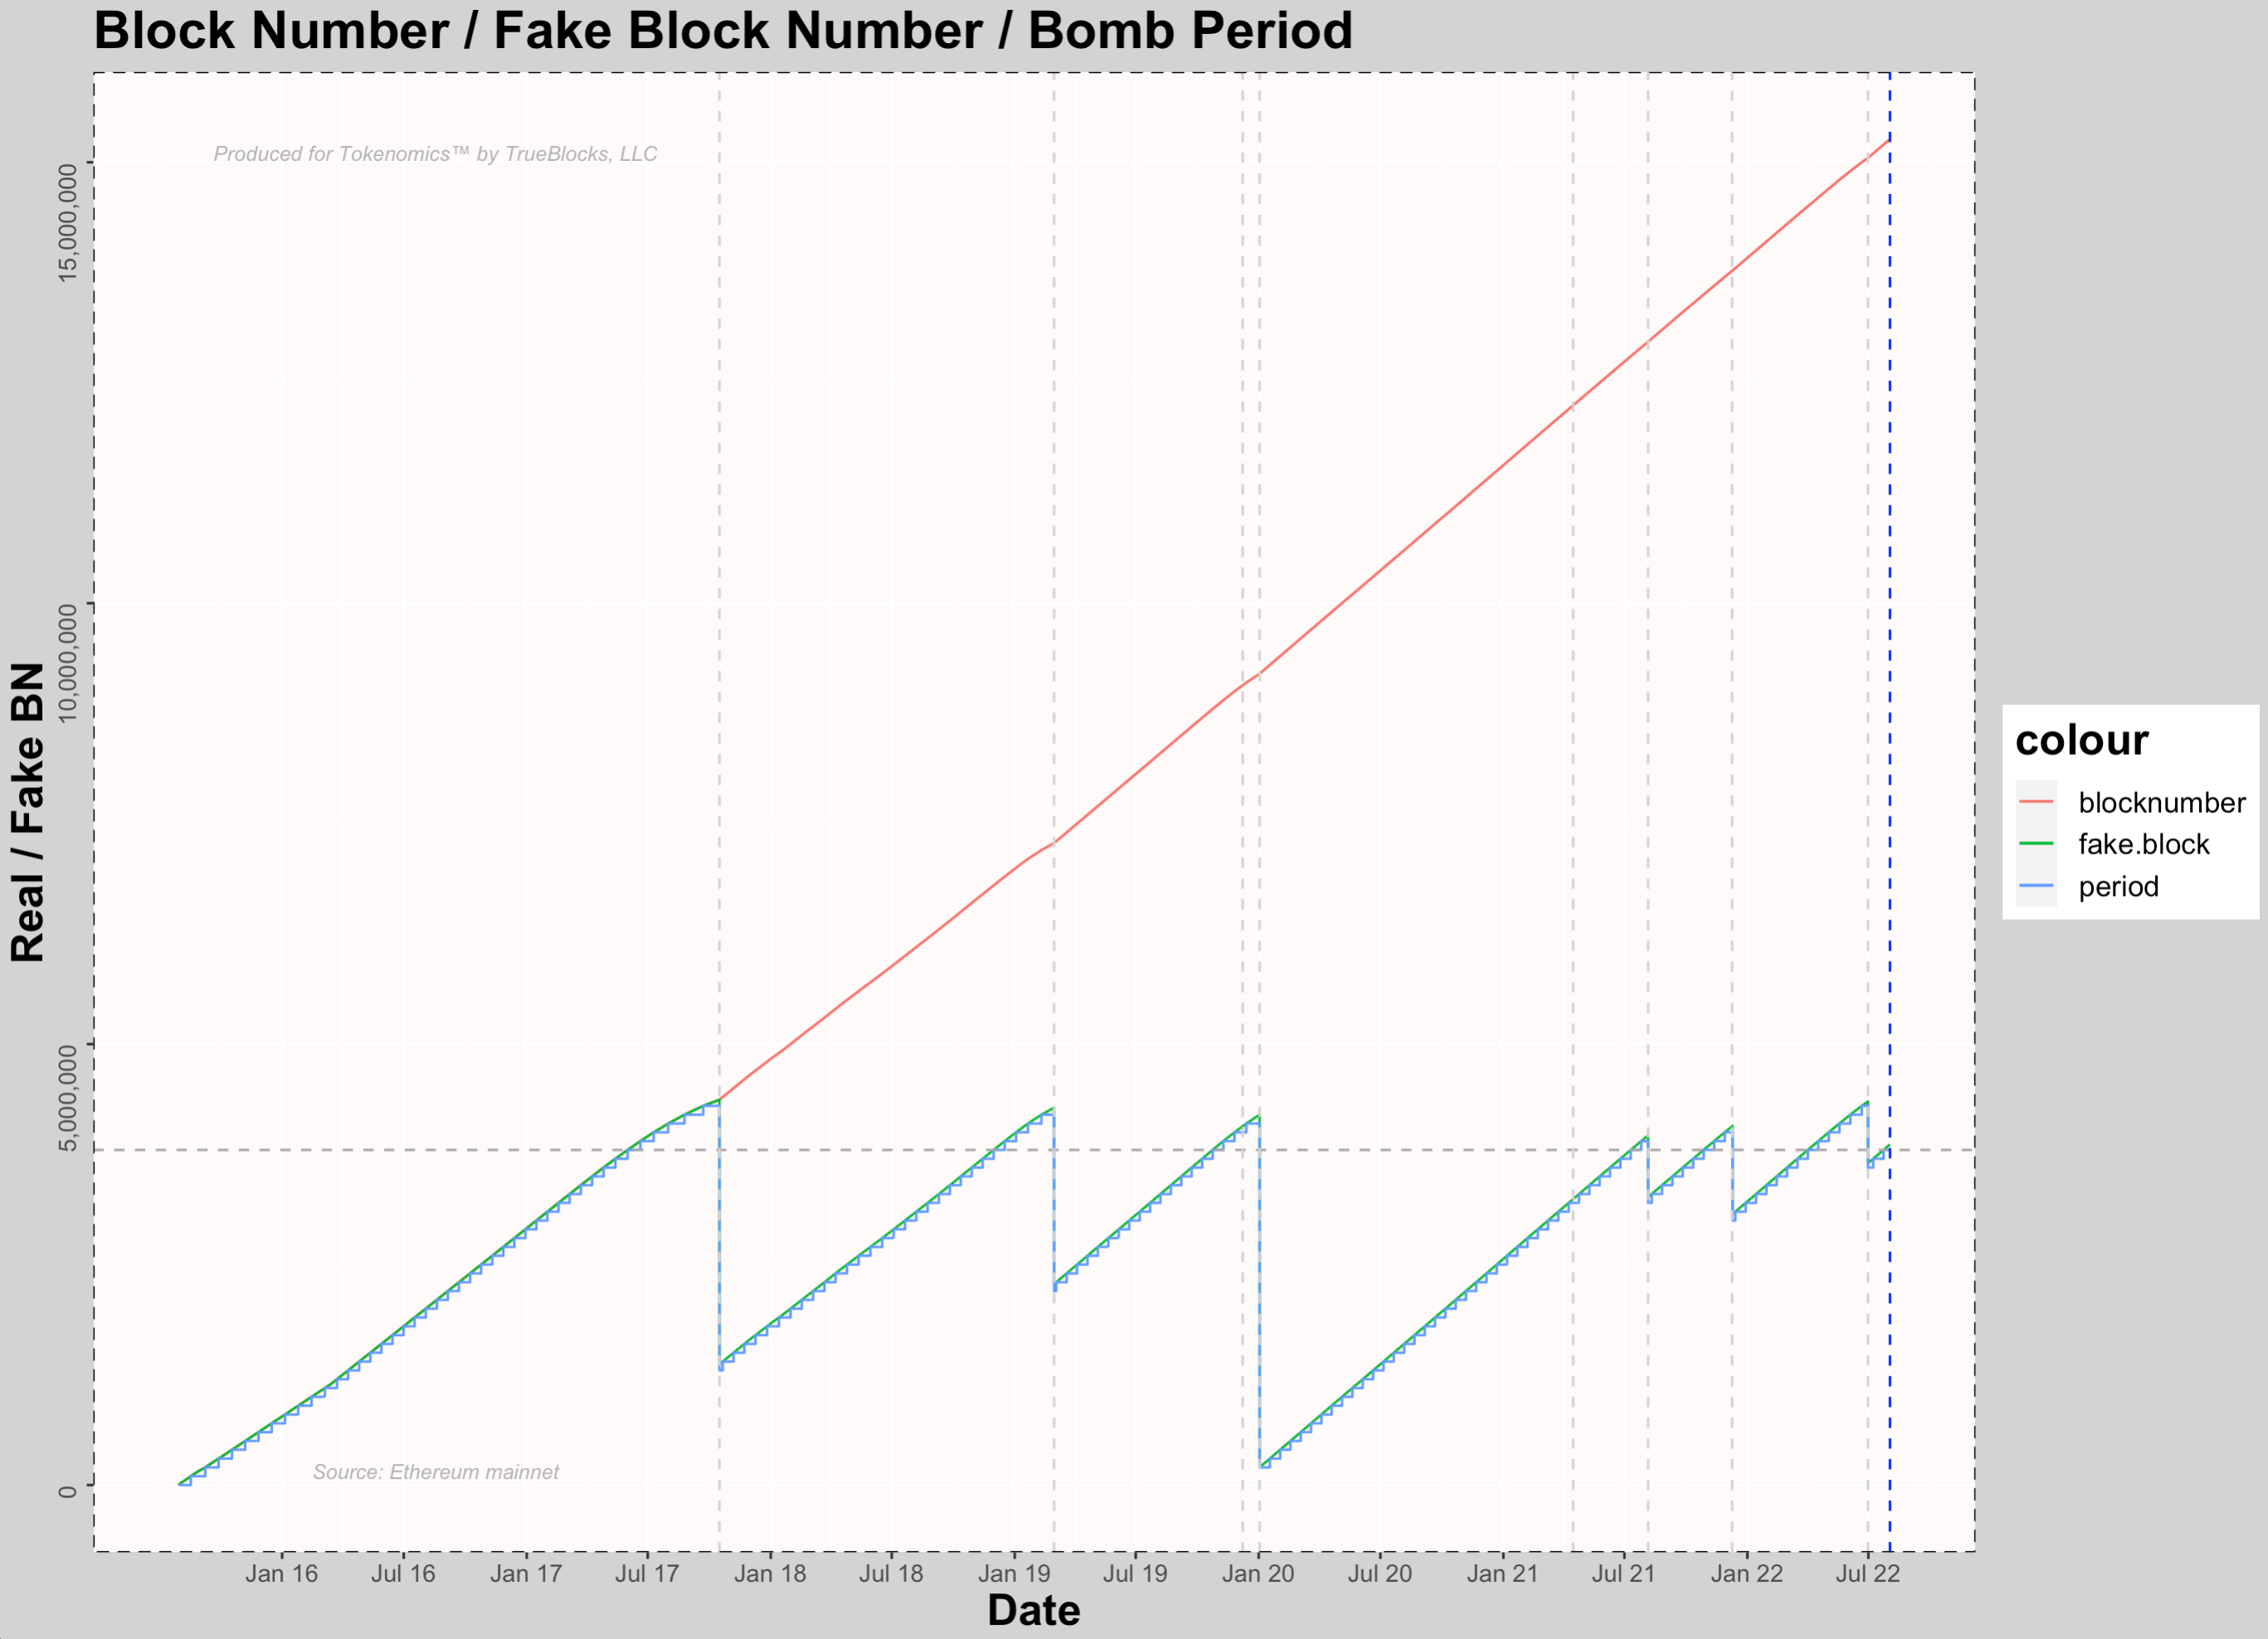
I thought I’d start publishing weekly difficulty bomb reports again. Please note that for the previous bomb, the charts I posted clearly indicated that the bomb was due in mid-June – see above. Apparently, there was a ‘script’ being used that was incorrect and some people were a bit surprised with how soon the bomb went off. That’s not necessary. These charts clearly show the status of the bomb and it’s quite easy to predict when it will go off, even visually.
Here’s the current status of the bomb. We just entered in period 38 (the dashed grey horizontal line) which, in the past, is when we should start paying attention. The previous bomb became onerous around period 43, about 500,000 blocks from now.
With this chart, you can see the reset clearly, but you can also start to see the bomb is “peeking its head up.” It’s in everyone’s interest, I think, to pay attention.