Predicting TTD on Ethereum
Total Terminal Difficulty represents all accumulated difficulty in the network. As the Merge happens with certain TTD, we should be able to predict how TTD value grows in the network and when to expect targeted TTD.
This post will be updated at Predicting TTD on Ethereum - HackMD rather than here.
Naive calculations
Let’s start with the most simple approach. Using average block difficulty and block time over past n blocks, we can naively estimate time left till targeted value.
First, we calculate the total value of difficulty left to overcome which means currently latest TTD value till targeted one. Dividing this number by average difficulty per block, we get estimation of blocks left. And multiplied by average block time, we have a rough estimation of time to achieve targeted value.
(targeted_ttd-current_ttd)/average_difficulty*average_blocktime
Let’s make this estimation using web3.py with averages from last 1000 blocks on Ropsten.
target=420000000000000

for i in range(1000):
	diffs.append(web3.eth.getBlock(latest_block-i).difficulty)
	times.append(web3.eth.getBlock(latest_block-i).timestamp)

avg_diff=np.average(diffs)
avg_time=np.average((np.diff(np.sort(times))))
time_left=(target-latest_ttd)/avg_diff*avg_time
print(datetime.timedelta(seconds =time_left))

#Output
2 days, 9:11:50
The problem with this naive approach is of course lack of versatility but most importantly precision. We are basically creating a linear regression but based on data which is far from linear, especially on testnets. However, this kind of estimation can be useful when the network is closely approaching the target, e.g. by minutes.
Linear regression
By collecting TTD data from the network, we can visualize it and play with more advanced predictions. For linear prediction, we can use handy python lib numpy. Based on our x (timestamps) and y (TTD) values, it creates coefficients for linear equation following the data.
linear_regression=np.polyfit(x, y, 1)
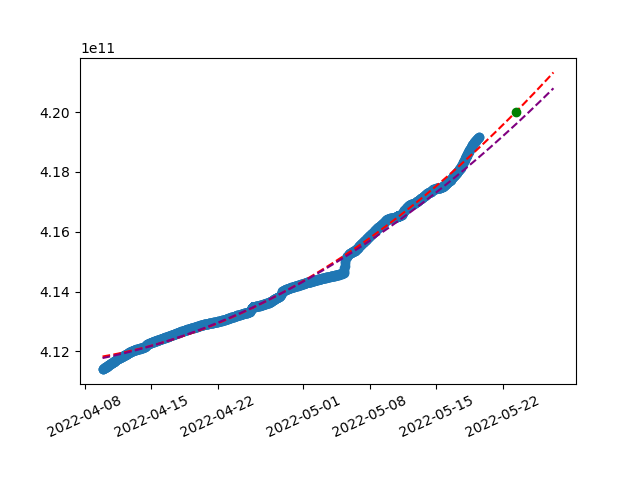
Here is the visualization of linear regression on last ~40 days from Ropsten created using this method:
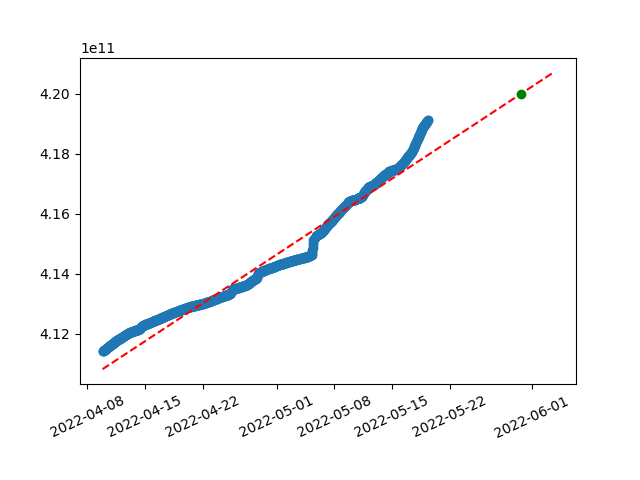
Collected data in blue, prediction equation dotted read and green dot showing targeted TTD value.
Polynomials
As you can see, with unstable hashrate on Ropsten, TTD is not growing linearly, rather a bit chaotically. This misleads our linear prediction, however we can still play around with data manually to achieve a nicer results. For example by using shorter time span of latest data or different granularity of timestamps (above has 60 minutes spans).
Another variable to improve here is degree of polynomial we use for the equation. We don’t have to stop at linear prediction, let’s try using polynomials instead just linear equation. With quadratic polynomial, result tends to fit into the non-linear data set much better:
y=(0.0004085236*x^2)+(-1347104.0291138189*x^1)+(1110928405569350.5000000000)
Substitute x with unixtimestamp
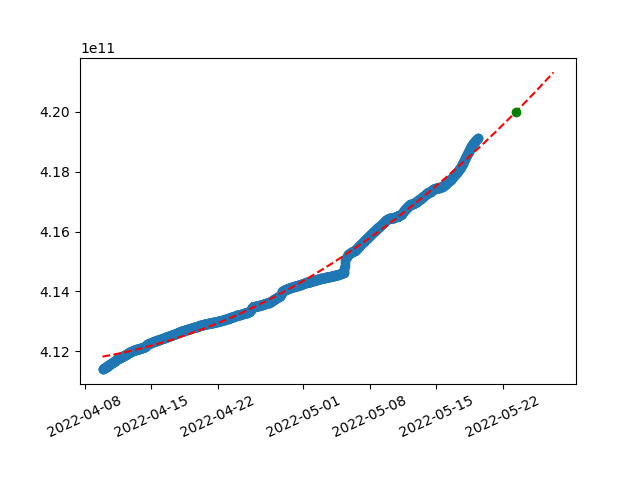
Wonder how it will look like with a third degree polynomial?
y=(0.0000000001*x^3)+(-0.3952123270*x^2)+(651889194.0411562920*x^1)+(-358423188503889536.0000000000)
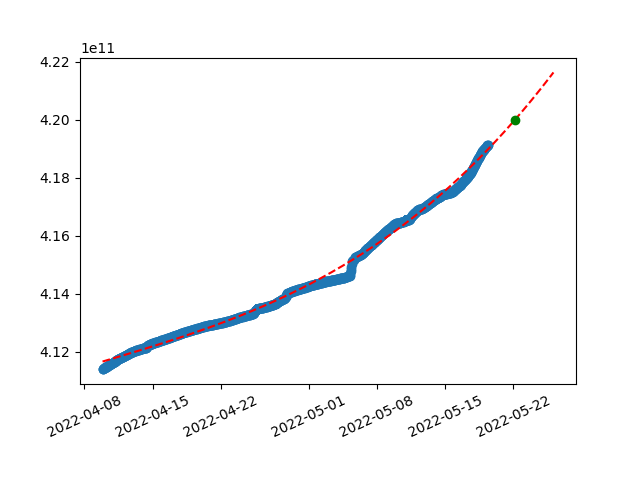
With third degree, line starts to grow even faster and gets exponential. We could iterate trough higher degrees till results get weird or numpy breaks. But it wouldn’t be wise to judge these results only by a bare eye.
Error analysis
Charts can guide us to see whether we are choosing the right approach but for mathematical error handling, let’s calculate Mean Squared Error as
#MSE = Average of differences between predicted and real value squared

for i in len(x):
mse[i]=(p(x)-y)^2
average(mse)
Lower value of MSE shows that the prediction curve fits the real dataset better. Now we can iterate trough variables and find MSE with lowest value.
We can also add calculated standard error of the regression (S) to the model and create sort of boundaries which reflect the bias in prediction.
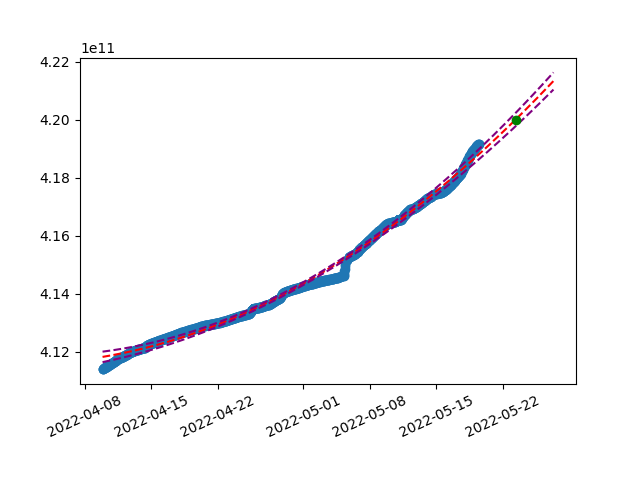
Naturally, the spread grows as we get further. It is not easily readable on the chart, example of text output:
Total Terminal Difficulty of 42000000000000000 is expected around Mon May 23 08:04:57 2022 , i.e. between Sun May 22 15:40:22 2022 and Tue May 24 01:54:12 2022
Another error estimation which can help us to find better prediction parameters is train-test split. By dividing collected data in two parts (e.g. 70/30), we can create the polynomial equation on training data set and compare the error with real data (test set).
Polynomial created on train set has a higher error and we can see how it deviates. Mean squared average of this error is another metric to guide us while trying to find precise estimation.
Prediction tool
Based on what I learned and described above, I built a tool which can help you with all of this.
It includes multiple functions for creating the prediction:
- First it collects data from a network based on chosen parameters
- In
wenmerge.py, choose web3 provider, block number as start of the data set and interval - If
result.csvis available, this existing data will be updated and used for prediction. Delete it to crawl your own
- In
- Constructs polynomial of chosen degree and if target is set, prints predicted values
- Set target by modifying
.envfile
- Set target by modifying
- It can give you more data about the output like the created equation, charts, MSE
- Serves the data as API and provides it to vue.js frontend
- This is WIP, limited usage, bunch of bugs
There still are still bugs and edgecases not handled. If you run into an error, just run the script again, maybe few times. If are not getting desired result, open an issue please.
The results are continuously published on https://bordel.wtf and https://psttdtest.ethdevops.io/.
Other approaches
There are other projects within the ecosystem who implement some sort of TTD estimation tool. Let’s compare our results with them to further verify the precision. Currently I am aware of two other sources of predictions -
Folks from wenmerge.com, CExAU created API at https://oii5lti997.execute-api.ca-central-1.amazonaws.com/default/getTimeTillTtd which we can call by POST with a body such as:
{
    "network": "mainnet",
    "date": [2022,6,6, 12,0,0]
}
The other one is Teku client which gives you ETA of the TTD value set for the Merge. Here is the implementation - https://github.com/ConsenSys/teku/pull/5437
10:09:48.109 INFO - TTD ETA: 1 days, 0 hours and 33 minutes - Current Total Difficulty: 0x000000000000000000000000000000000000000000000a2cfb470ab55c44757c
Best result should be achieved by cross verifying different sources by finding differences between naive computation, polynomial prediction, the API…
And what now?
Right, you play with data for weeks and tried various approaches. After many considerations, you finally make your prediction and get excited for the Merge. And then this thing happens
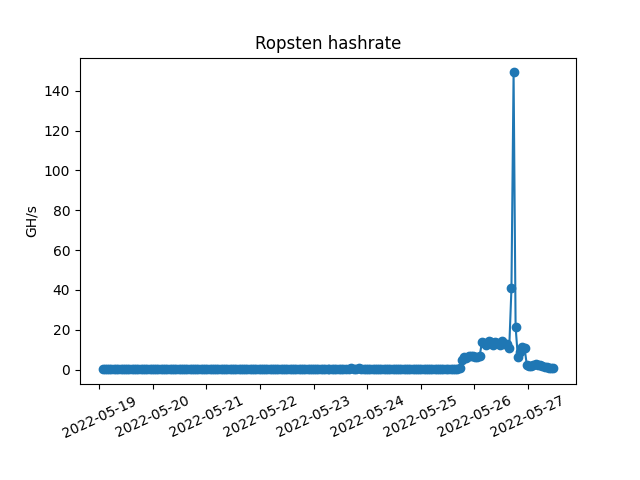
friggin Ropsten.
Predicting TTD is pretty challenging on Ropsten as hashrate on testnets is very volatile. On mainnet, data prediction gets much easier with more linear data.