N.B.: Due to the limit to the new users, you can read the full version at: Who Takes The Tastiest Piece of The MEV Supply Chain Cake?
Delving into the intricacies of the Ethereum economy, the benefits of the Maximal Extractable Value (MEV) supply chain emerge as a fascinating study. This complex web of interactions, particularly between builders and validators under the current PBS scheme, can be explored through the Sankey Diagram below. This diagram, a rich data visualization tool, eloquently traces the MEV sources - some identifiable and some yet enigmatic. Let’s take a closer look at this data and its implications.
How Is The Cake Baked: Value Allocation In MEV Supply Chain
MEV Accounts for 51.6% of Builders’ Revenue, Validators Stand as Top Beneficiaries.
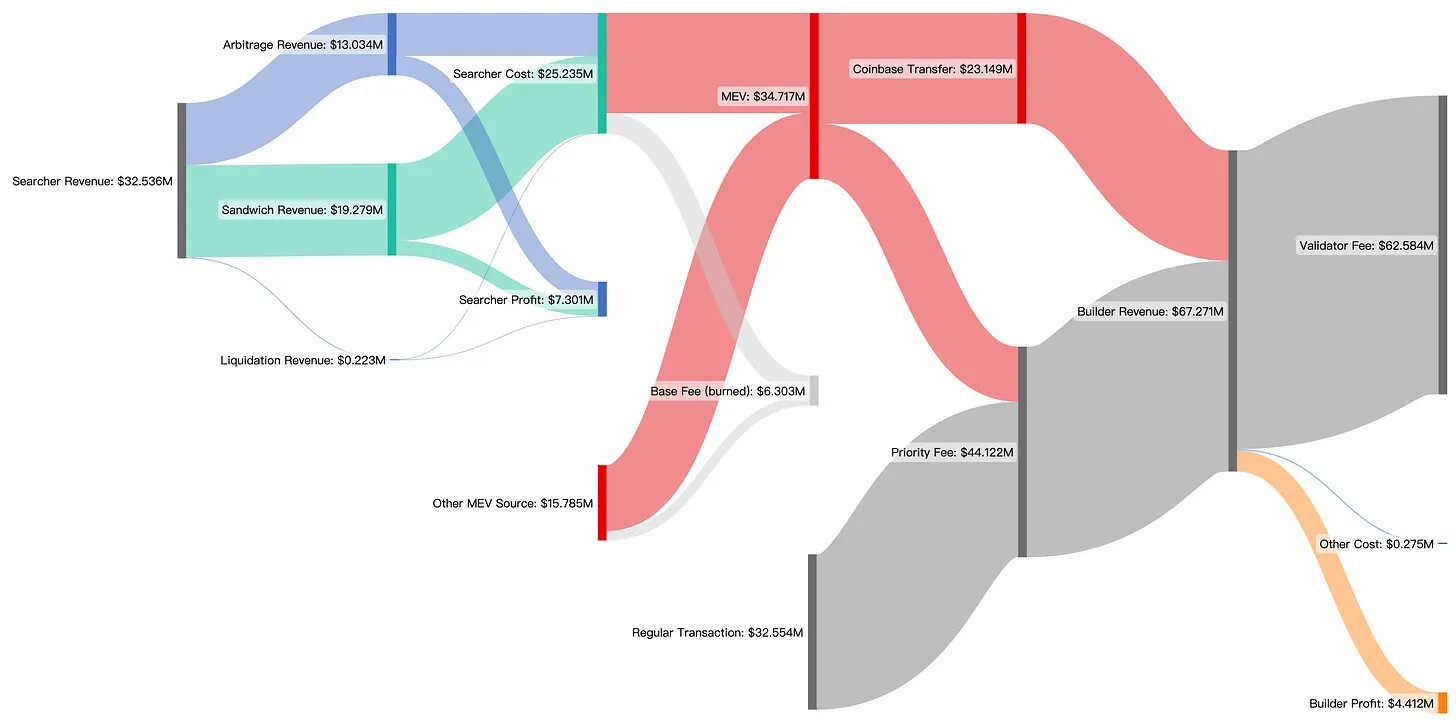
The Sankey Diagram above illustrates the benefits flow of the MEV supply chain for different parties, specifically builders and validators under the current PBS scheme. It emphasizes the distribution of MEV sources from three MEV types identified by EigenPhi and those that remain unidentified.
The chart displays data from January 1, 2023, to February 28, 2023. During these two months, EigenPhi identified 975,290 transactions involving MEV payments. EigenPhi’s algorithm classified 64% of these transactions as originating from three mainstream types of MEV bots. These bots generated a profit of $7.3 million collectively and contributed $18.9 million toward MEV payments.
The remaining 36% of transactions, with undefined types, accounted for $15.8 million in MEV payments. These yet-to-be-strictly defined categories include Just-In-Time (JIT) transactions, statistical arbitrage, DEX-CEX arbitrages, and private orders, among others.
Of these MEVs, $23.1 million is directly transferred to the builder’s address through coinbase.transfer(), while the remaining $11.6 million is paid to the builder as priority fees.
MEV accounts for 51.6% of the builder’s revenue, with the remaining 48.4% coming from priority fees paid by regular transactions.
It should be noted that a portion of the gas fees from searchers and other users will be burned in the form of base fees, and the base fees paid by regular transactions ($227.2 million) are omitted from the graph.
However, despite the builder’s revenue reaching an impressive $67.3 million, 93% is allocated toward bidding in relay auctions to compensate validators, ensuring that the validators will eventually propose the blocks. As a result, the builder’s explicit revenue for these two months amounts to a mere $4.4 million. And the validators eventually received $62.6M during the first 2 months of 2023.
Thus, most of the builder’s revenue is distributed to the validator through Relay’s auction market. Considering only the MEV part and assuming that the builder transfers all regular transaction fees to the validator, it remains essential to allocate 88% of the MEV to the validator to guarantee that the builder’s block is successfully proposed.
Oligarchs Take the Biggest Pieces, Be It for Builders or Validators
The market competition between builders and validators exhibits an apparent oligopoly effect, with Lido claiming a 30% market share.
Please find the image in the page Who Takes The Tastiest Piece of The MEV Supply Chain Cake?.
The market competition between builders and validators displays a clear oligopoly effect, as the top three contenders secure about 50% of the total profits. By adopting dual roles as both builders and validators, industry leaders manage to dominate the market. Currently ranking first, Lido amassed about 21 million in profits in two months, claiming a 30% market share. Meanwhile, the runner-up, tagged as Coinbase by mevboost.pics, occupies approximately 15% of the market share.
Interestingly, Lido’s market share in terms of profits also aligns with its staking weight and the probability of proposing new blocks. According to Dune data, as of May 6th, Lido has staked a total of 6,038,112 ETH with 189k validator nodes, accounting for 31.9% of the market share in proposals. Moreover, our on-chain data analysis shows that Lido’s share of proposing blocks on their own or obtaining auctioned blocks from Relay is around 30%. Assuming 1 ETH equals 2,000 USD, the block’s transaction fees and MEV revenue generate approximately 1% annualized return for Lido.
The Frosting on the MEV Cake
In conclusion, the MEV market, as illustrated by the Sankey Diagram, provides a rich cake with multiple layers of revenue for builders and validators. The majority of these profits are scooped up by market leaders like Lido, who have managed to carve out the largest slice for themselves. While the MEV ‘cake’ is substantial, it’s worth noting that the distribution of this cake is not even, with a significant portion going towards relay auctions.
With the market displaying clear signs of oligopoly, and MEV revenues playing a pivotal role in builders’ profits, the future landscape of this space will likely be shaped by the strategies these leading entities employ to maintain their sizable pieces of the delicious cake made of MEV.