I would like to thank the teams at Flashbots, Titan, and Ultrasound for kindly sharing their data. I would also like thank the ethPandaOps team for collecting the attestation and block arrival data and for providing access to Xatu’s ClickHouse instance. Finally, a big thanks to Thomas Thiery, Anders Elowsson, Barnabé Monnot and Marios Ioannou for their feedback and suggestions.
TL;DR
This analysis looks into arrival times for blocks and attestations and covers 1 week of Ethereum slots from early August 2025. It aims to assess the feasibility of EIP-7782, which proposes reducing the slot to 6 seconds by setting the attestation deadline to 3 seconds and the aggregation deadline to 4.5 seconds.
Blocks generally arrive close to the attestation deadline (the 95th percentile is 3.3s). However, the pure block propagation time (defined as the time elapsed since the block was published by a relay) is under 1 second. In a sample of slots where the block came from Ultrasound, Flashbots, or Titan, the 95th percentile is around 800ms. This suggests that the start of the slot is not being used solely for block propagation, and there is likely some slack in the attestation timings within the current slot structure.
Attestations for missed slots, which reveal pure propagation times, arrive on average 831ms after the 4s mark. Subnet supermajorities form in under 830ms, while the 95th percentile takes 1962ms.
For slots where the header originated from a relay, attestations arrive in less than 4.5 seconds after the block was published by the relay (still below the proposed 4.5-second aggregation deadline for six-second slots). The distribution is bi-modal, with modes around 1.2s and 3s. The source of the two modes is the entity making the attestation. This can be due to network connectivity, attesting strategies, or misconfigurations.
Validator entities are the strongest drivers of late attestations. Some operators consistently report later than others, and a single misconfigured entity can significantly skew the results. Block content also matters: higher gas use and more blobs increase the odds of lateness.
Introduction
This report contains the main results from analyzing block and attestation arrivals collected from Ethereum nodes between slots 12243599 and 12293998, which corresponds to roughly one week of slots during the first week of August 2025.
The goal of this analysis is to gather a first-level understanding of the feasibility of EIP-7782, which proposes to reduce the slot to 6 seconds by moving the attestation deadline to 3 seconds and the aggregation deadline to 4.5 seconds.
Our analysis focuses on three different metrics, which are illustrated in the diagram below.
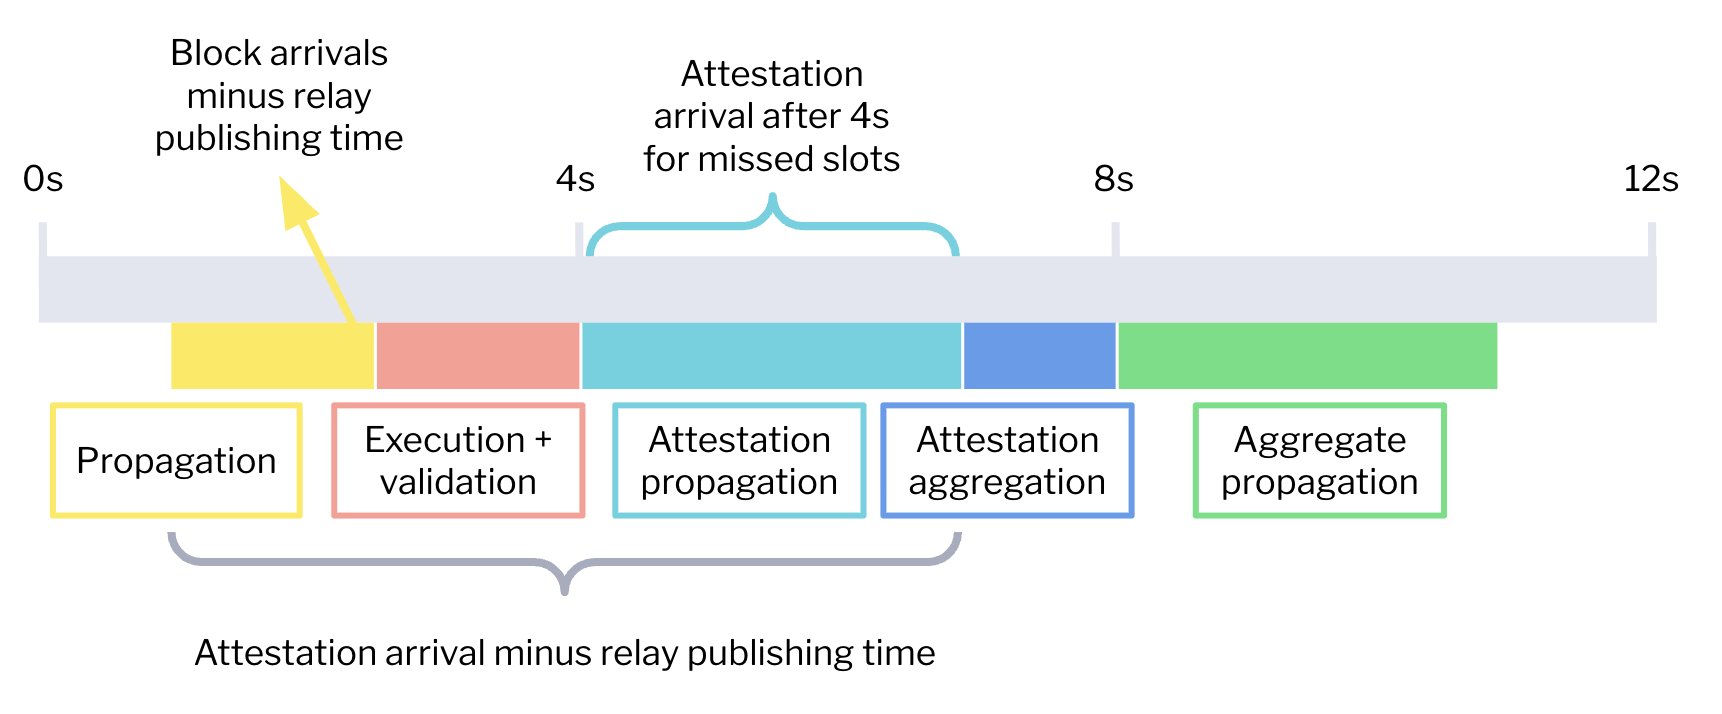
First, we look into block arrival times. The block arrival time corresponds to the time when the beacon node first saw the block. From this block arrival, we compute two propagation metrics:
- The number of milliseconds between the block arrival time and the time when a relay published the block payload. This block propagation metric is represented in yellow in the diagram and aims to discount timing games. However, since we only collected data from the Ultrasound, Flashbots, and Titan relays, this metric is only reported for a sub-sample of slots.
- The number of milliseconds between the block arrival time and the start time of the slot. As this metric does not require relay data, we can report the full slot sample. However, because of timing games and block-building logic, this metric is an overestimation of the actual propagation time needed.
Second, we analyze the attestations for missed slots. In these slots, the block payload was never made available, and thus, we know that validators waited until the 4-second deadline to attest. This allows us to compute the pure attestation propagation time by taking the attestation arrival time in the beacon node minus 4 seconds. This is the light-blue component in the diagram above.
The third and final metric attempts to estimate the total time required to propagate the block through the P2P layer, including execution, validation, and propagation of attestations. It corresponds to the yellow, pink, and light blue components of the diagram. Similarly to the block propagation metric, we compute the attestation arrival since the block was published by the relay, to account for timing games. We use the same publish times shared by the Ultrasound, Flashbots, and Titan relays as in the block propagation metric.
Data gathering
- The relay publishing times were kindly provided by the teams at Flashbots, Titan, and Ultrasound. The datasets contain the number of milliseconds since the start of the slot when the relay replies to a
/eth/v1/builder/blinded_blocksrequest by sending the block payload to the beacon node. - The block arrival times were collected from Xatu’s Beacon API Event Stream tables. These tables contain the events generated by internal nodes run by the ethPandaOps team and community nodes that chose to share their metrics with the ethPandaOps team. On one hand, the inclusion of community data provides a much wider pool of beacon nodes and geographical locations. However, this comes with a drawback - the data is more prone to errors because it cannot be validated. The SQL query for gathering the data can be found in
beacon_blocks.sql. - Attestation arrivals were collected from Xatu’s Consensus Layer P2P tables. We filtered the data to only include the messages generated by a set of nodes managed by the ethPandaOps team that are running a fork of the Prysm consensus clients designed to gather P2P-related data. The logic to collect the data for missed slots can be found in
atts_missed_runner.py. The logic to collect the data for relay slots can be found inatts_sample_runner.py. - The mapping between the validator ID and the validator entity was collected from ethseer.io. This data can be directly queried from Xatu’s ClickHouse instance by using the table
ethseer_validator_entity. We implemented this query in the function get_validator_ethseer_info.
Block propagation
Out of the 51139 slots in our dataset, 47.6% don’t have relay data. These slots were either provided by other relays or were self-built. The remaining 41.3% were published by Ultrasound, 5.8% by Flashbots, and 5.3% by Titan. For each slot, we have block arrivals for 109 community nodes and 29 internal nodes. Nodes have a variety of clients and geographical regions.
Focusing on the subset of slots for which we have relay data, we can see in the following two plots the distributions of the block propagation since the block was published, split by node client and node country. The boxplots show the three quartiles in the colored boxes and the variability outside the upper and lower quartiles in the extending lines. The dots are outliers.

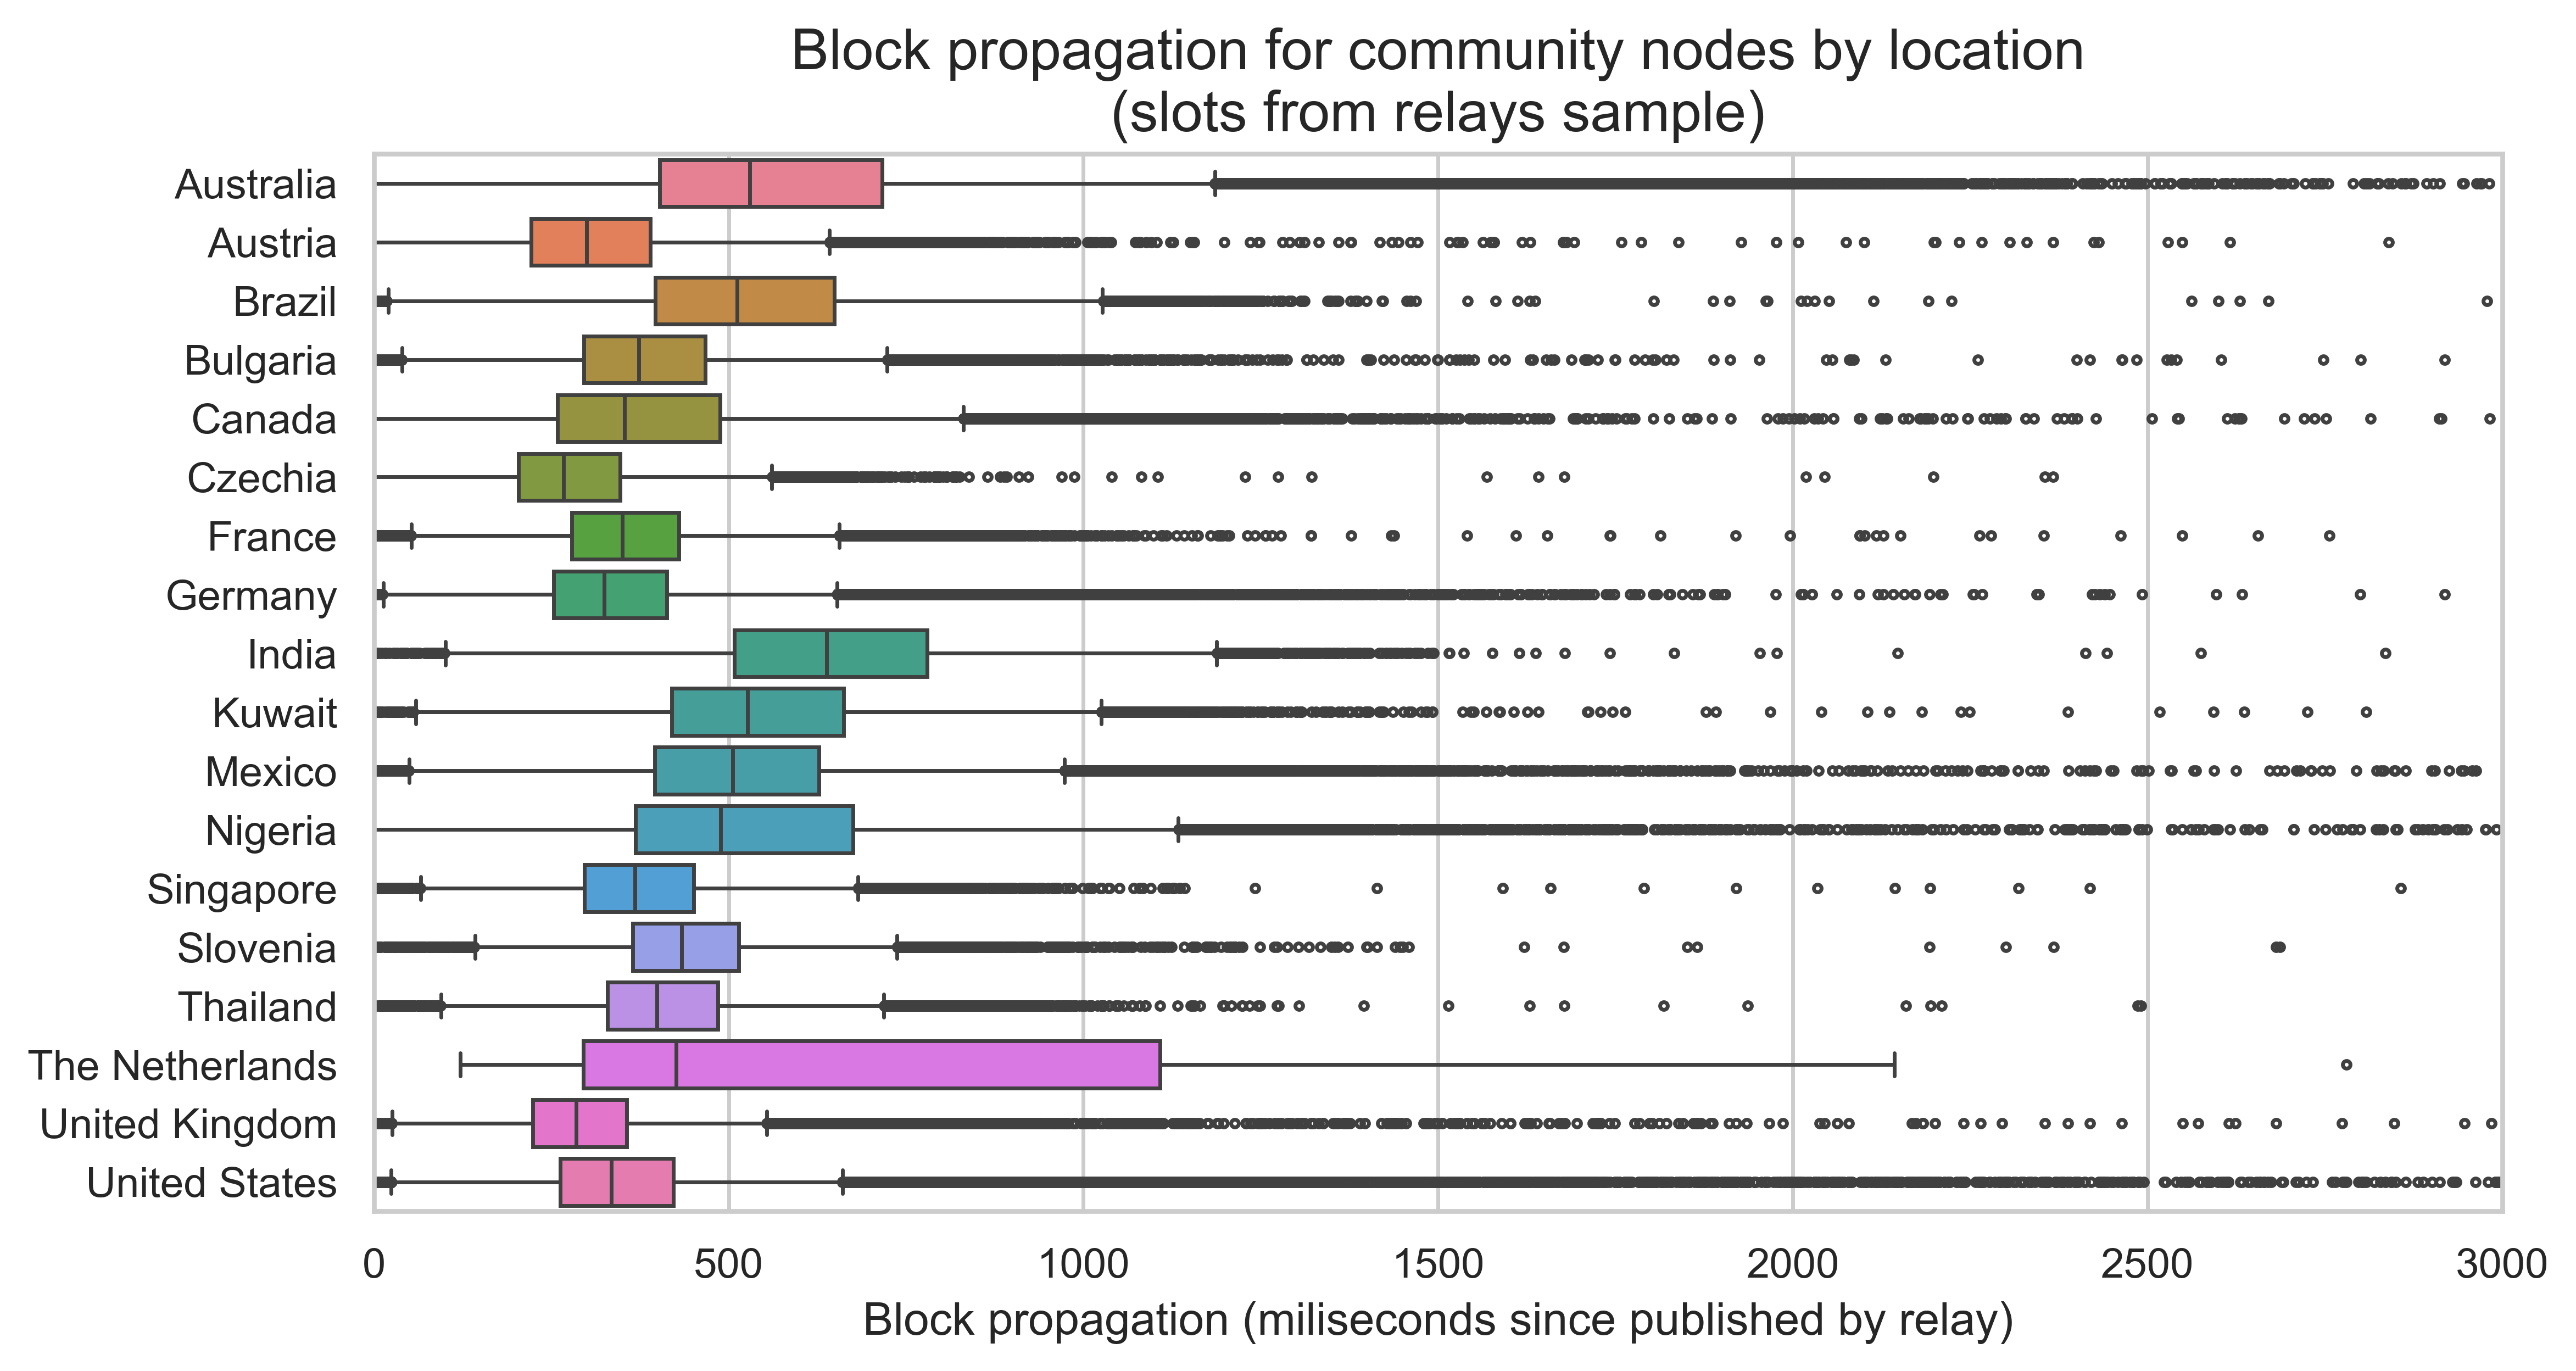
There are some variations by client, with Lodestar and Caplin showing slightly larger propagation times. Recall, that Caplin is the consensus client embedded in the Erigon execution client. It acts like any other Consensus client, but it is fully integrated into the execution layer.
Countries also vary, with the Netherlands showing a surprisingly skewed distribution. However, the Netherlands only has 99 observations in our dataset, while the remaining countries have between 45 and 50 thousand, so the sample may not be representative. After the Netherlands, Australia, India, and Nigeria show the longer propagation times.
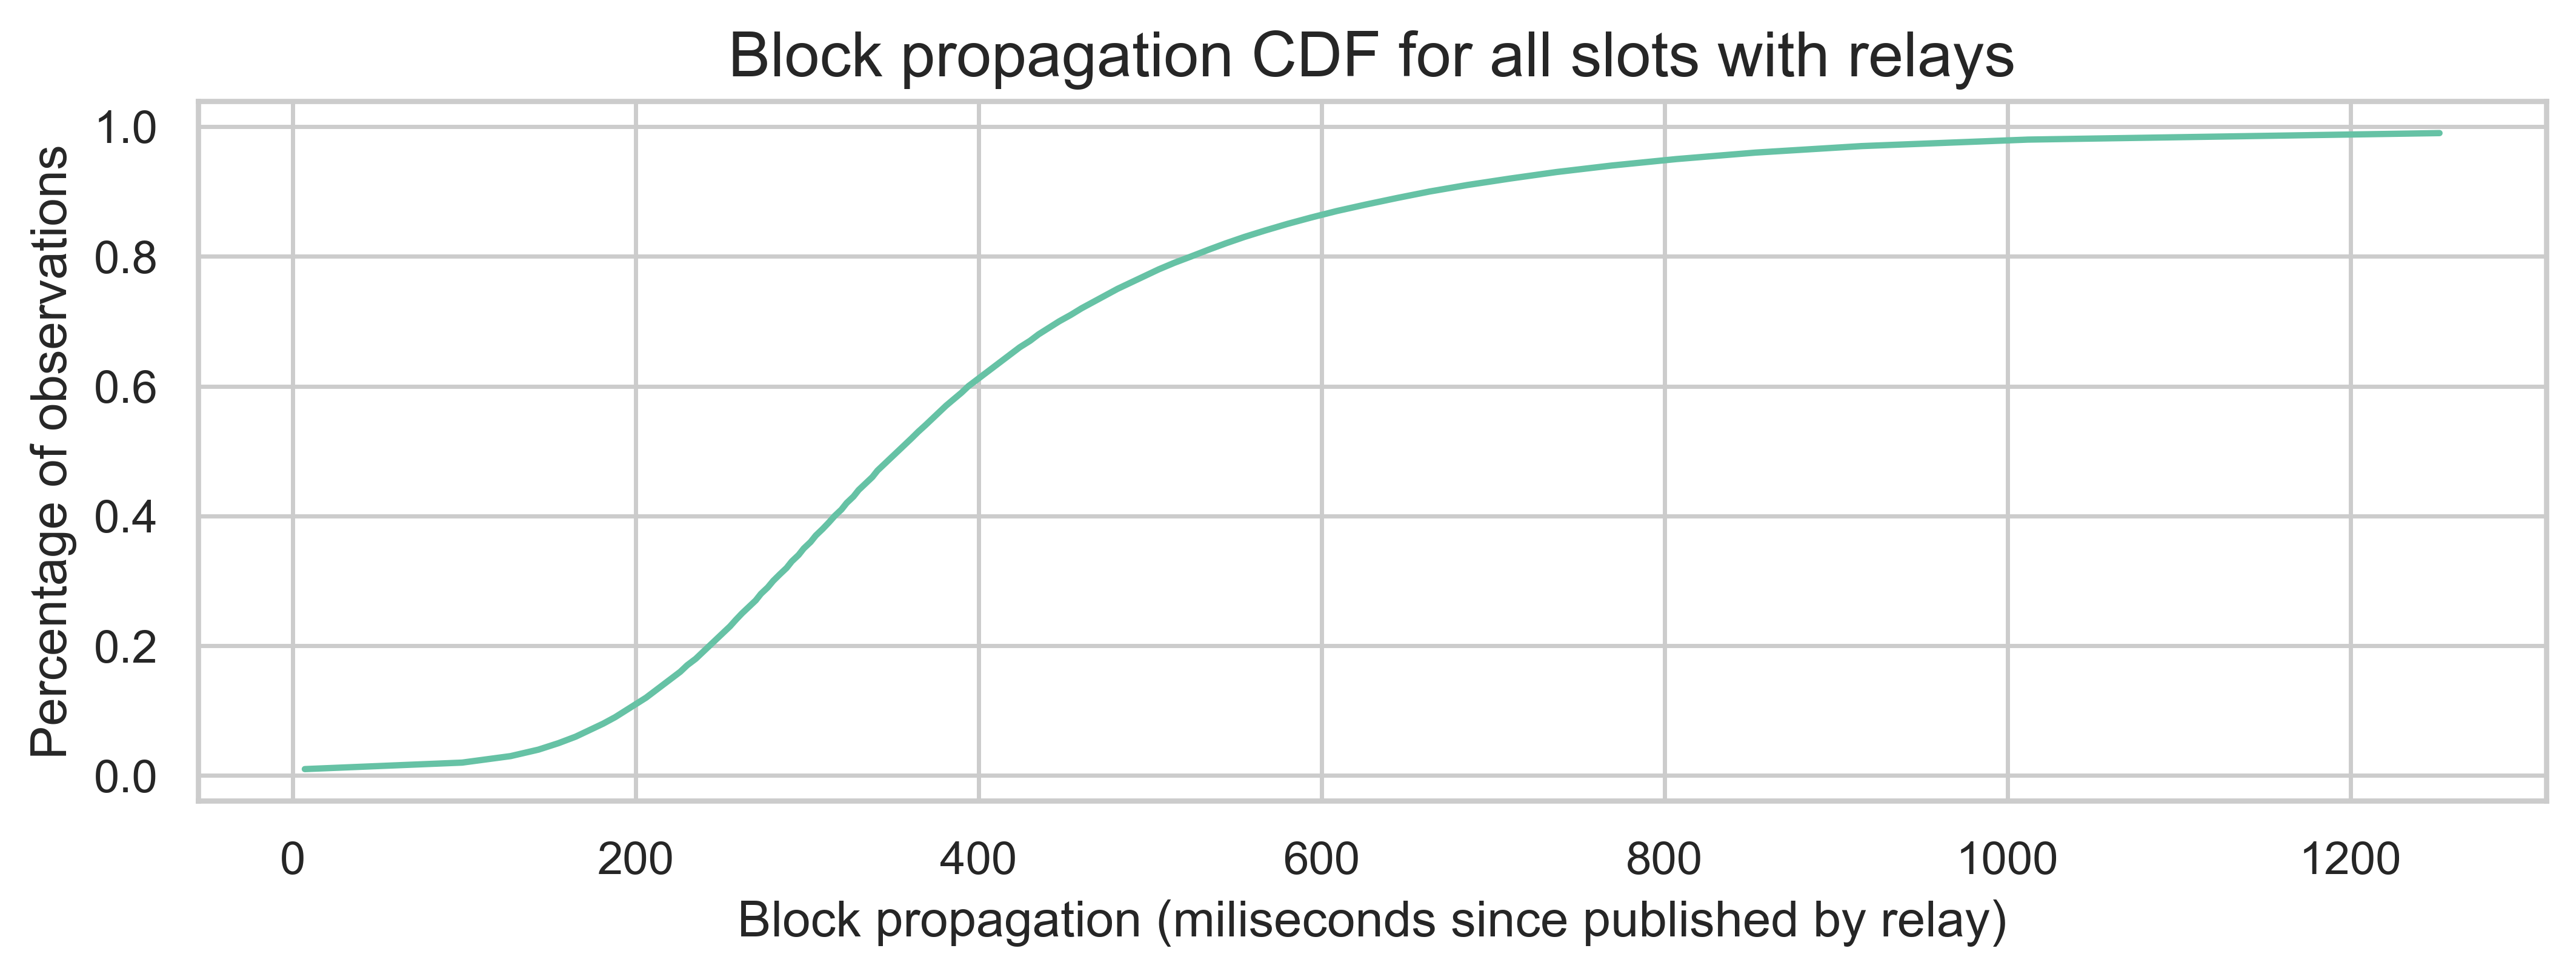
Independent of the observed variations, most nodes still receive the block in under 1 second. The 95th percentile of block propagation since it was published by the relay is 816 ms for Xatu’s internal nodes and 804 ms for the community nodes. The following plot shows the CDF of the block propagation times since the block was published by the relay.
The final plot shows the distribution of the block arrival times since the start of the slot by header source. As we previously explained, this is an overestimation of the block propagation time as it also includes the time spent block building and interacting with mev-boost. However, it allows us to understand how the sub-sample of relay slots compares to the remaining slots.
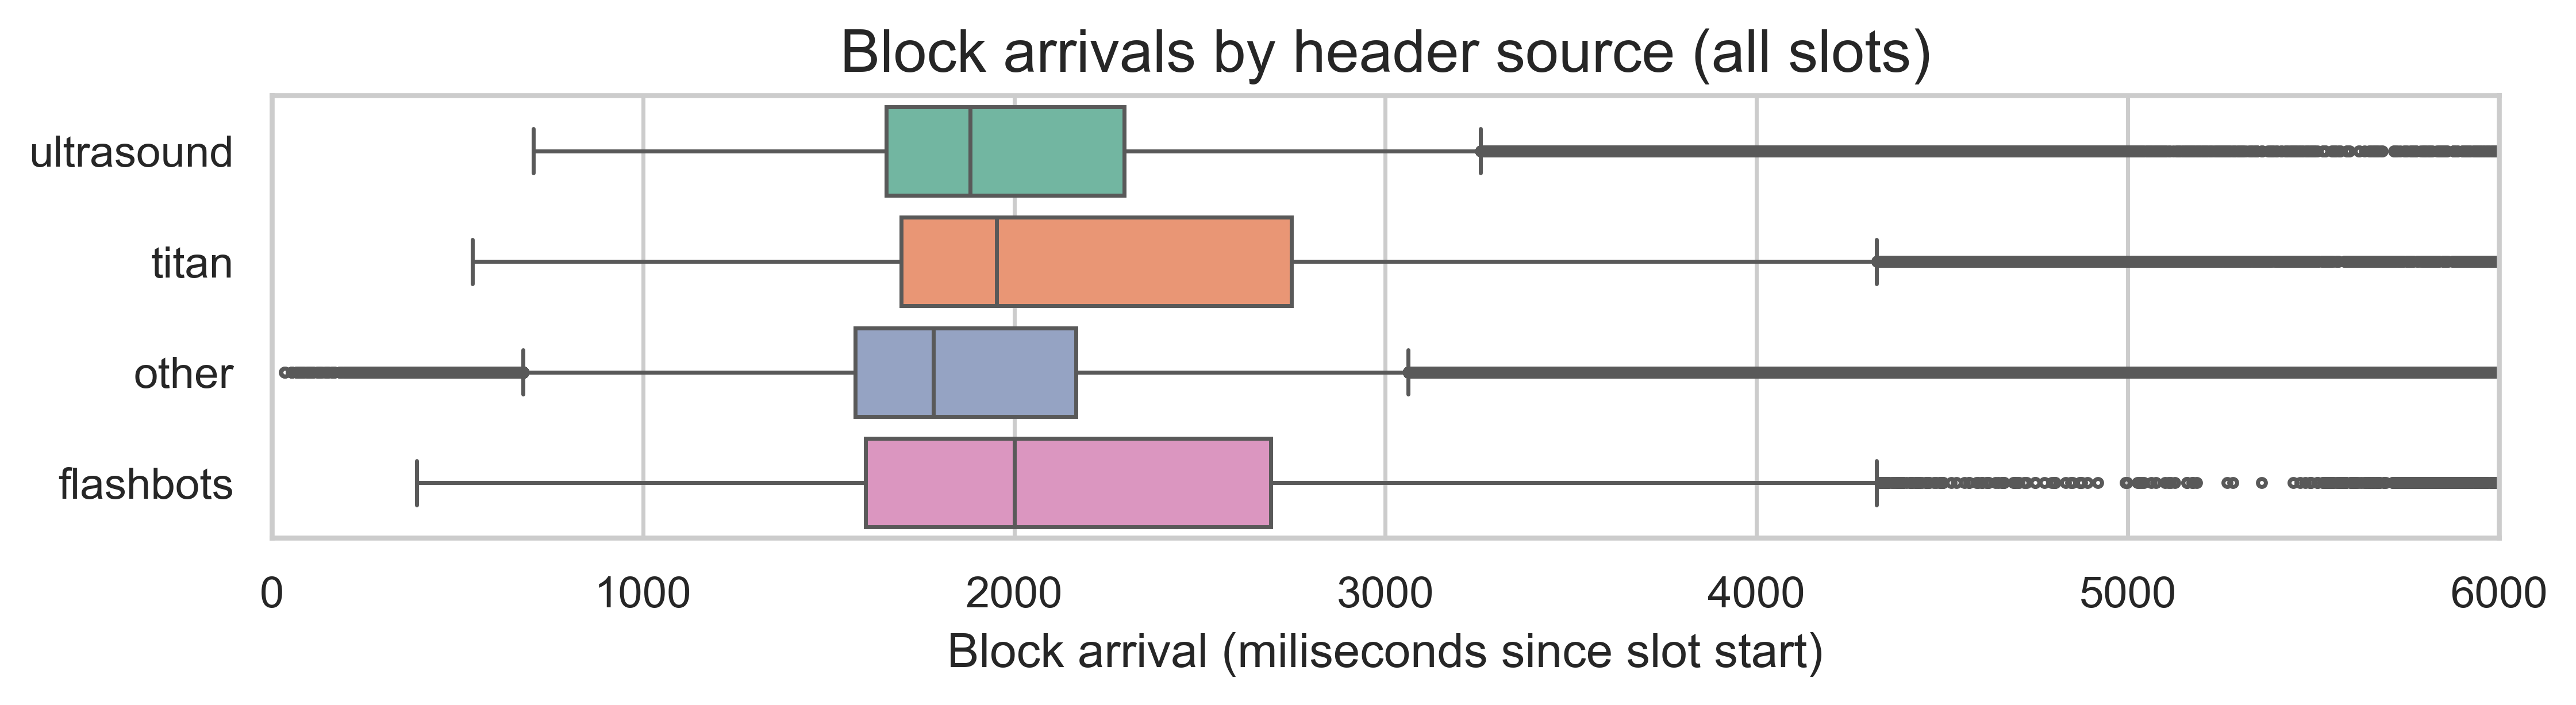
Interestingly, the slots without relay data have slightly shorter propagation times, but they show more outliers and a larger standard deviation. The 95th percentiles are comparable, with the “other” slots taking 3292ms, while the slots with relay data take 3337ms. This indicates that the observed timings with relay data are likely a reasonable estimate.
Additionally, the fact that block arrivals are so close to the attestation deadline while the actual propagation takes less than 1 second suggests that the start of the slot is not being solely used for block propagation. Thus, there is likely some slack in the attestation timings in the current slot structure.
This is further reinforced by the relationship between block propagation and the block size. One would expect these two metrics to be positively correlated. However, the metrics have a correlation of just 0.004. We can also see their non-linear relationship in the scatterplot below.
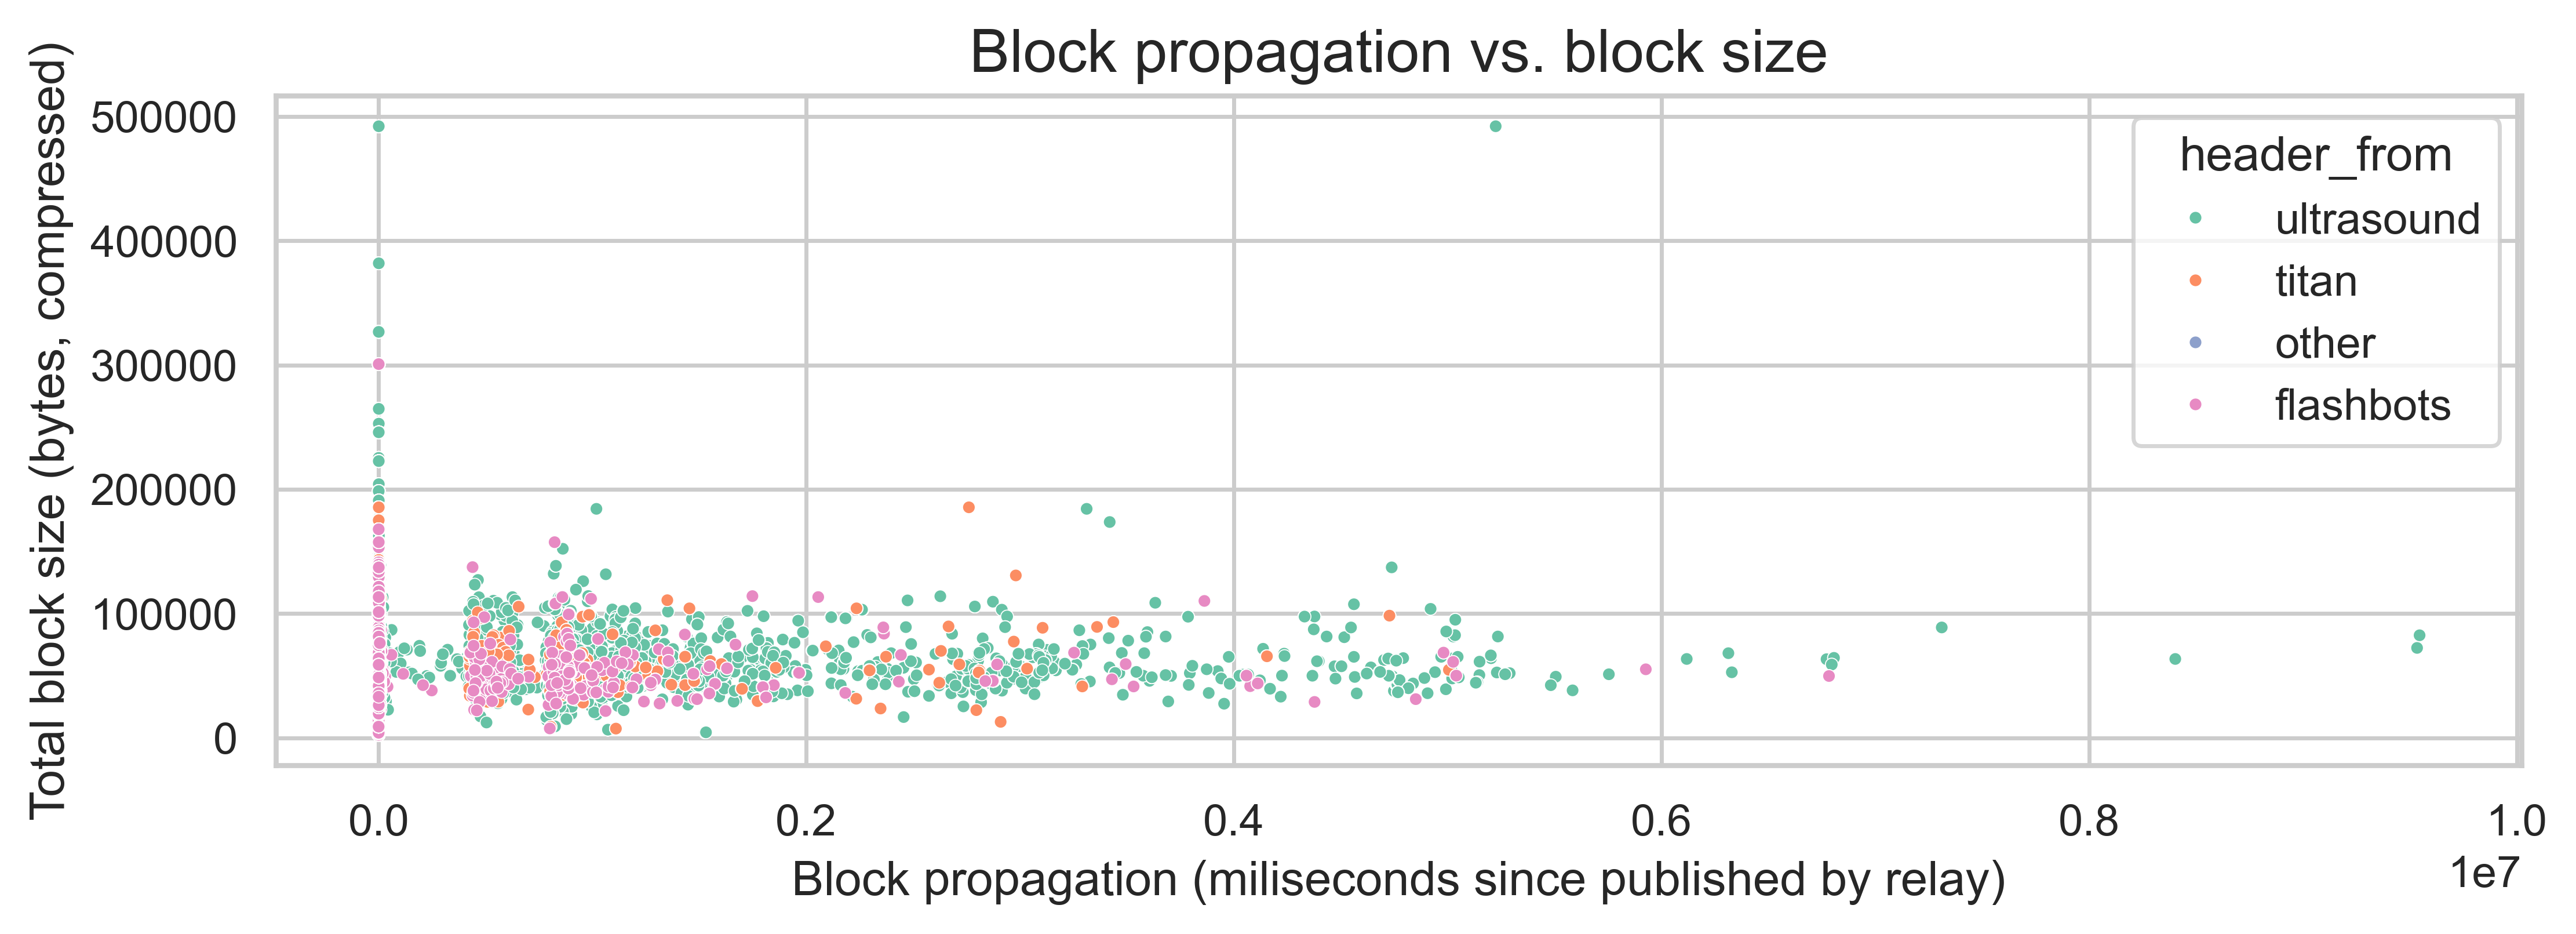
For additional plots and analysis, refer to the notebook 2.3-beacon-block-arrivals-with-relay.ipynb.
Attestation times for missed slots
There are 207 missed slots in our sample. For each, we observe the attestations from subnets 0 and 1. We have three nodes listening to the same subnets across four regions - the Netherlands, India, the US, and Australia. The following plot shows the overall distribution of all these attestation propagation times (i.e., the milliseconds of attestation arrival since the 4-second mark in the slot).
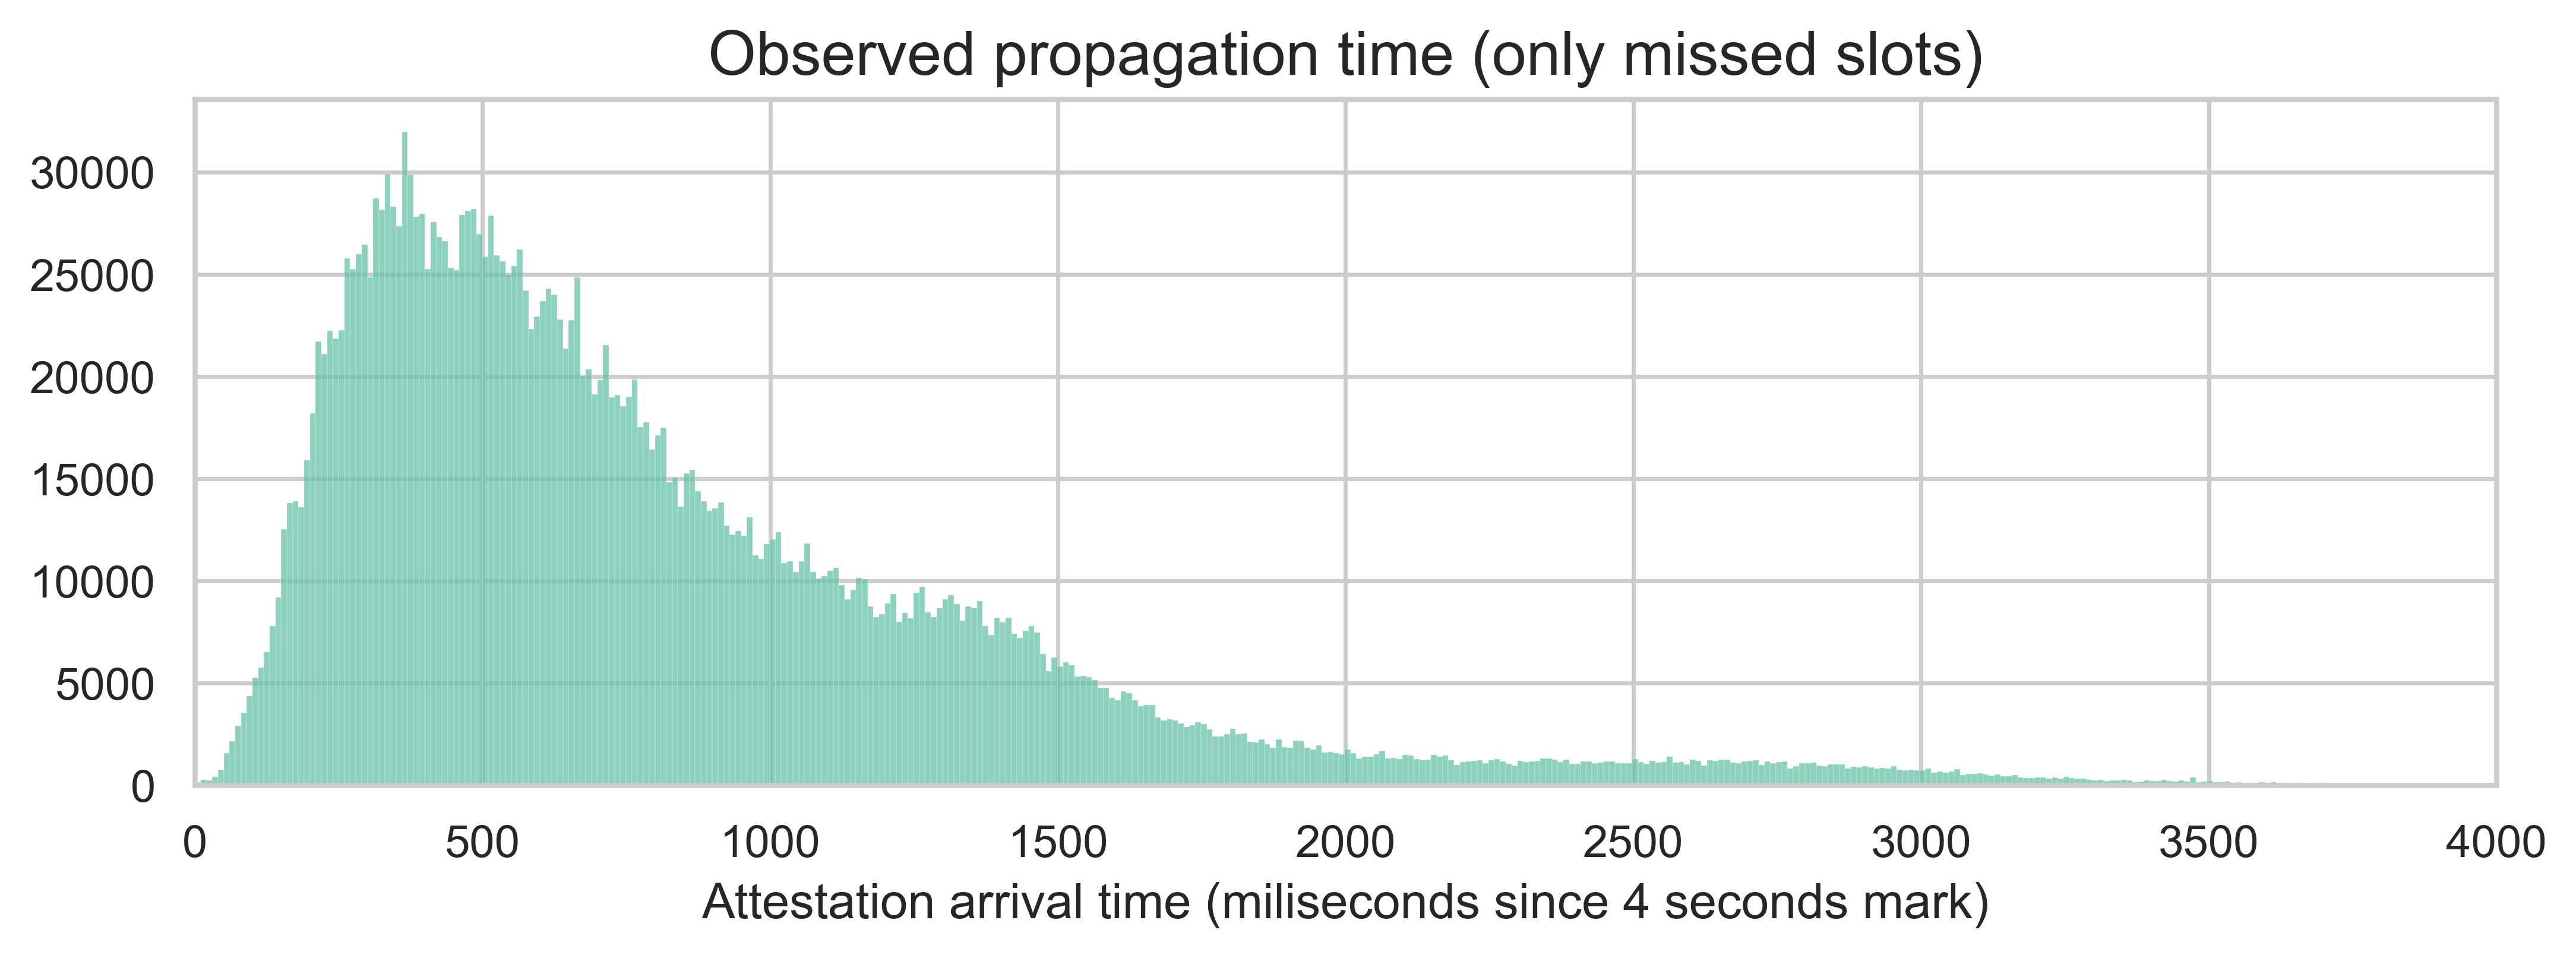
As expected, most attestations take less than 1 second to propagate, with an average of 831ms. However, we do see a large right tail in the distribution, with some attestations arriving later than 1 second. In fact, the overall 95th percentile is 2066ms.
We should note that the timings we are seeing are likely an overestimation. With missed slots, all attesters send their attestations at the same time, which creates a high burst of activity on the P2P layer. Under more normal conditions, attestations would be sent more gradually as validators take slightly different times to receive and validate the block.
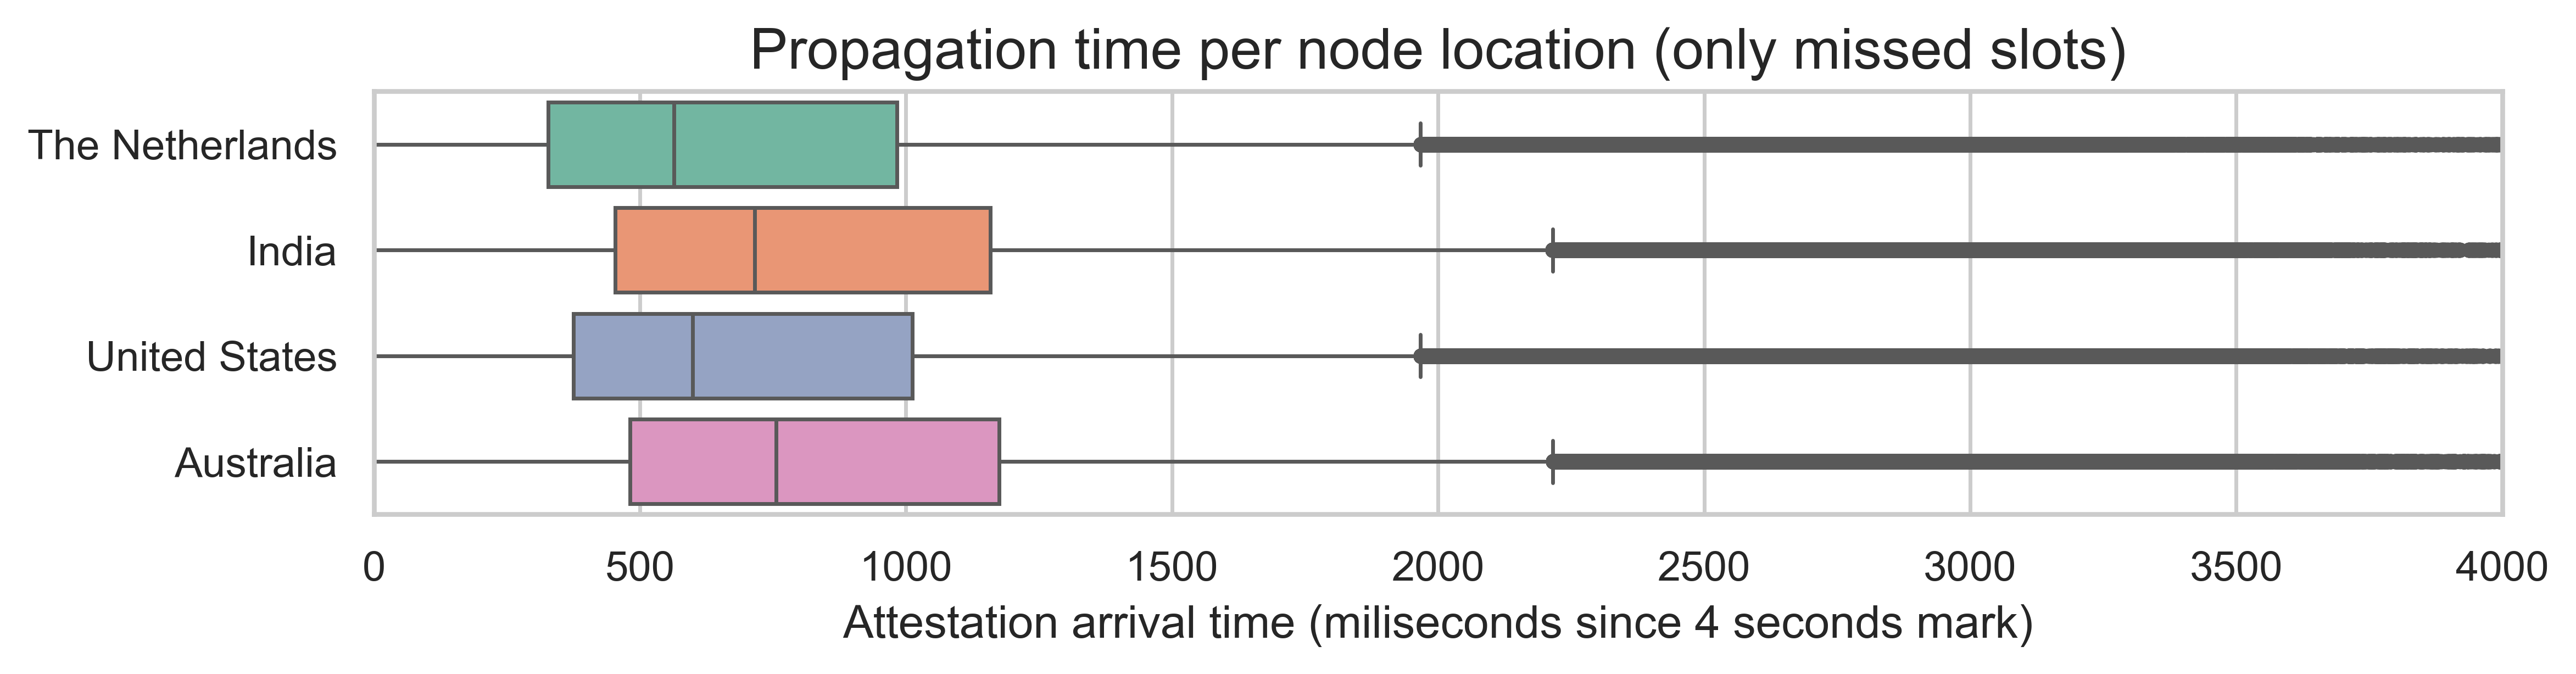
Looking at the same distribution by receiver node region (in the boxplots below), we see that even though India and Australia nodes show slightly longer times, the difference is not materially different (around 100ms).
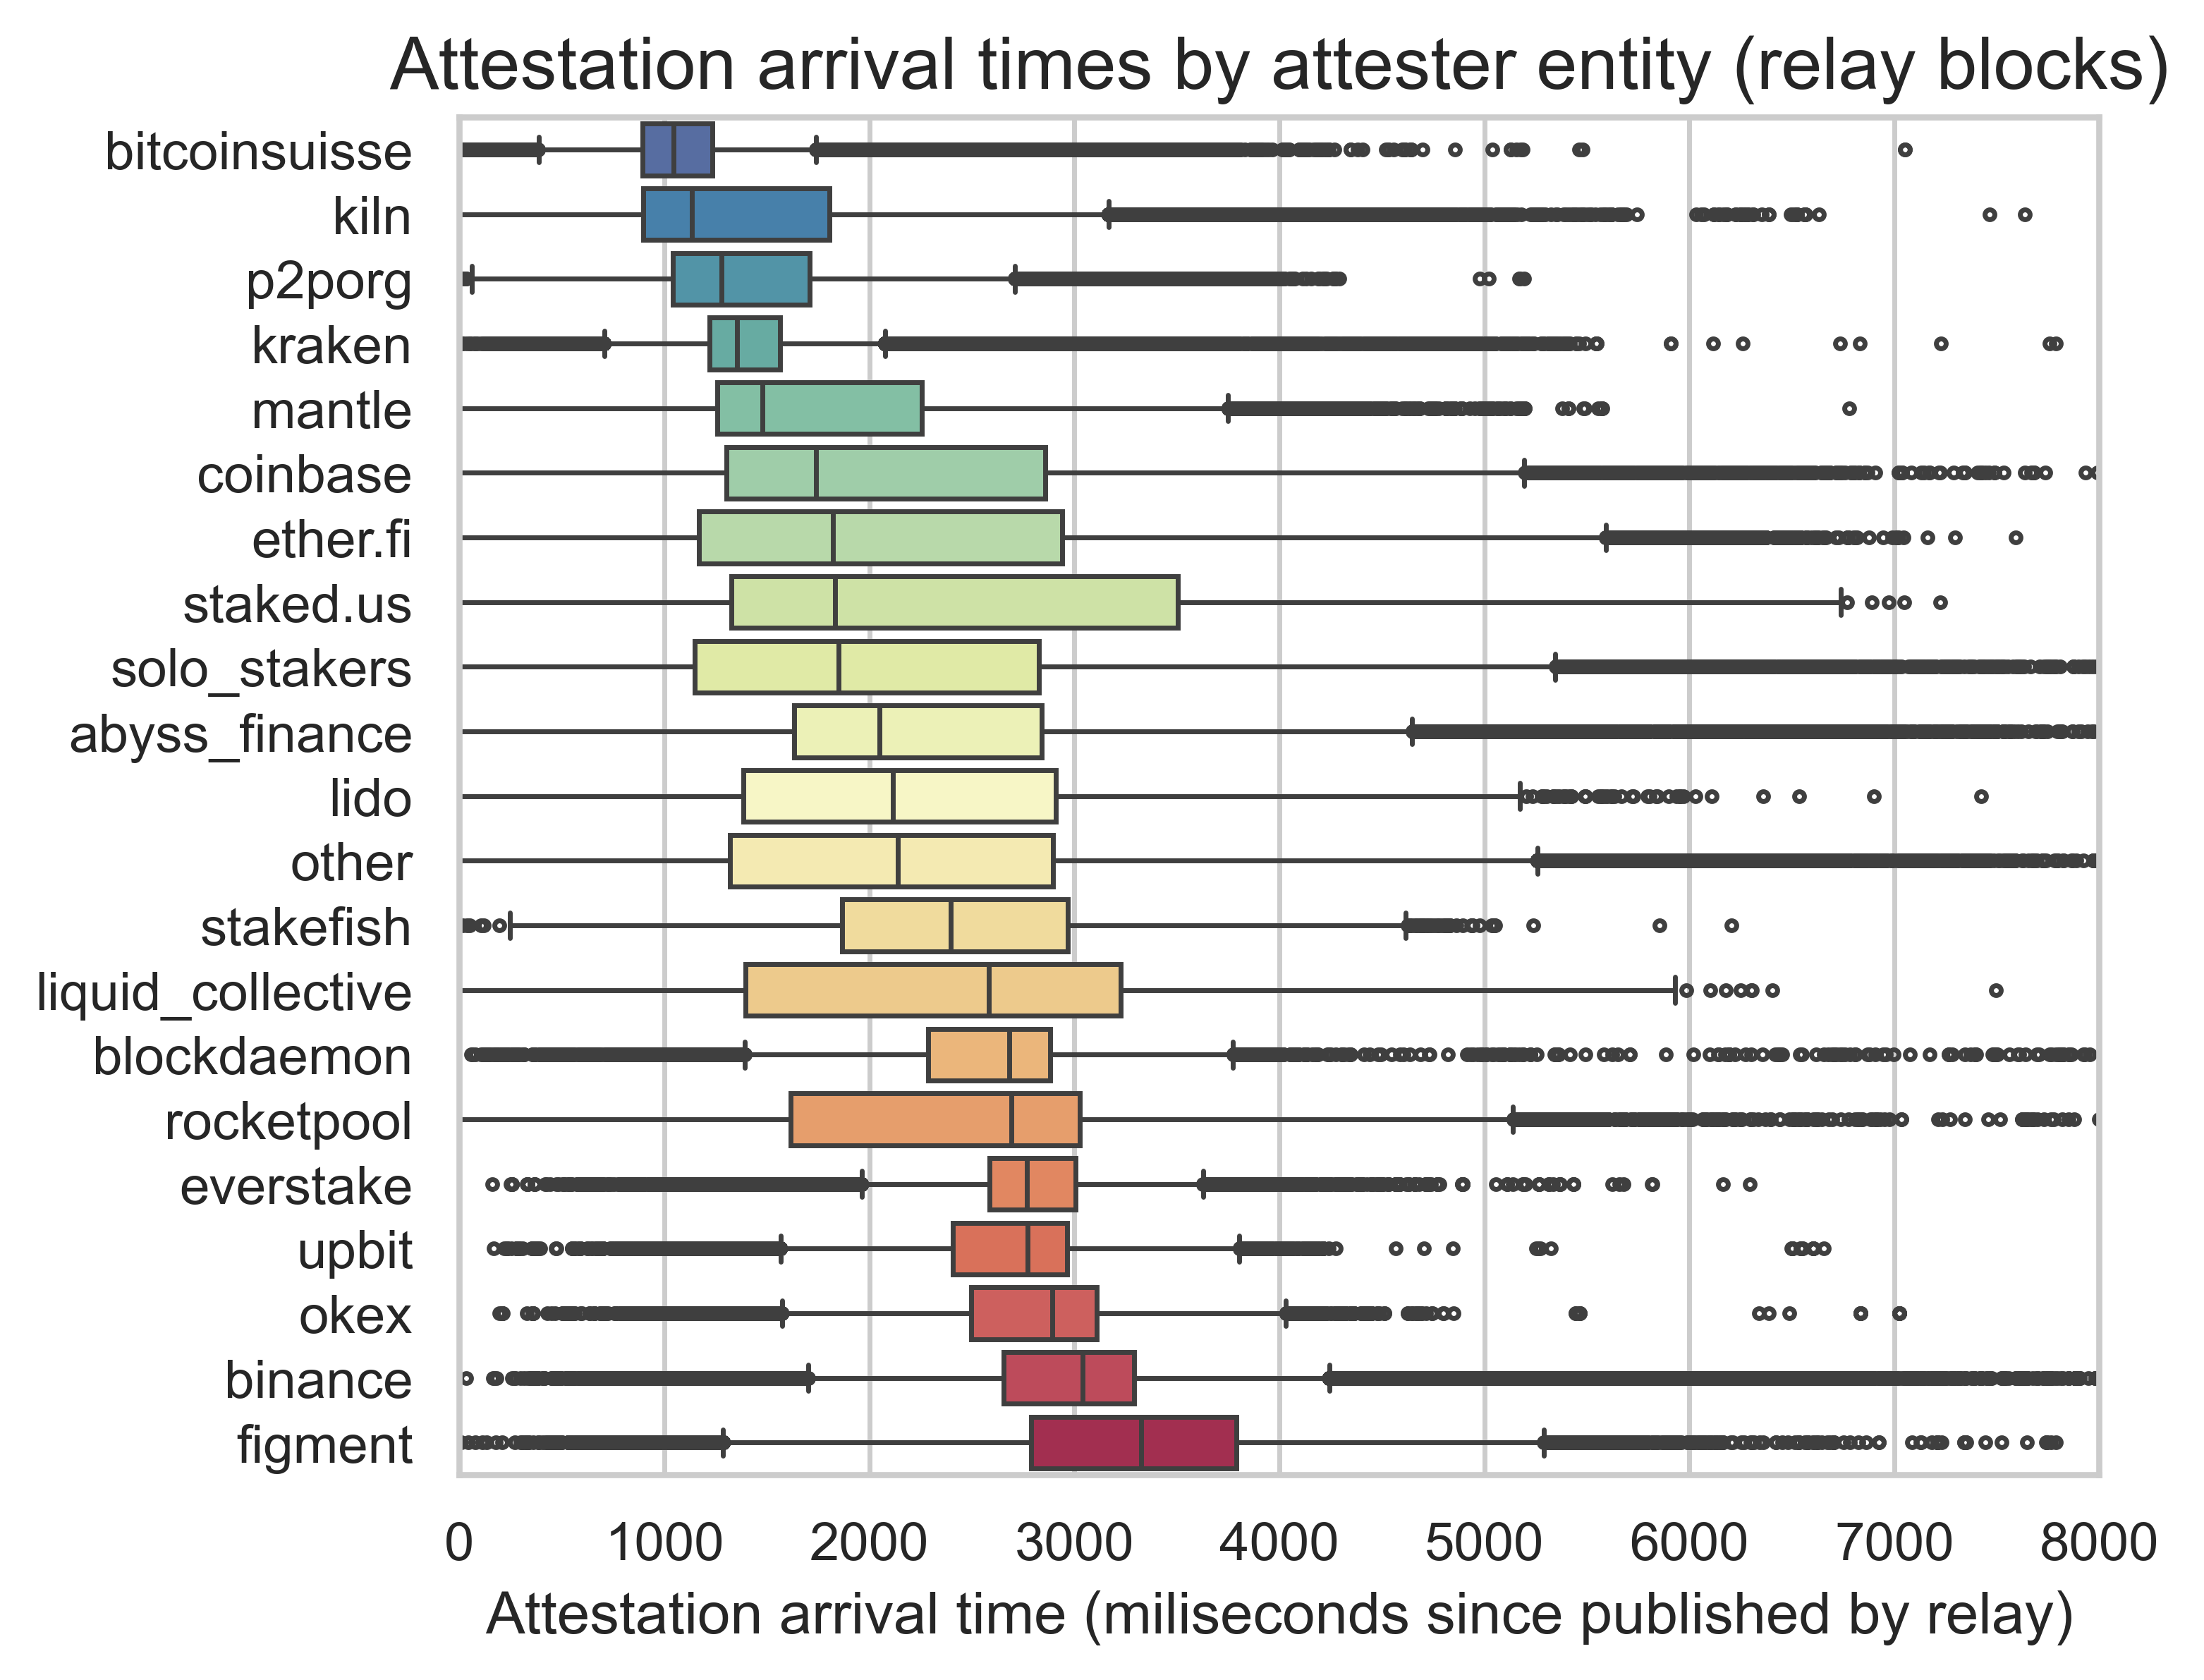
Another important consideration when analyzing attestations is the origin of the attestation, i.e., the attester. Using the mapping from ethseer.io, we extracted the validator entity of the attester. Then, we plotted the propagation time per entity (on the left) and the weight of each entity in the attestations arriving at each 50-ms bucket in the slot (on the right).
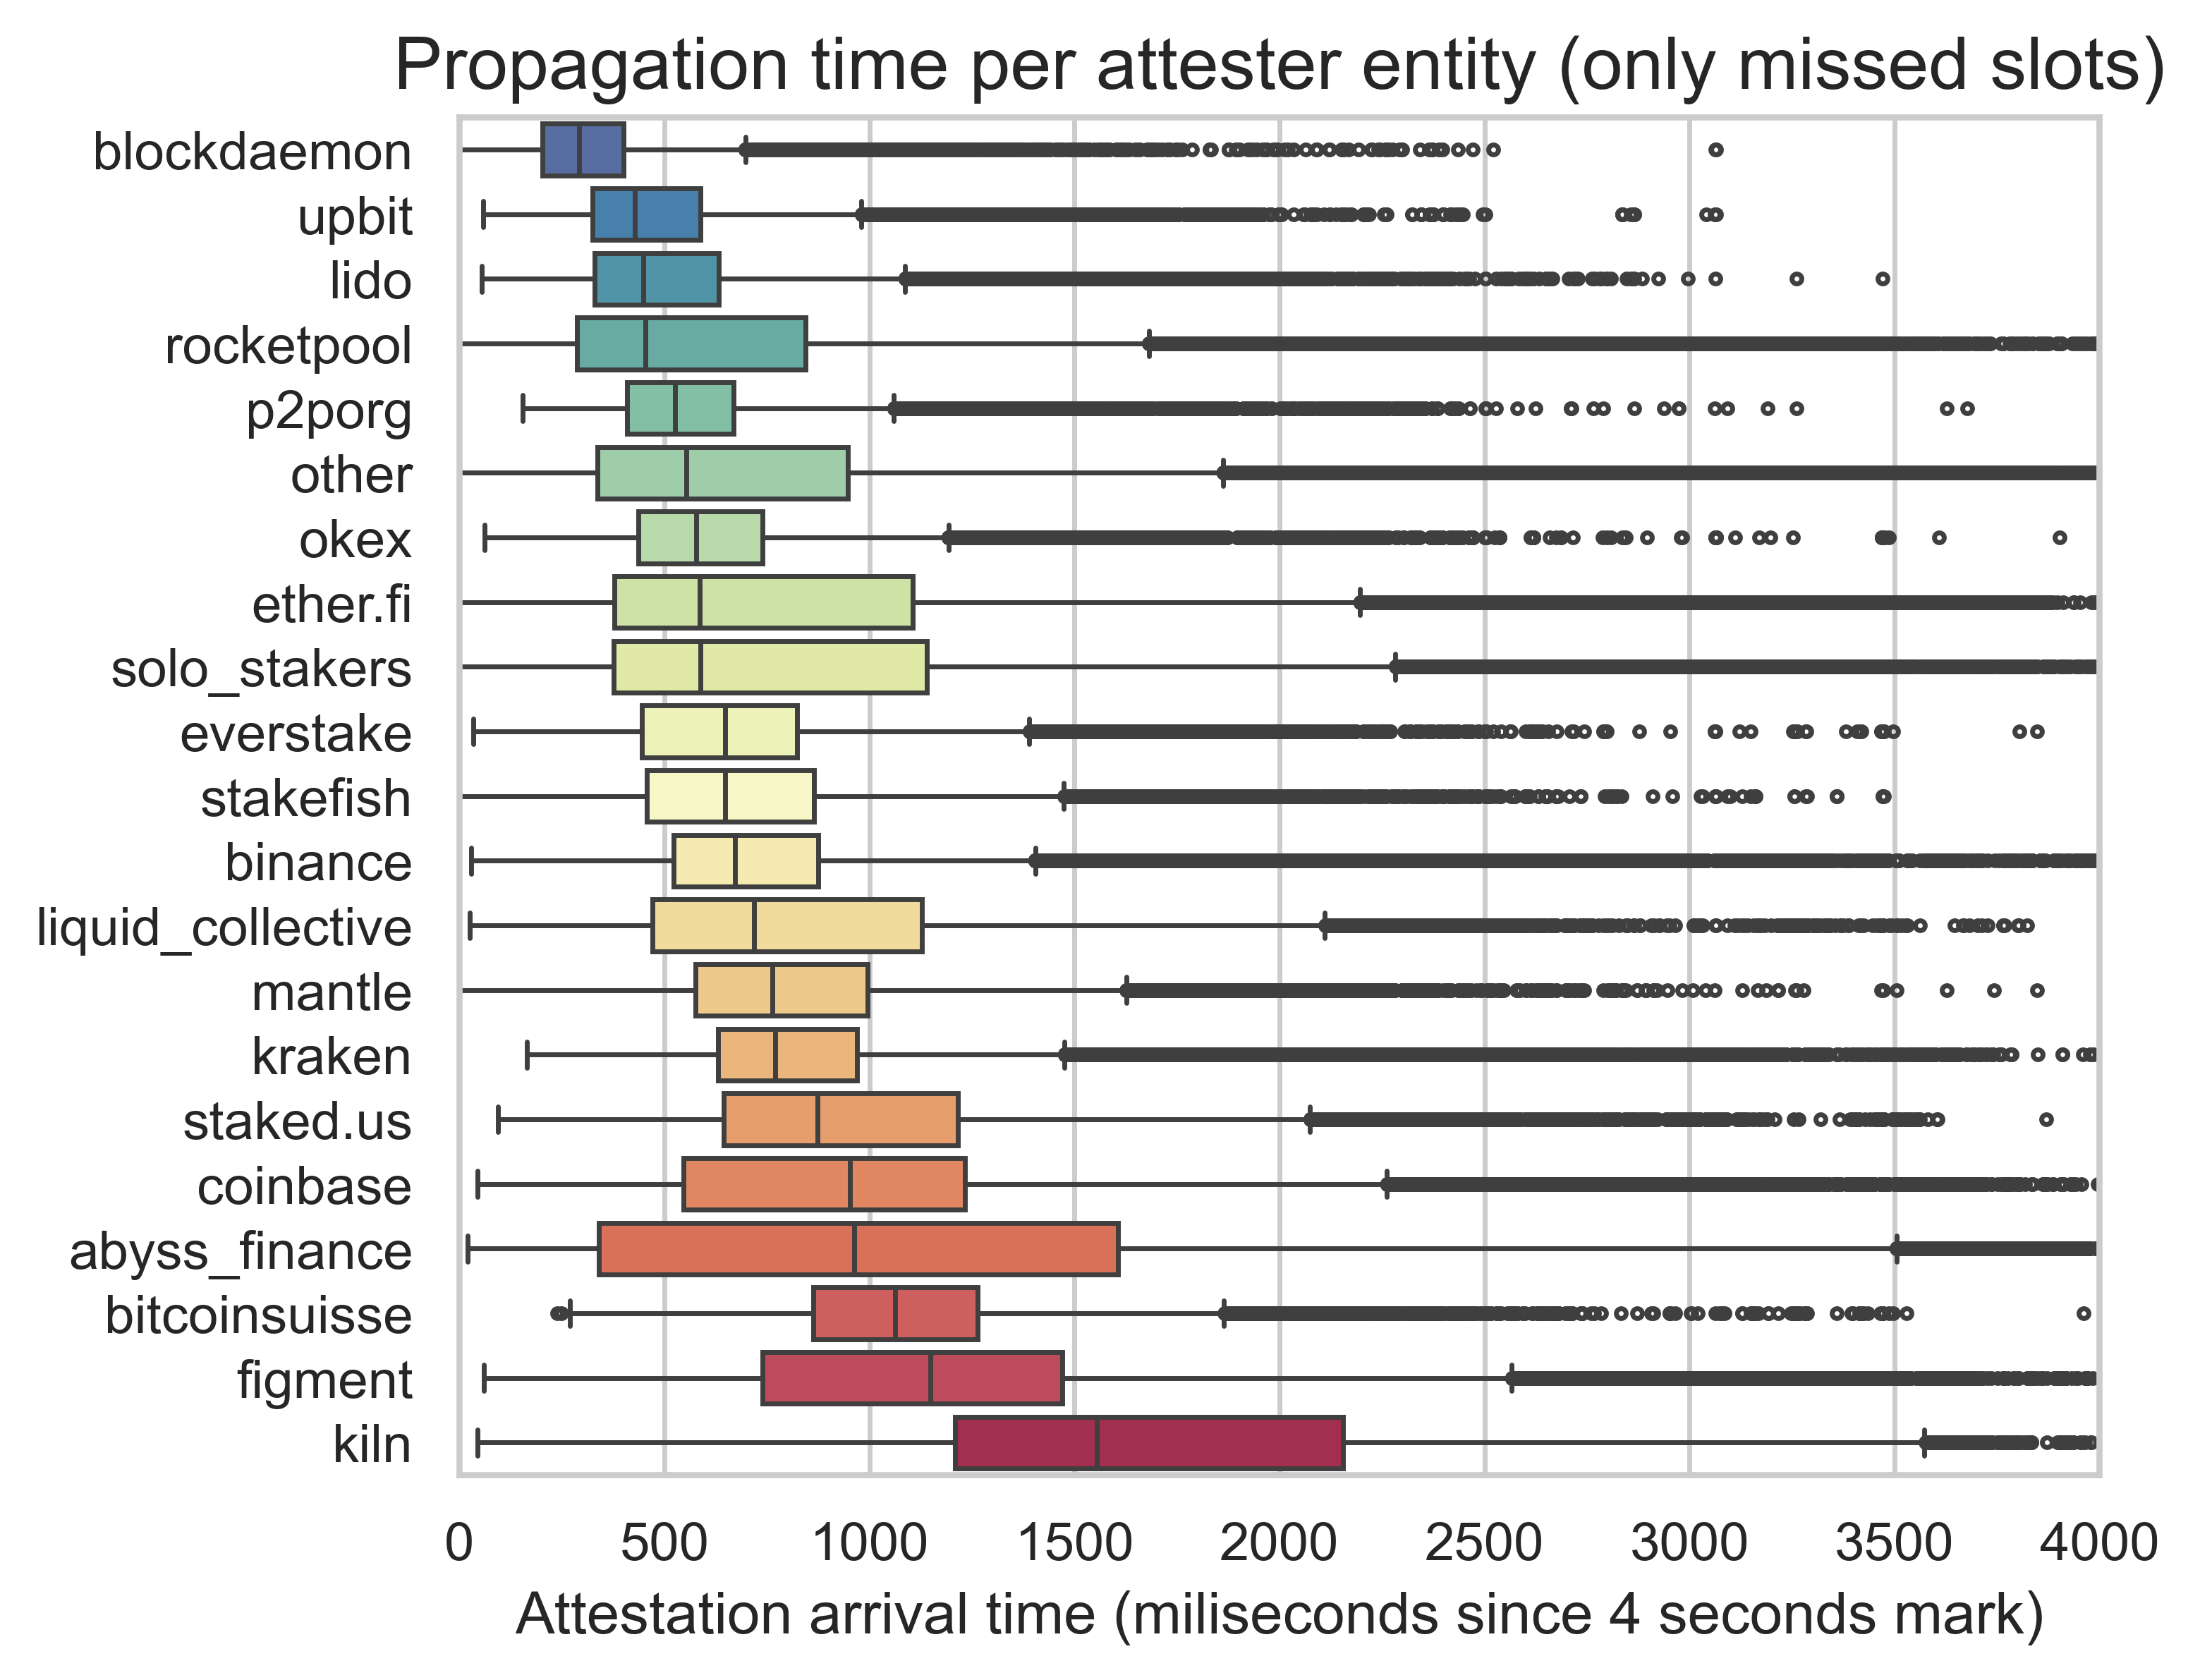
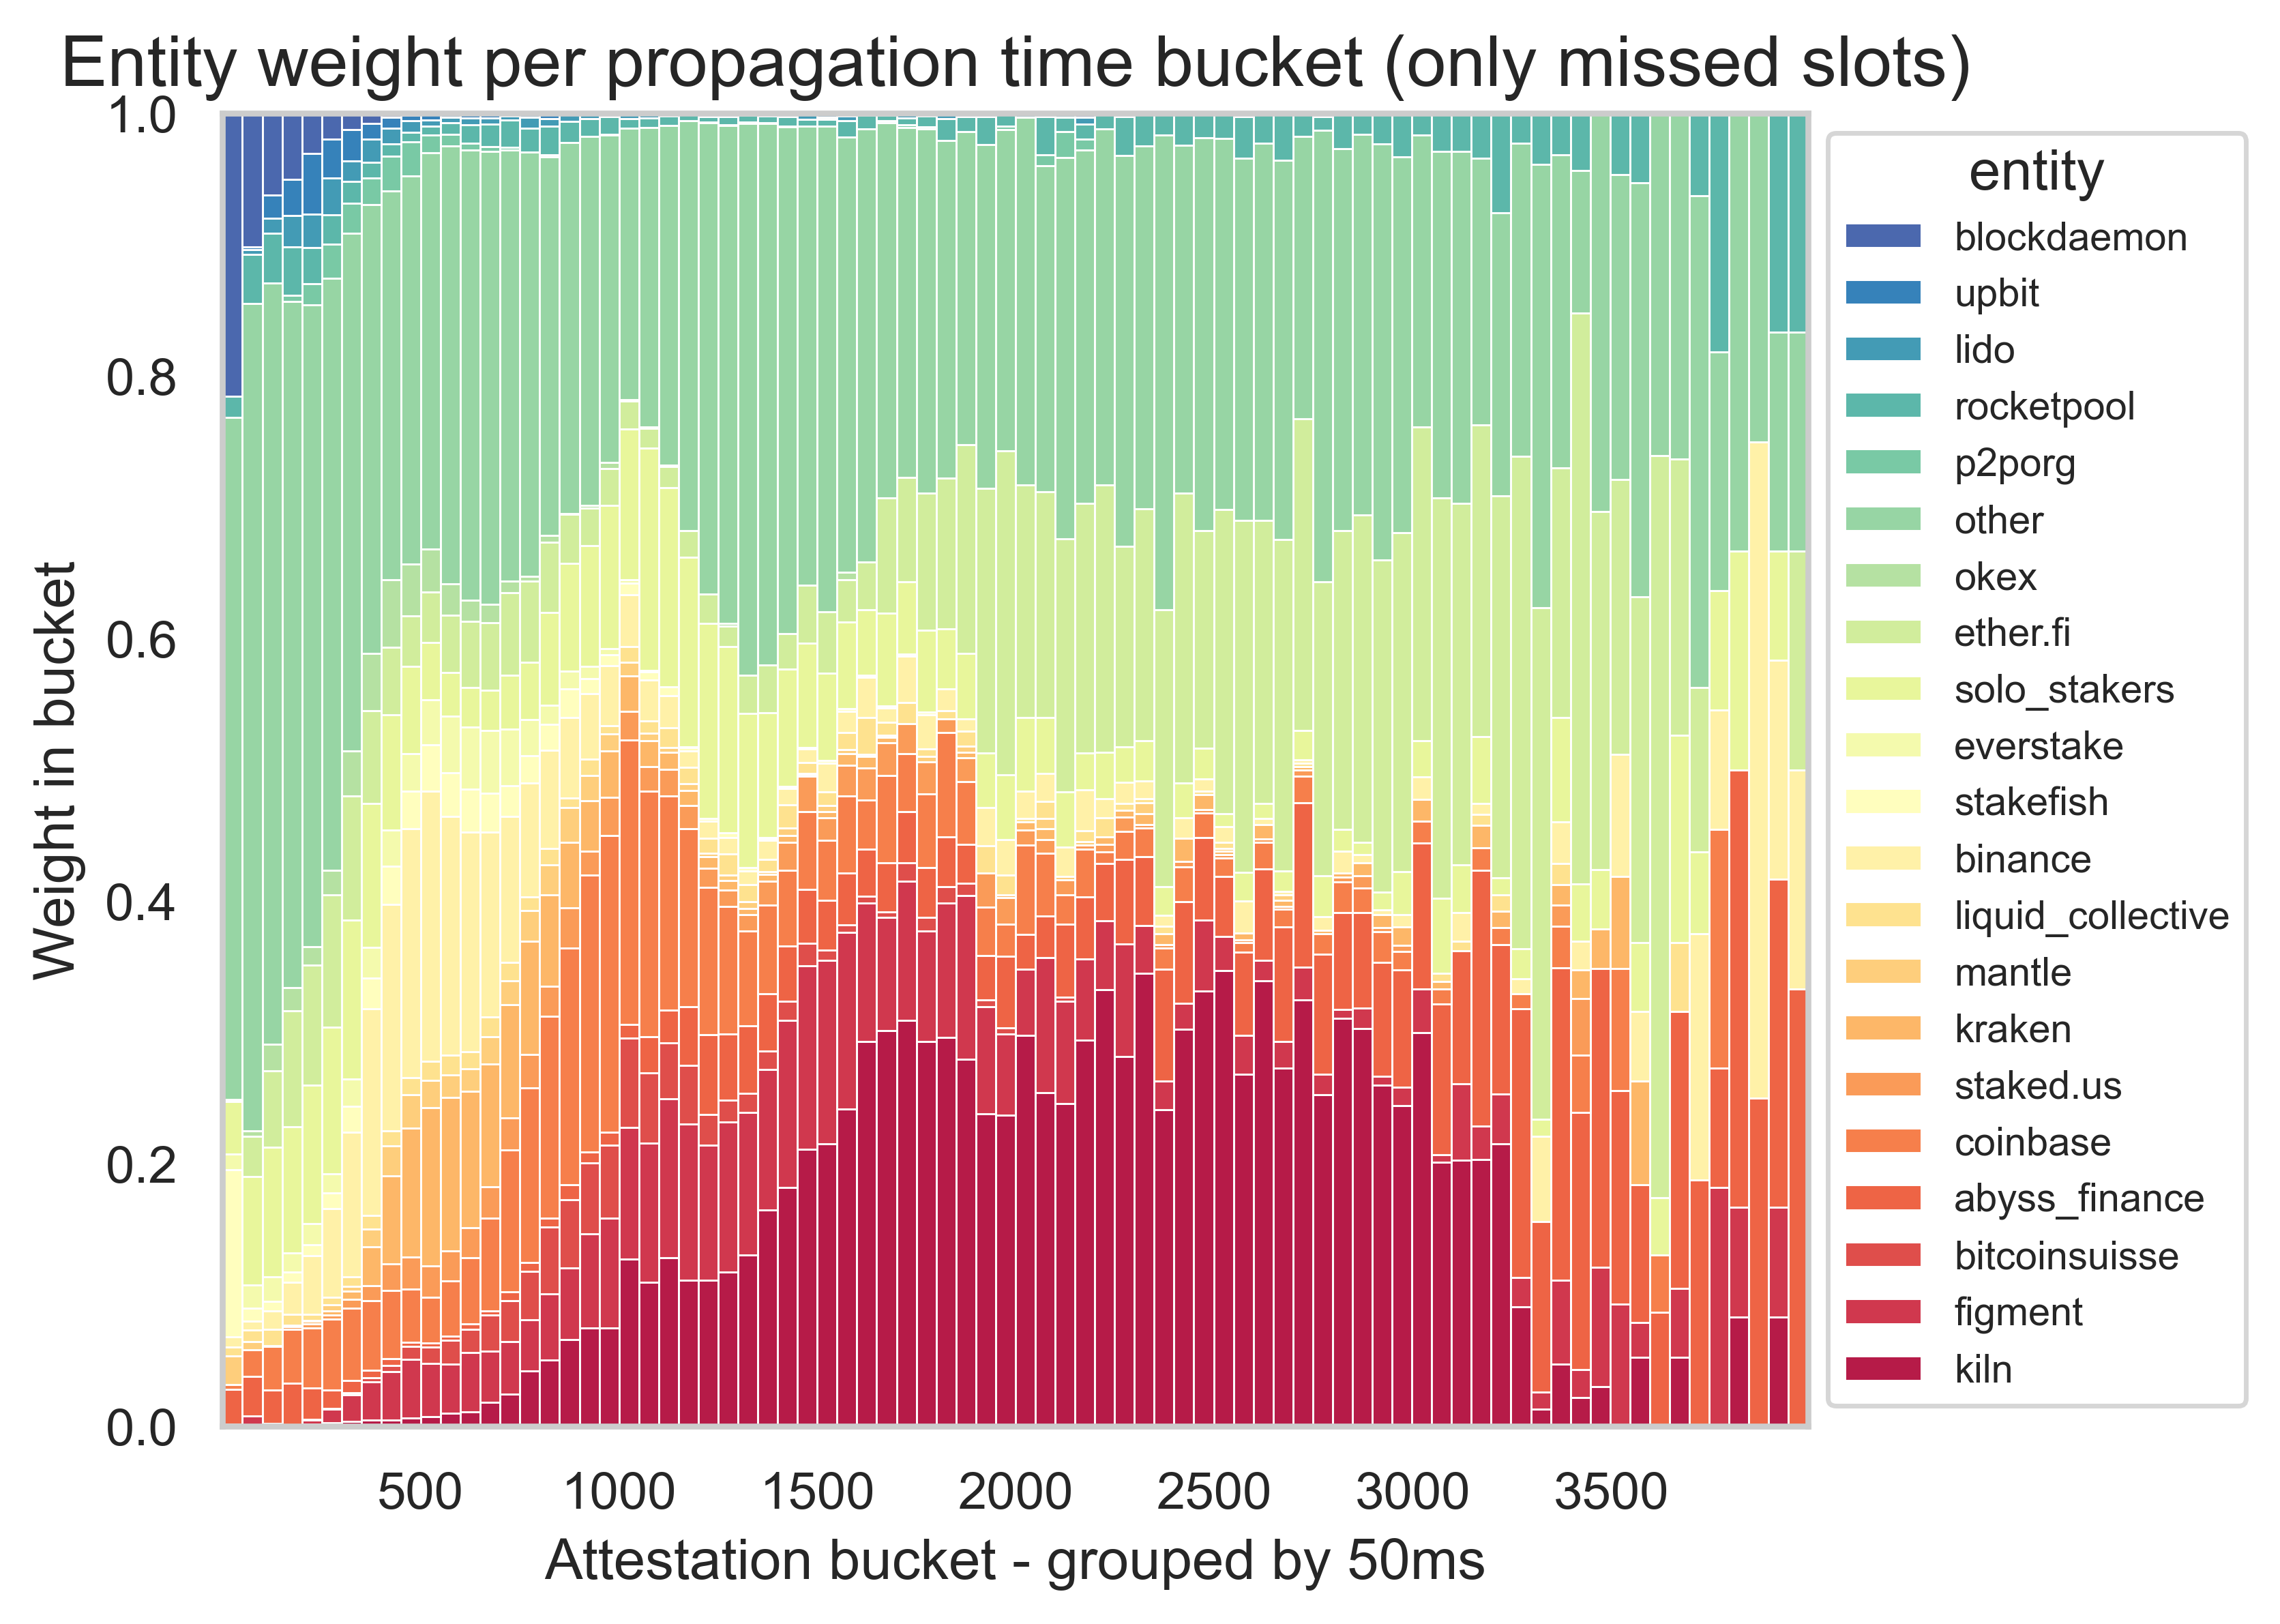
We can already see a significant variation among entities. With the information on the client configuration and the geographical locations, it is impossible to pinpoint precisely why some entities are slower attesters than others.
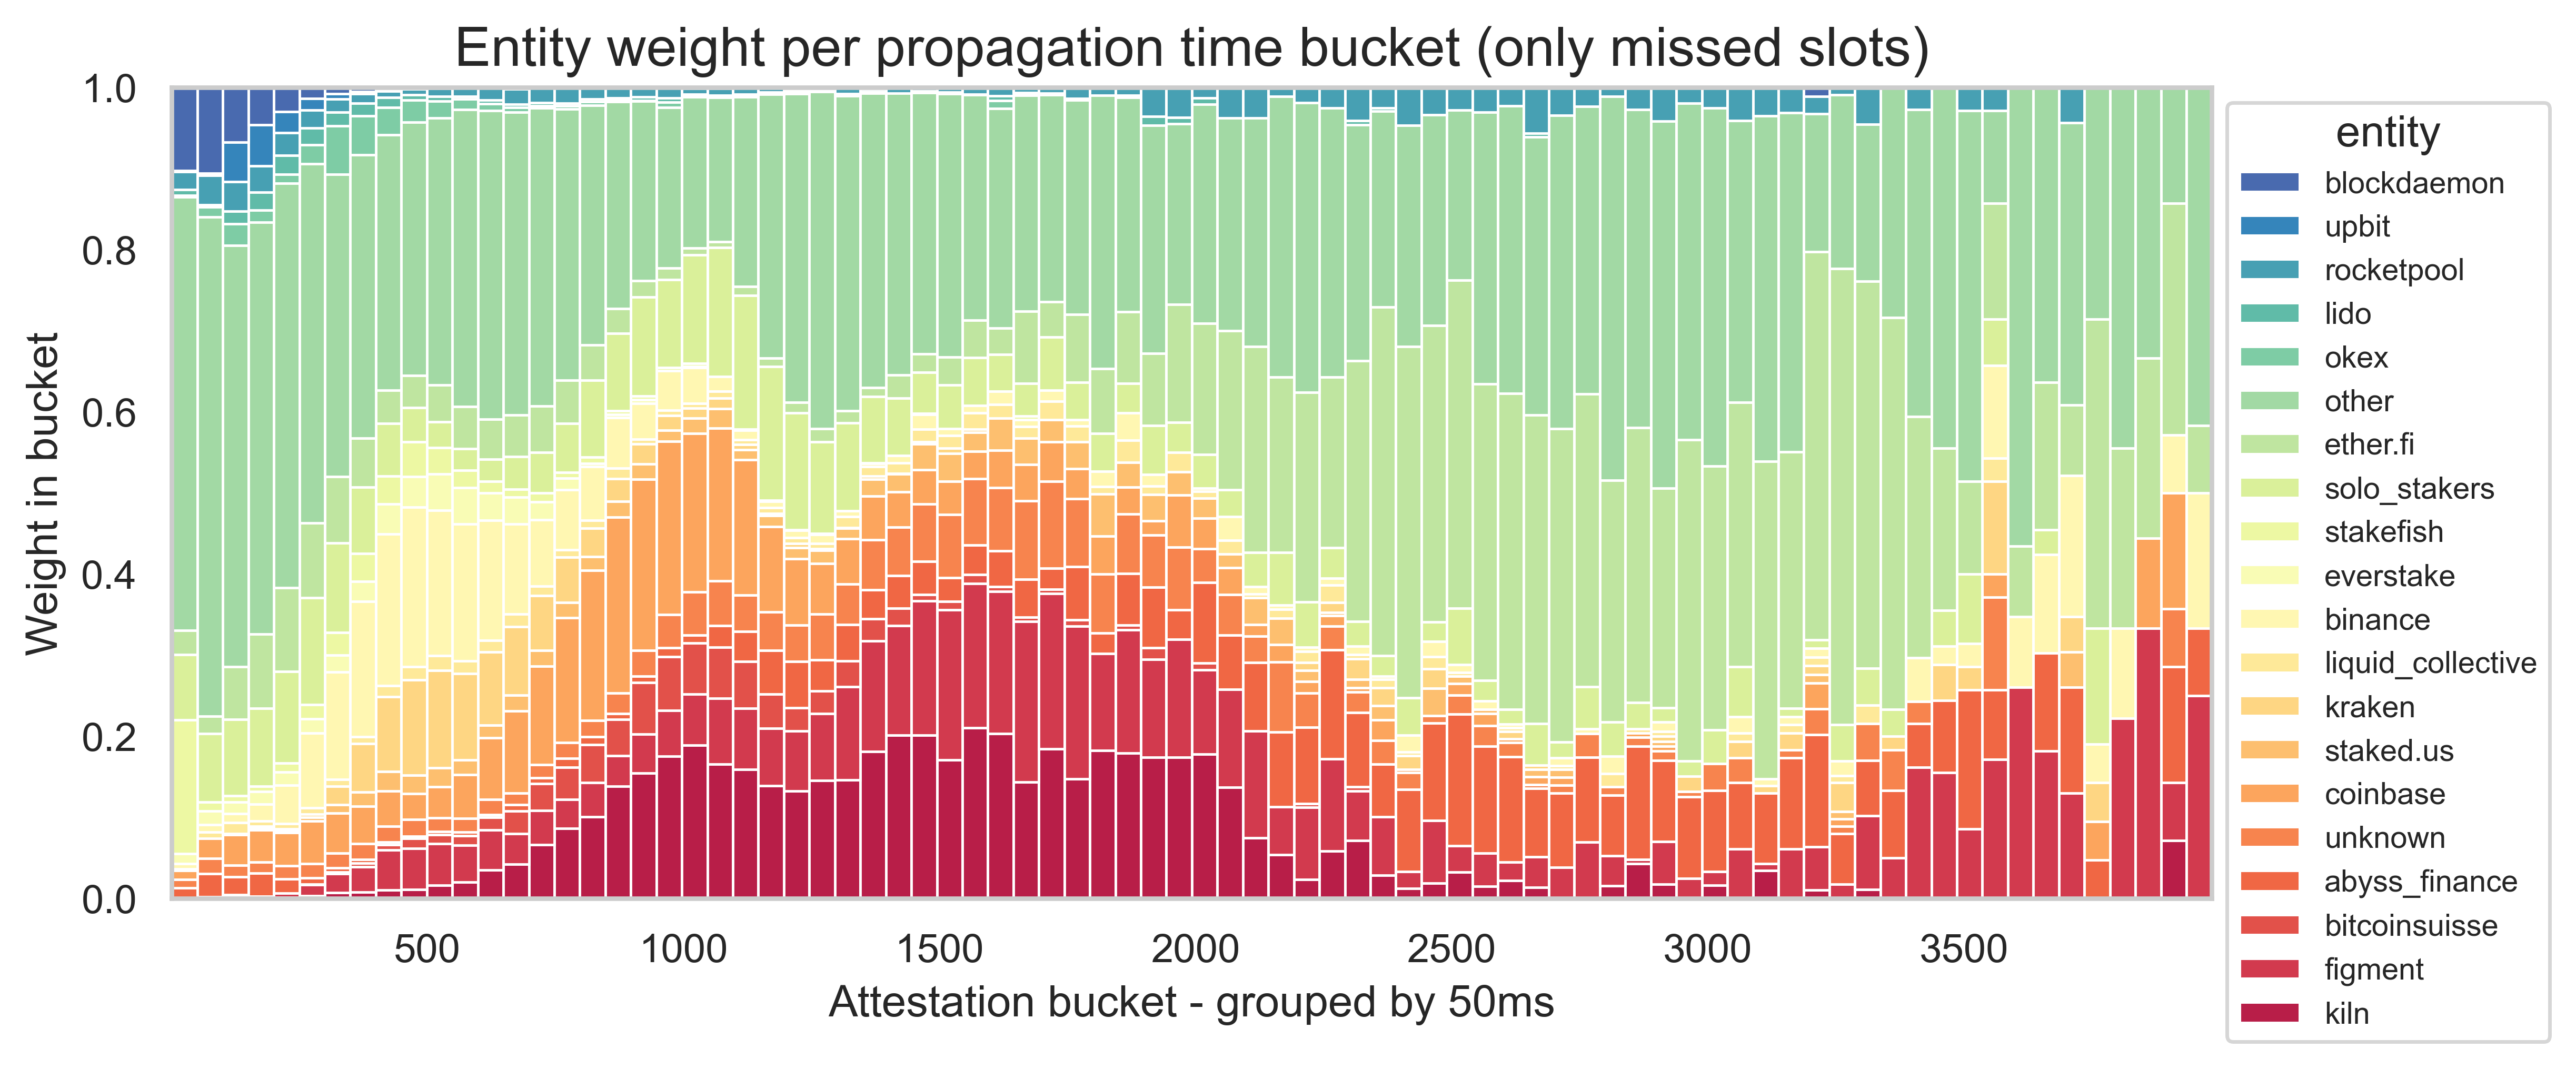
A notable example is Kiln. In our data, they were responsible for a large proportion of attestations arriving between 1500ms and 3250ms, and they had the largest median propagation time. After seeing these results, we contacted them directly, and they uncovered a misconfiguration in their client that significantly improved their times. Looking at a sample of 183 missed slots two weeks after our main sample (i.e., between slots 12344420 and 12394820), we observe a decrease in the overall 95th percentile from 2066ms to 1782ms. In addition, we can see in the plot below that the weight of Kiln in the later attestations changed significantly. This points to the importance of investigating more carefully the entities with late attestations to try and solve the root cause of the delays.
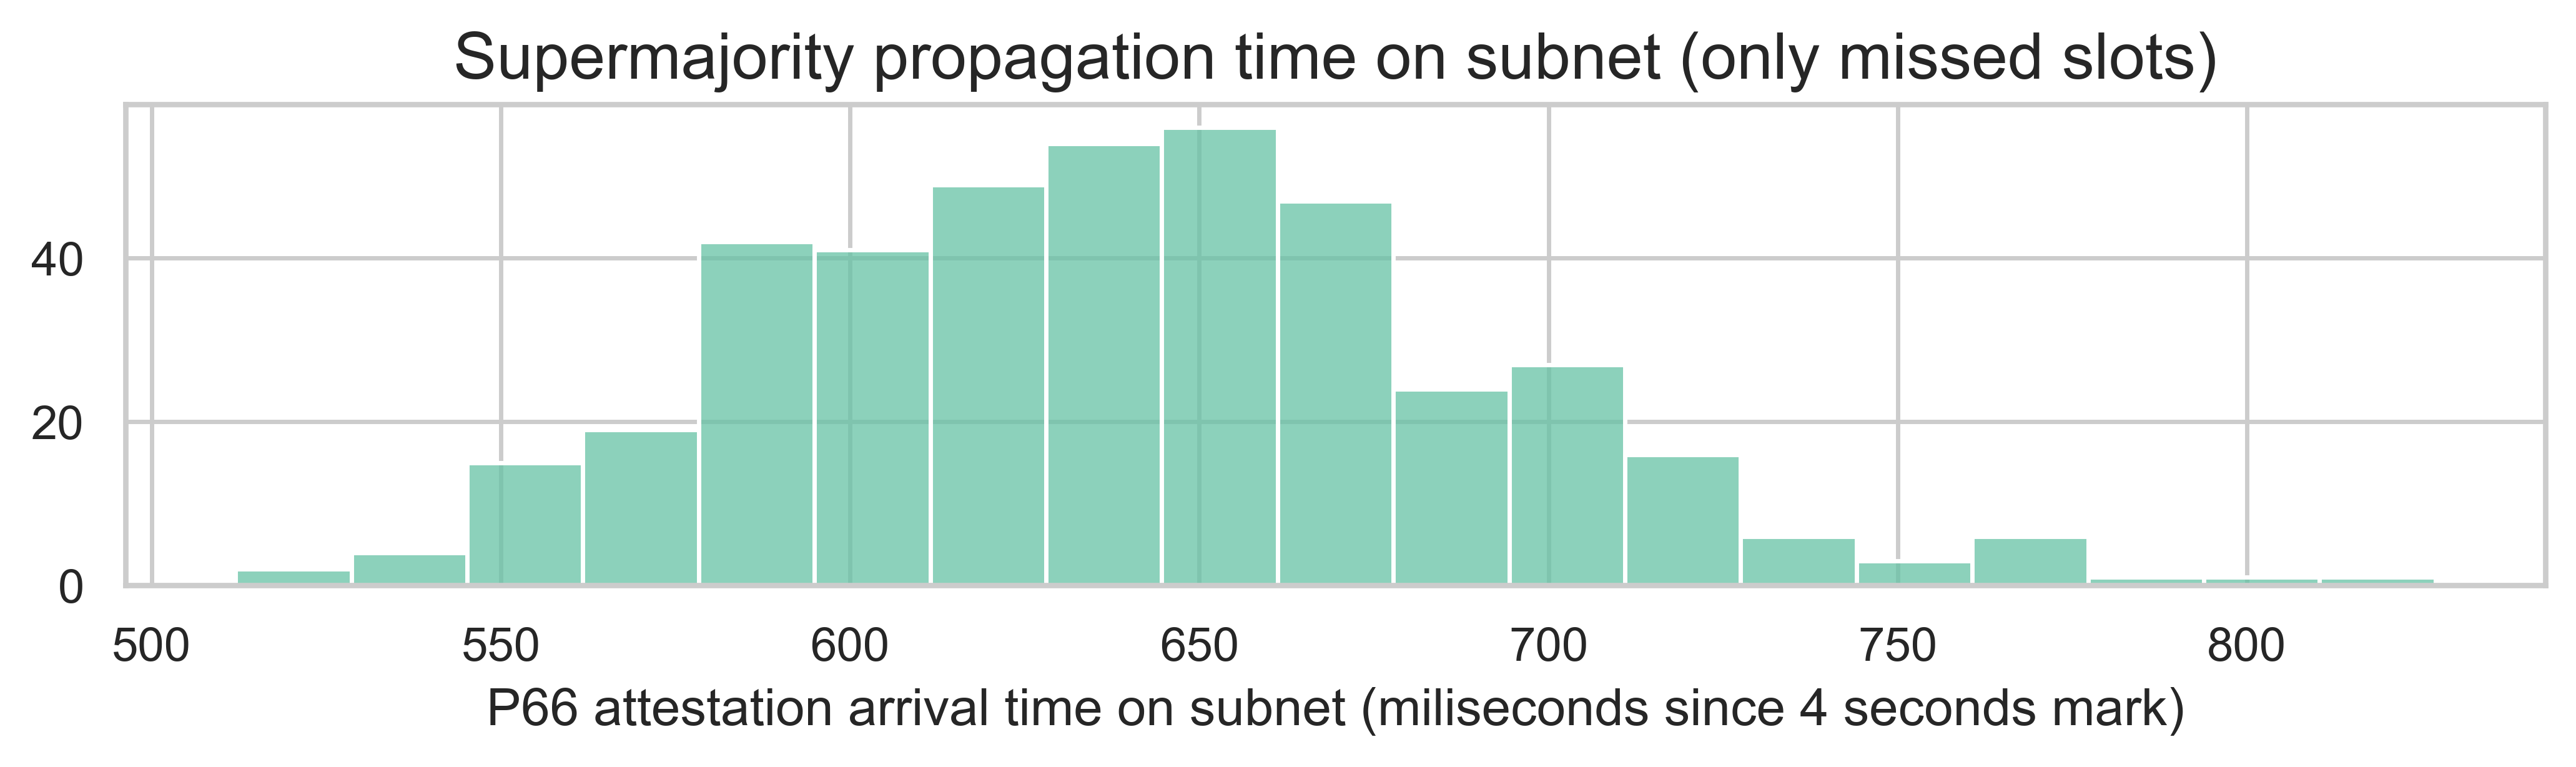
Until now, we were looking at the distribution of the data across all slots and subnets in our sample. However, another relevant metric is the 66th percentile over the subnet. In other words, given a slot and a subnet, when does the subnet observe a supermajority of attestations? The distribution below illustrates this metric over the various slots and subnets in our data. Note that here we are taking the first attestation observed for each attester (i.e. we are using the fastest node). Interestingly, all subnets in all missed slots take less than 830ms to reach supermajority. The mean is 640ms.
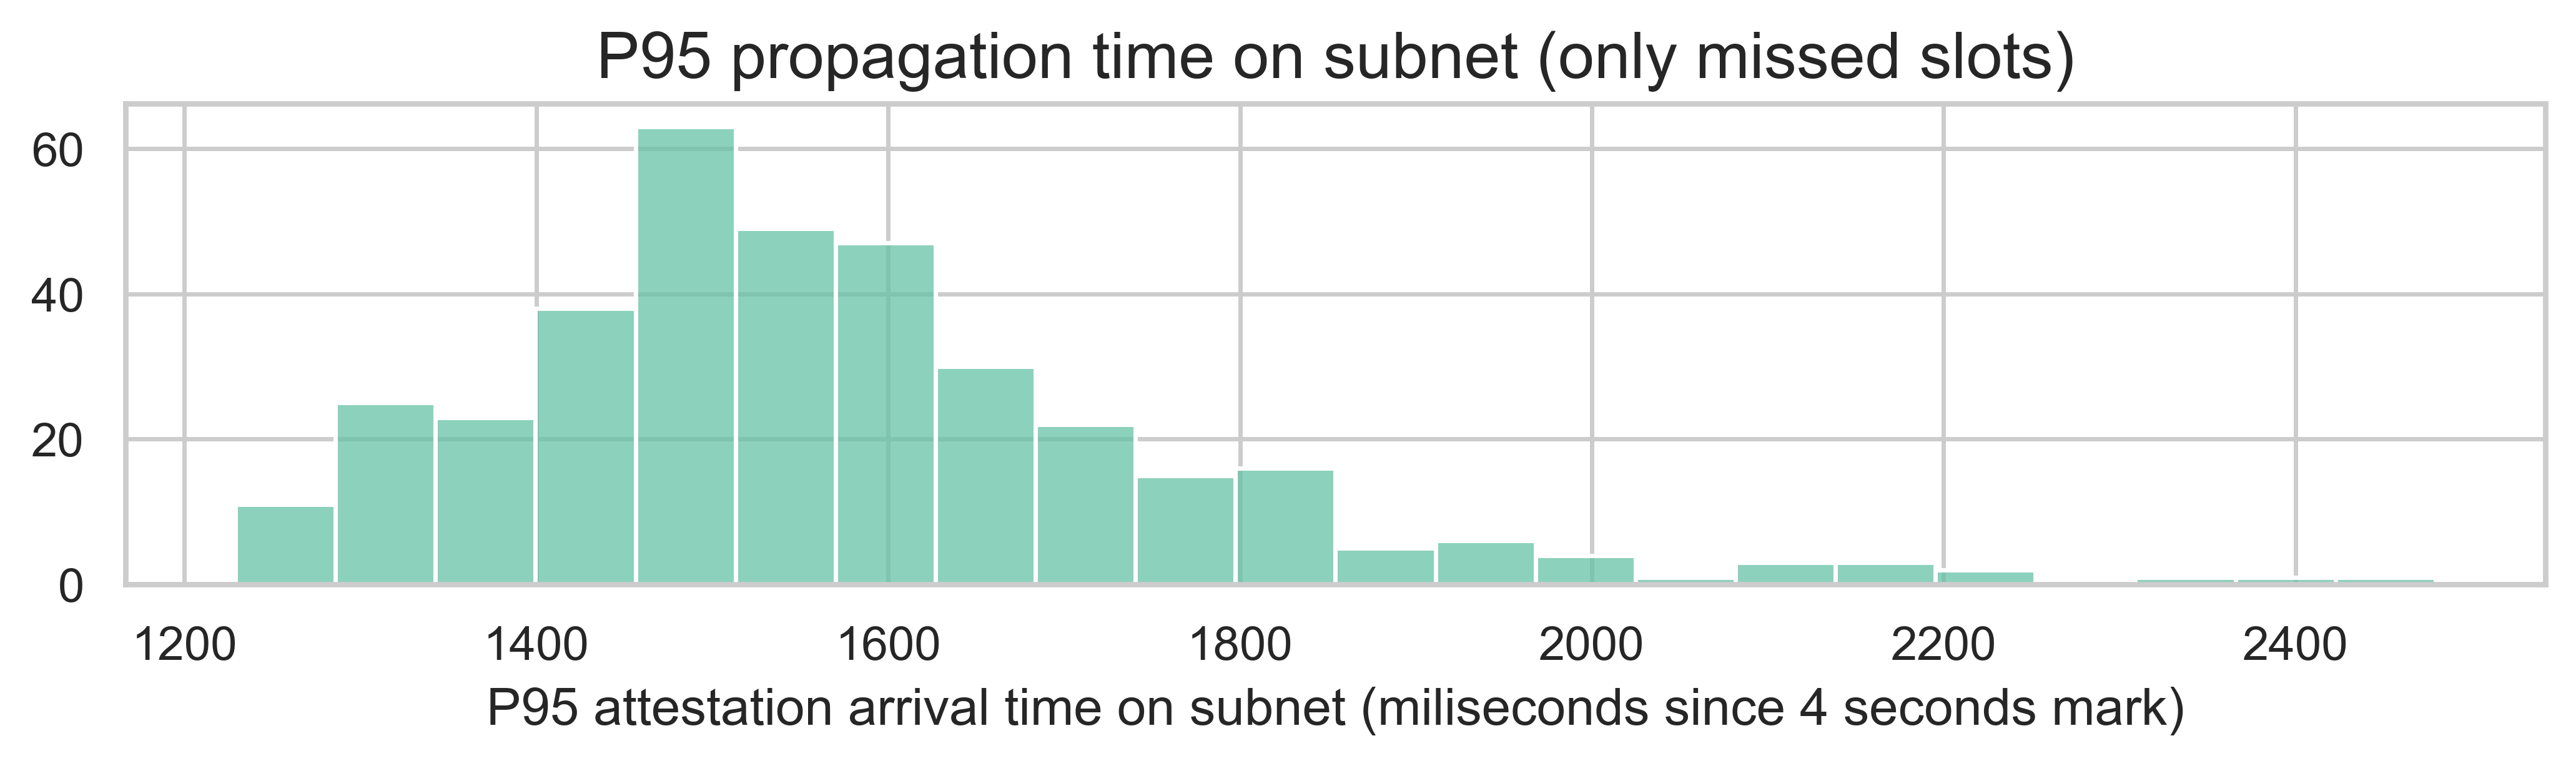
The same analysis can be done for the 95th percentile. The distribution is shown below. The mean now is 1572ms, while the 95th percentile is 1962ms.
For additional plots and analysis, refer to the notebook 2.4-committee-attestations-missed-slots.ipyn. The notebook 2.5-committee-attestations-missed-slots-v2.ipynb contains the same analysis, but using a sample of missed slots 2 weeks after.
Attestation arrivals
For this part of the analysis, we took a random sample of 4963 slots from the same slots with relay data used in the block propagation section. From this sample, 80.4% have a header from Ultrasound, 10.9% from Flashbots, and 8.7% from Titan. The next plot shows the distribution of the attestation arrivals (computed as milliseconds since the block was published by the relay) for all slots and all subnets.
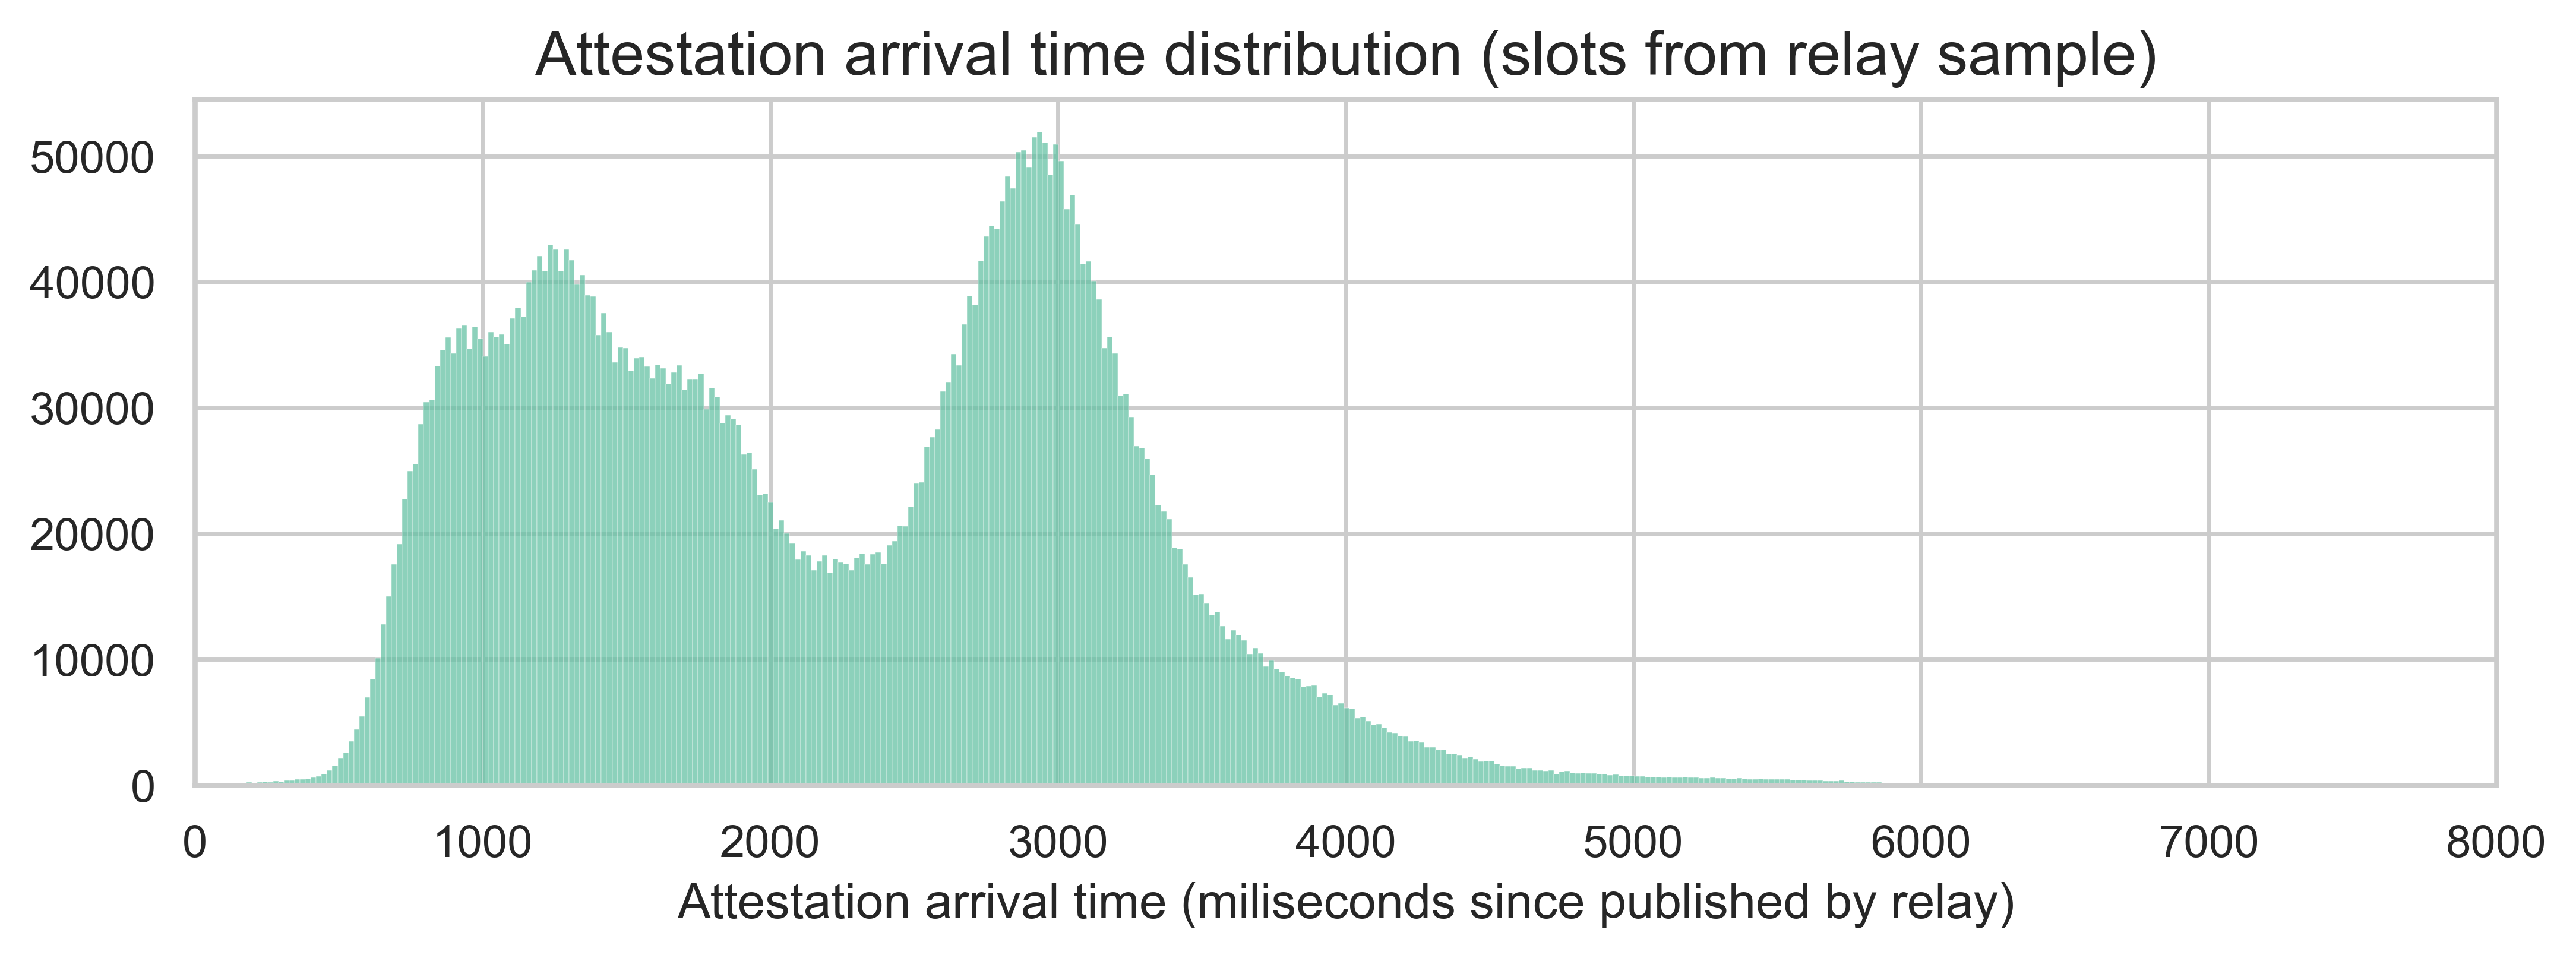
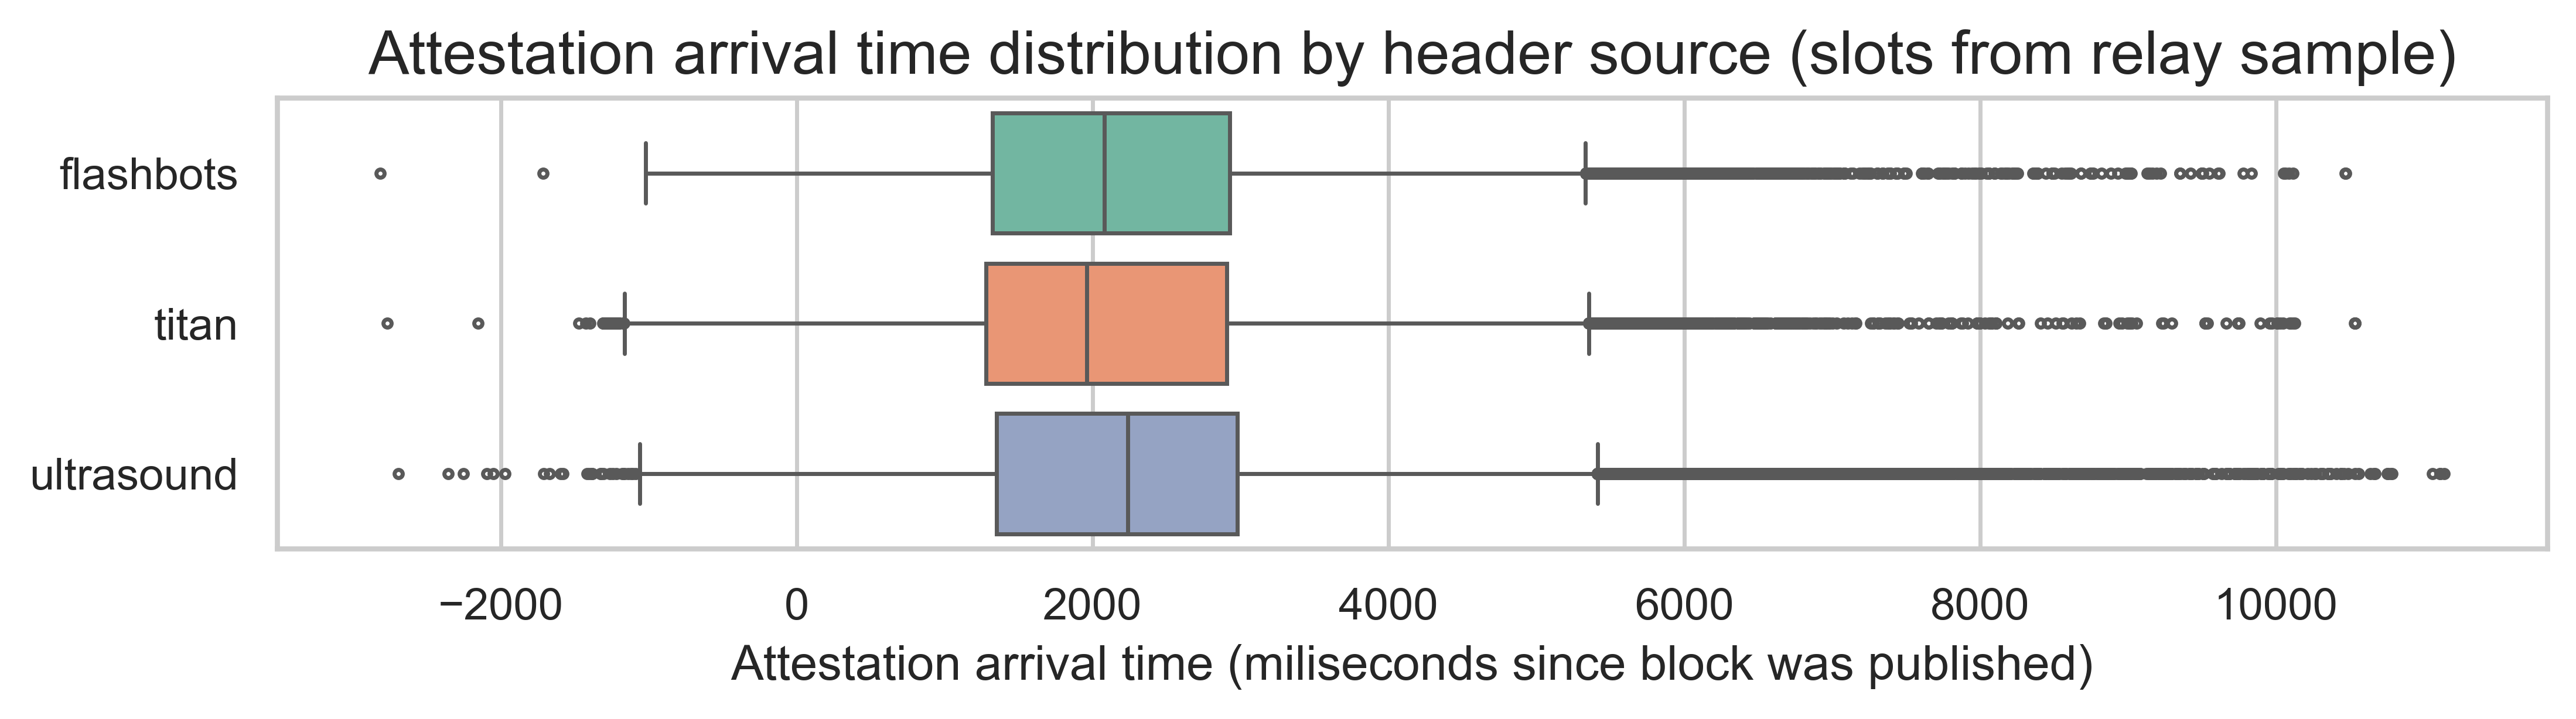
Here, we can see a clear bimodal distribution, with modes around 1.2 seconds and 3 seconds. This means that there are two groups of attestations - fast and slow. The source of the bimodal distribution is neither the header source (as shown in the plot below, the distributions are pretty similar across the various relays) nor specific slots (as evidenced by the same trend at individual slot levels).
What appears to explain the bimodal shape is the source of the attestations, i.e., the entity making the attestation. This aligns with our observations on the missed slots. Yet, the trend is even more pronounced for the arrival times of attestation.
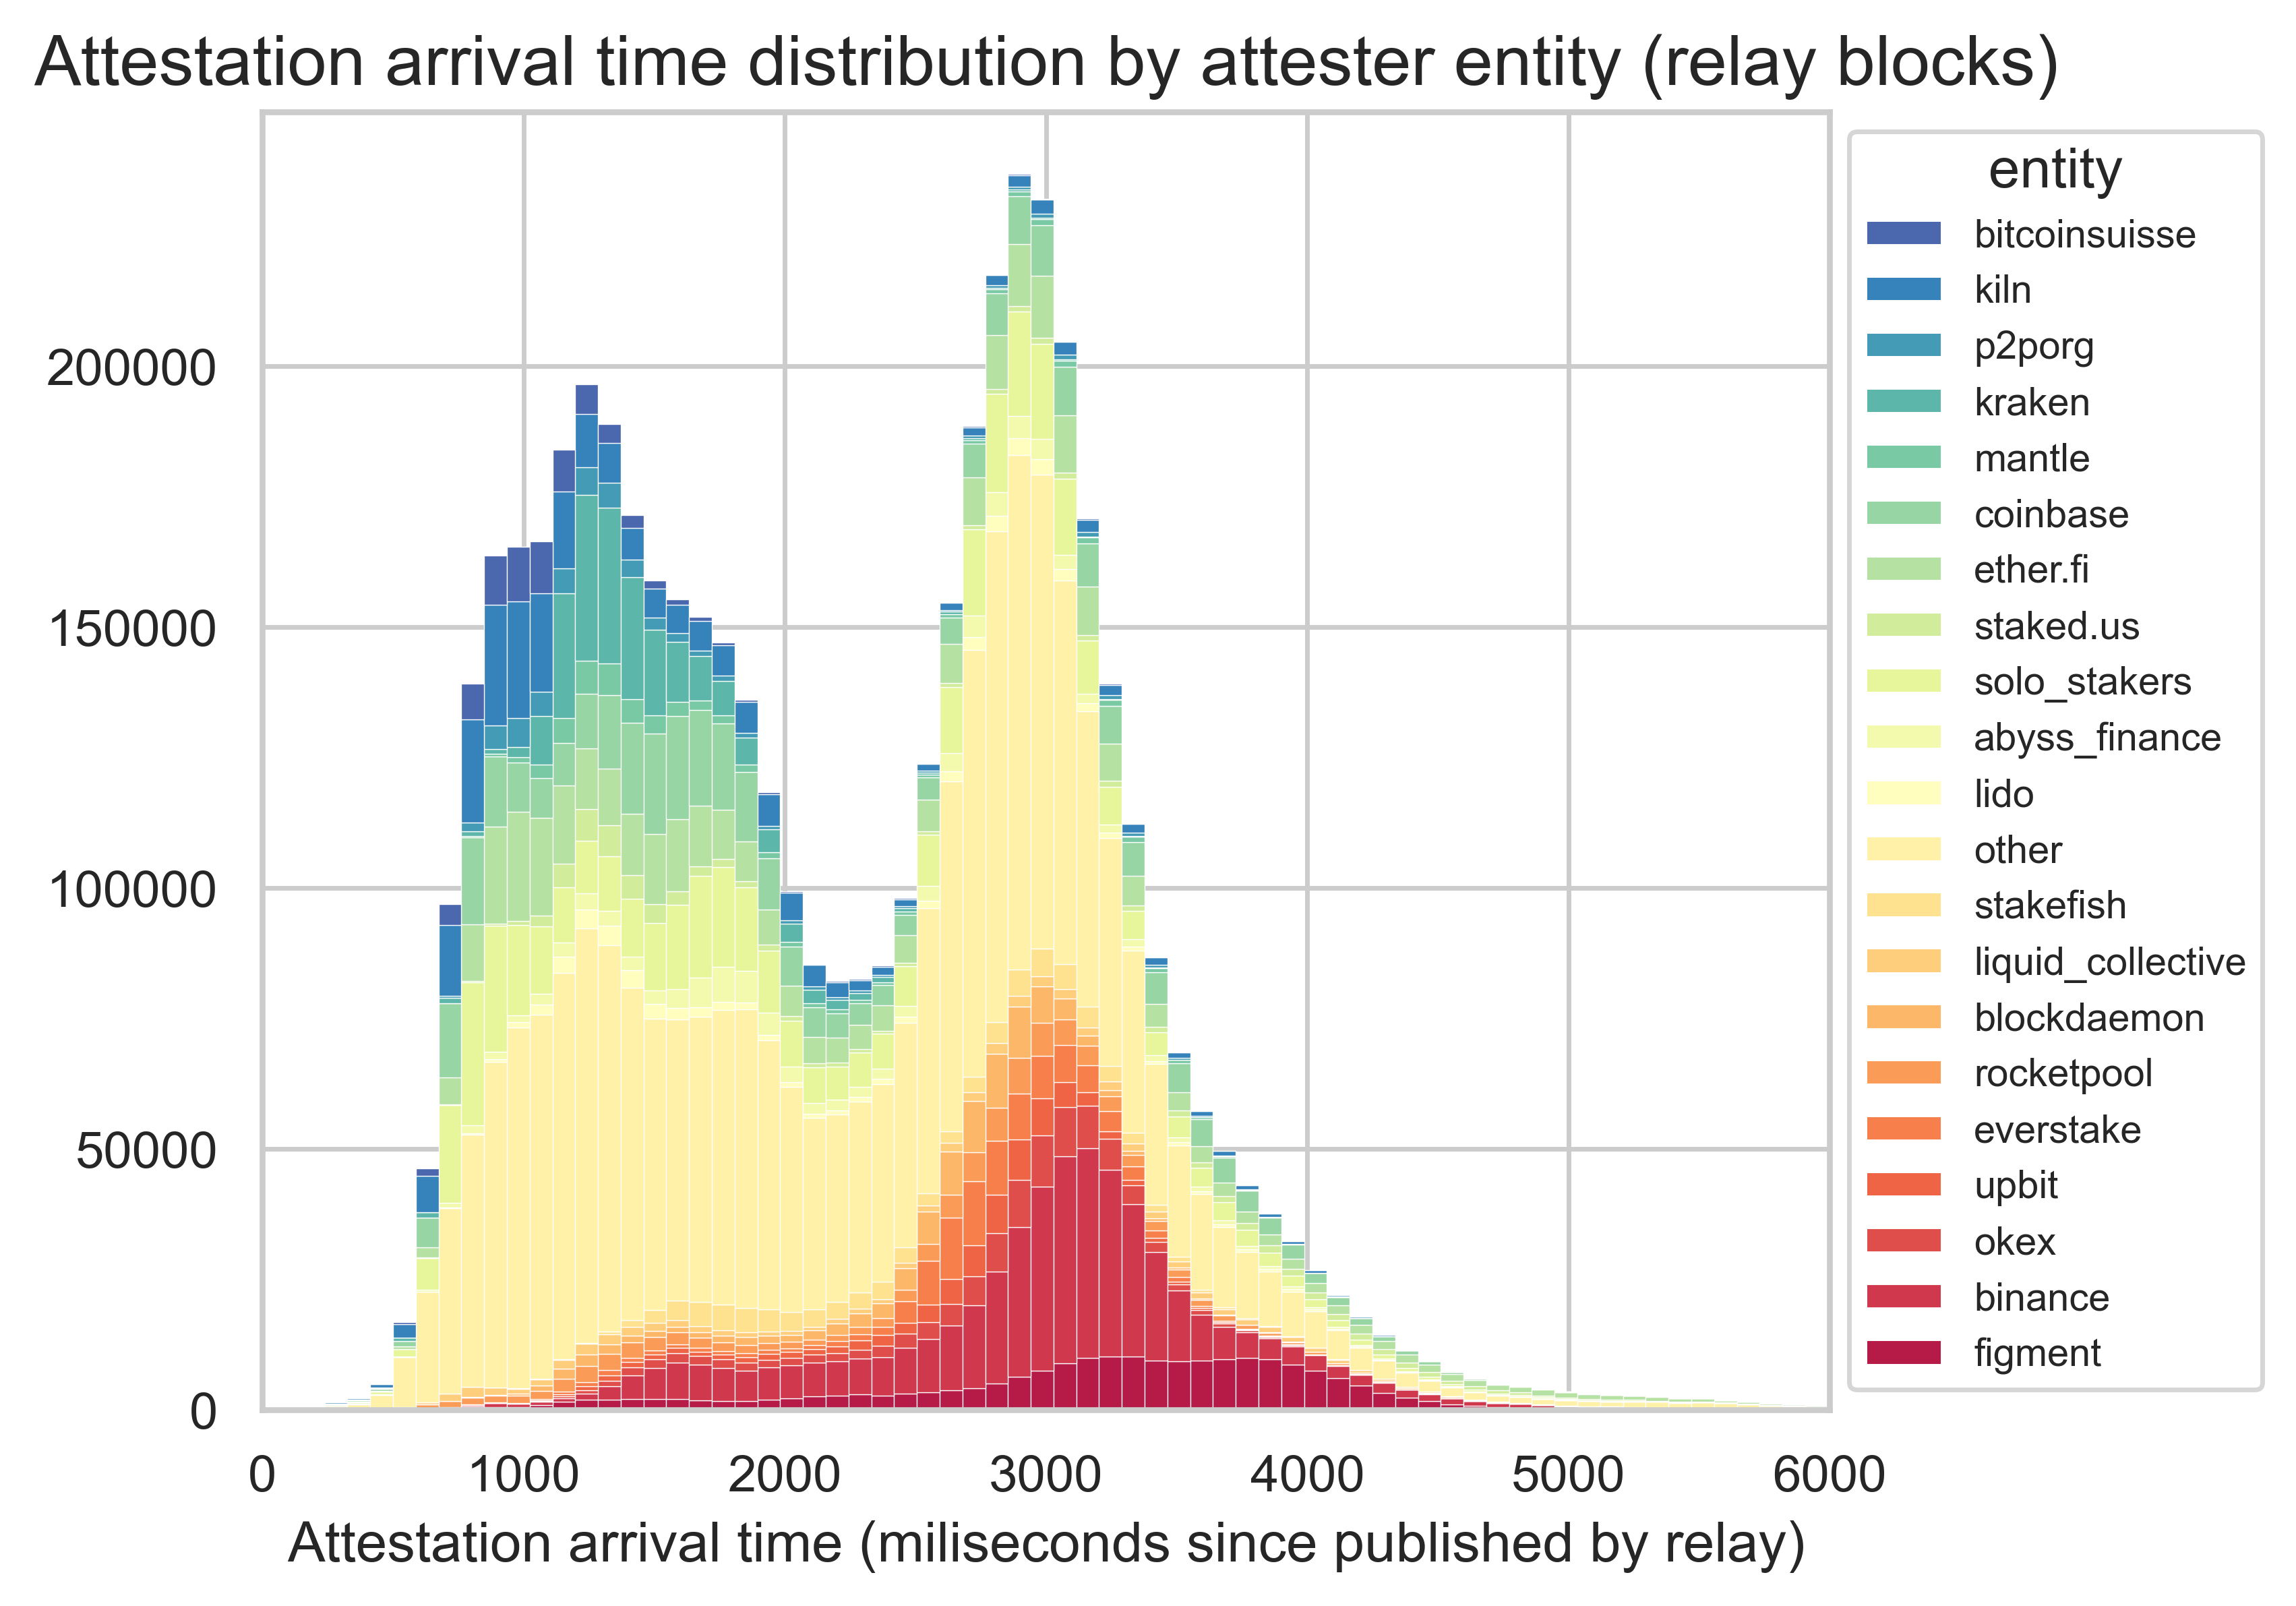
Without more information on the attesters, such as client configurations and geographical locations, it is impossible to pinpoint the exact reasons for the bi-modal shape of attestations. However, there are a few possibilities. One could be the network connectivity. Better locations and peering are expected to lead to faster attestations. Another could be the attestation logic implemented by the validator entity. Some entities attest quickly to ensure their attestation arrives on time. Others wait until they have observed other attestations to better understand which block to support to increase the probability of making their attestation canonical. Finally, similarly to what happened with Kiln, some entities may have misconfigurations or be using suboptimal client versions.
Besides the overall distribution, we computed the 95th percentile attestation within each subnet. In other words, this is the time it takes for 95% of the attestations in a given subnet to arrive (counting since the block was published by the relay). The following histogram shows the distribution of this metric for each slot and subnet.
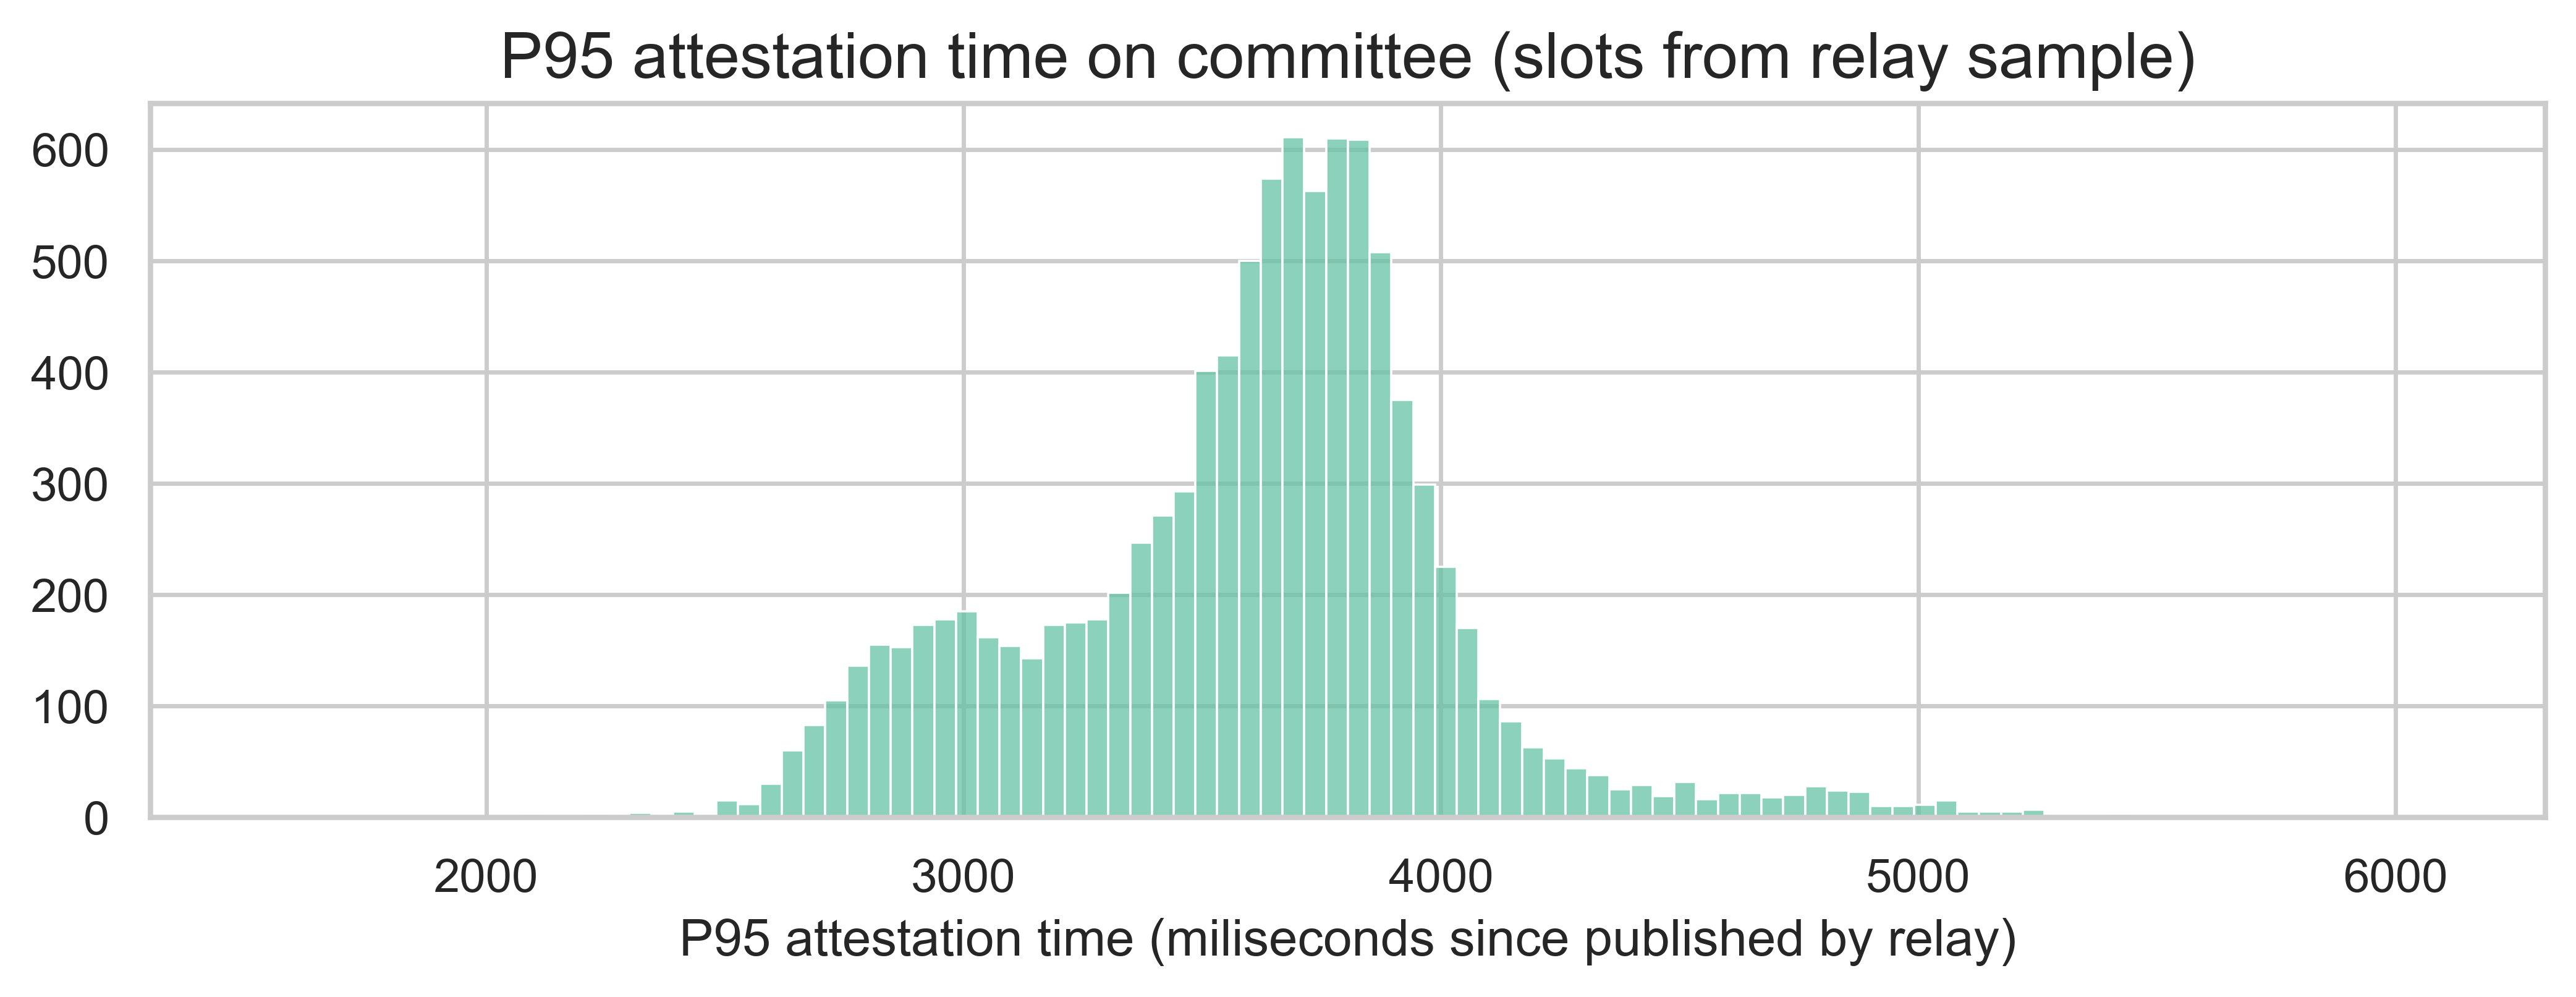
The average P95 is 3590ms, while the 95th percentile of the P95 metric is 4217ms, which is still below the 4.5-second mark required for the 6-second slot proposal.
For additional plots and analysis, refer to the notebook 2.6-committee-attestations-with-relay-v2.ipynb.
Factors impacting late attestations
To further understand the factors leading to late attestation arrivals, we used the same random sample of 4963 relay slots. We labeled each attestation as late (if it arrived after 4.5 seconds) or as on-time (if it arrived before 4.5 seconds). This cutoff of 4.5 seconds would be the aggregation deadline under a 6-second slot time. Late arrivals account for 11.1% of all attestations. To help with model training, we further undersampled the majority class (i.e., on-time arrivals) to achieve a 50:50 split on this variable.
Then, we fitted a Logistic regression with a Maximum Likelihood Estimator (MLE) to predict whether an attestation was late or on time. The positive class encodes a late attestation. For the features, we used a one-hot encoding of the atester’s entities and some information about the block, such as the gas used, the number of blobs, and the number of transactions. Using MLE allows us not only to estimate how each feature impacts the log odds of late attestations (through the coefficients of the linear model), but also to assess the statistical significance of those impacts (through the p-values).
The overall model performance is described in the next table.
                           Logit Regression Results
==============================================================================
Dep. Variable:                      y   No. Observations:               117835
Model:                          Logit   Df Residuals:                   117812
Method:                           MLE   Df Model:                           22
Date:                Wed, 27 Aug 2025   Pseudo R-squ.:                  0.2402
Time:                        17:59:49   Log-Likelihood:                -62058.
converged:                       True   LL-Null:                       -81677.
Covariance Type:            nonrobust   LLR p-value:                     0.000
The Pseudo R-squared indicates moderate explanatory power, while the Log-Likelihood and LLR p-value suggest that the model fit is statistically significant. Now, examining the features with p-values lower than 5% (see table below), we conclude that gas usage and blob count are positively associated with late arrivals, while transaction count is negatively associated. Effects are small, but highly significant due to sample size.
| Variable | Coef. | p-value | Interpretation |
|---|---|---|---|
| block_gas_used | +0.1305 | <0.001 | Higher gas usage increases the odds of a late arrival. |
| block_blob_count | +0.0589 | <0.001 | More blobs increase the odds of a late arrival. |
| block_tx_count | -0.0243 | 0.017 | More transactions slightly reduce the odds a late arrival. |
The impact of gas used and the number of blobs is as expected - blocks with higher gas usage tend to take more time to execute, while blocks with more data take longer to propagate. However, the inverse relationship with the number of transactions is unexpected. We should note that the correlation between the number of transactions and the late arrival rate in a slot is quite weak (0.015). Thus, the observed relationship is likely due to interactions with other features.
As for the entity features, they don’t appear significant in the logistic regression. This is likely due to sparsity and the linear-additive assumptions of the model. Logistic regressions can incorporate categorical variables, but they may struggle when categories are rare or interact in complex ways.
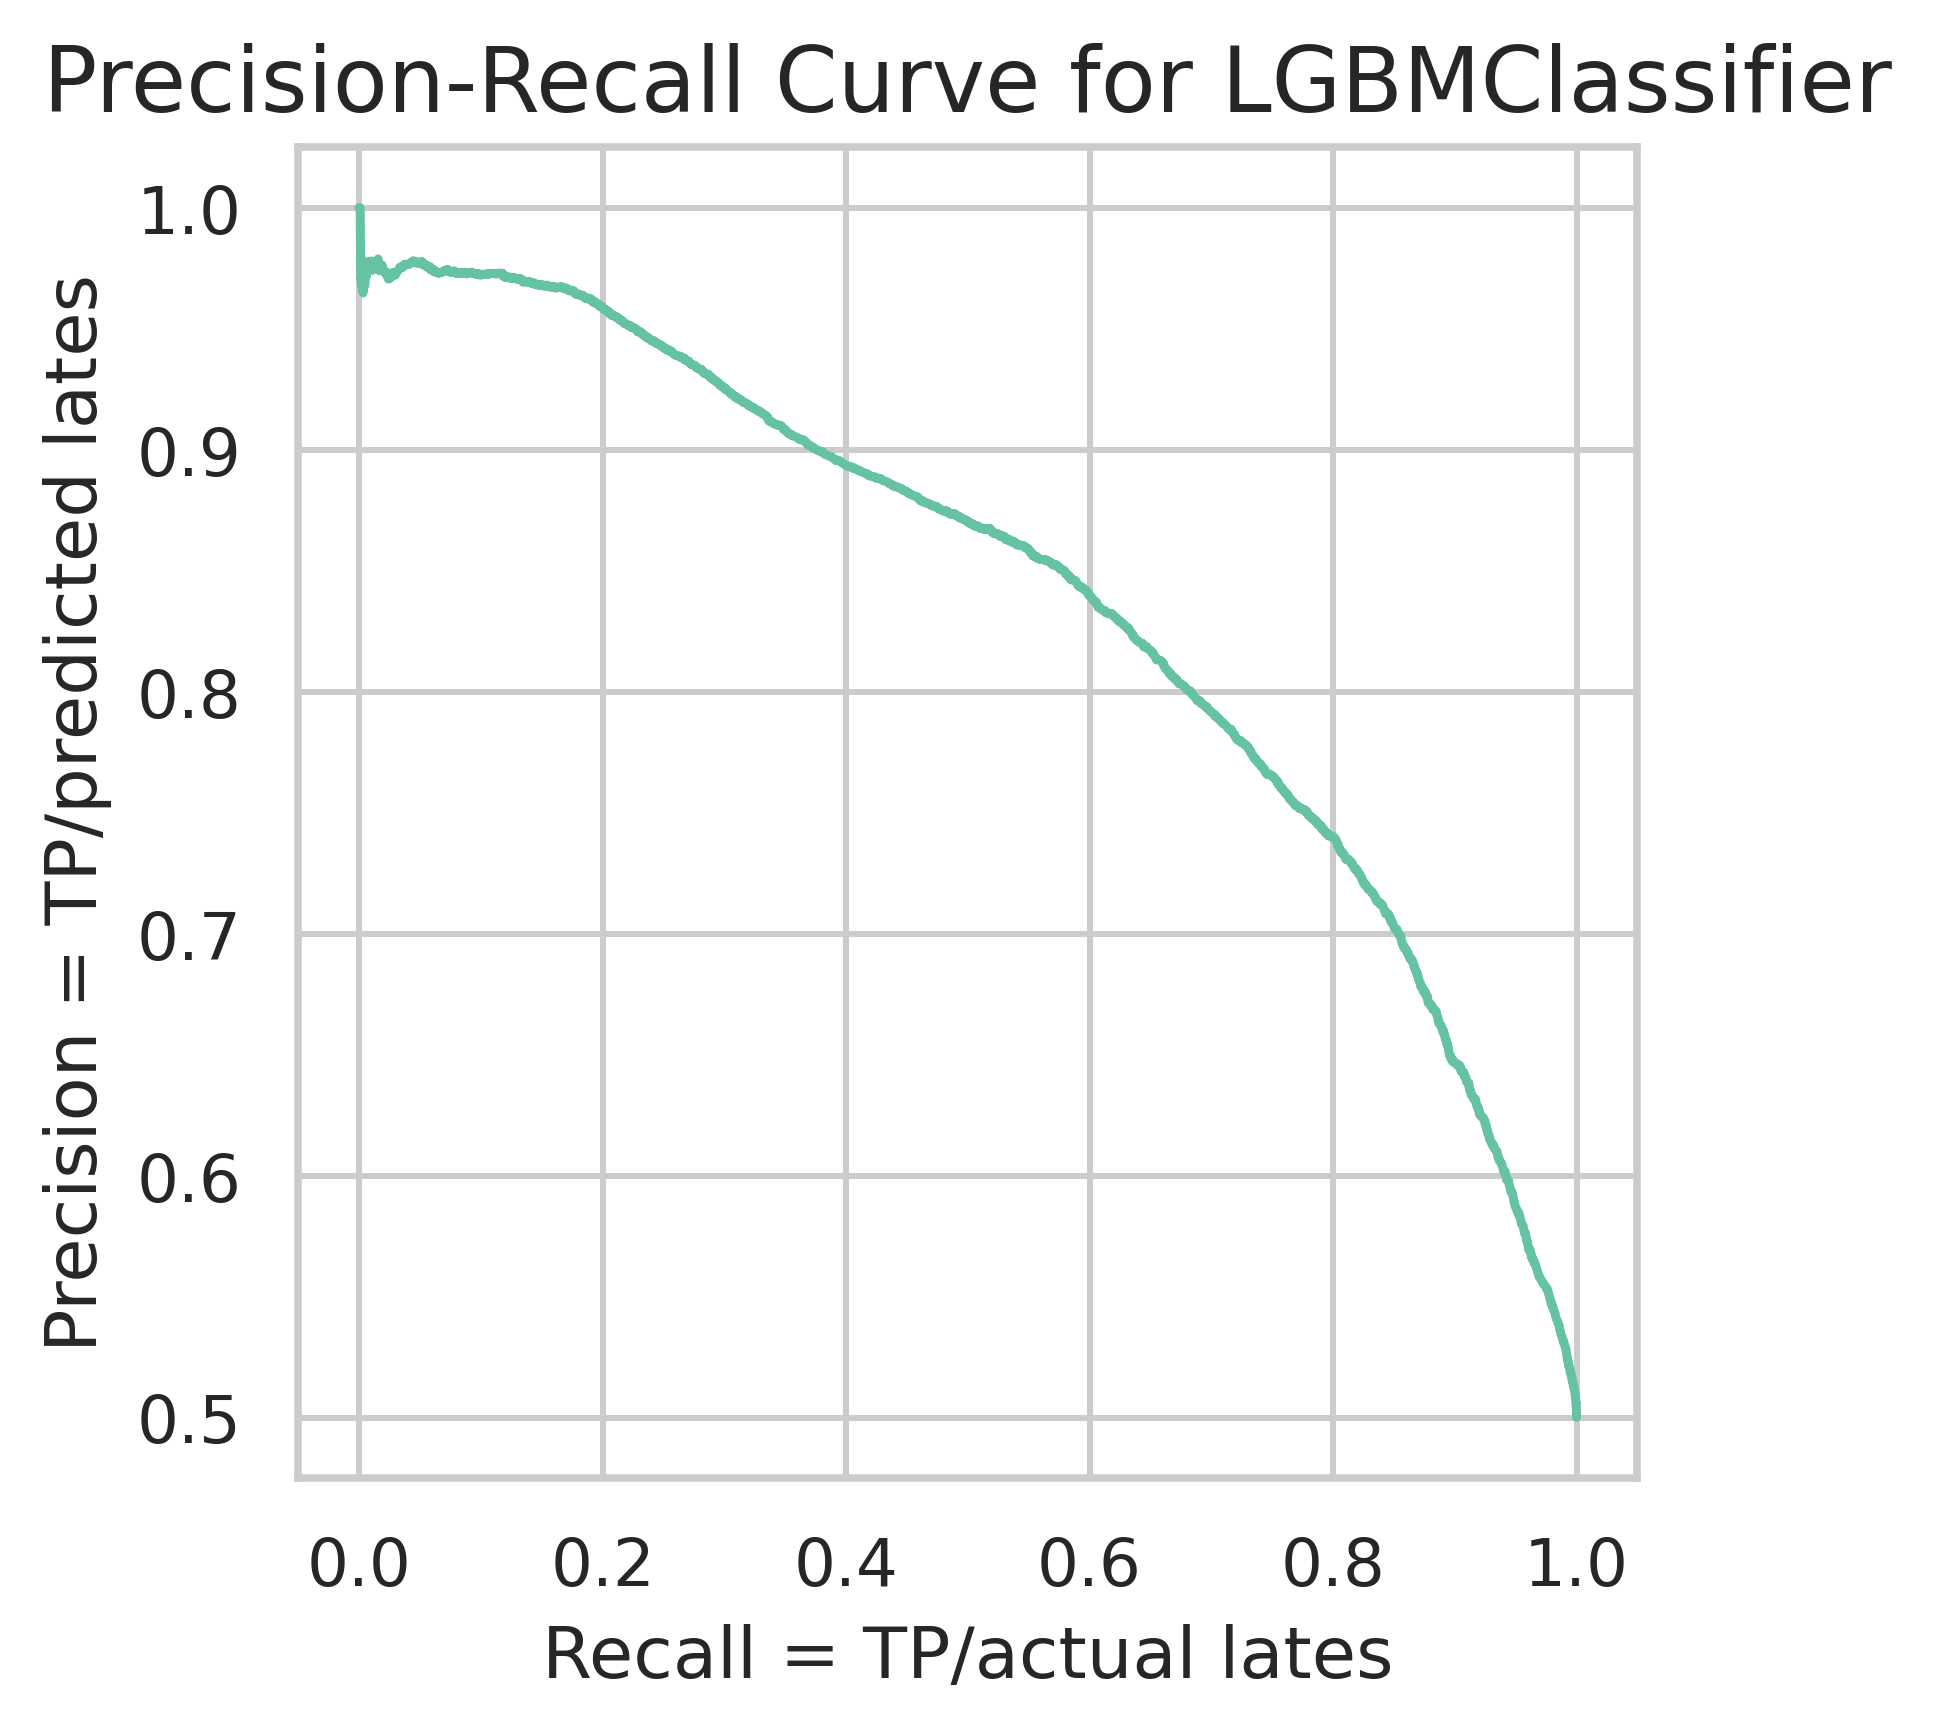
To address this, we also trained a set of tree-based models, which are better suited for capturing such non-linearities. The best performer was a LightGBM classifier. It achieved an F1-score of 0.762 and an accuracy of 0.759 on the training set.
|
In this model, entity features showed much greater relevance, as indicated by both feature importance rankings and Shapley values shown next. To help with interpretation, red dots on the right side of the beeswarm plot indicate that a feature contributes positively to late arrivals. In contrast, blue dots on the right side of the beeswarm plot suggest that a feature contributes negatively to late arrivals. For example, Stakewise has identified dots on the right side of the plot, indicating that attestations from this entity are more likely to be late than on time.
|
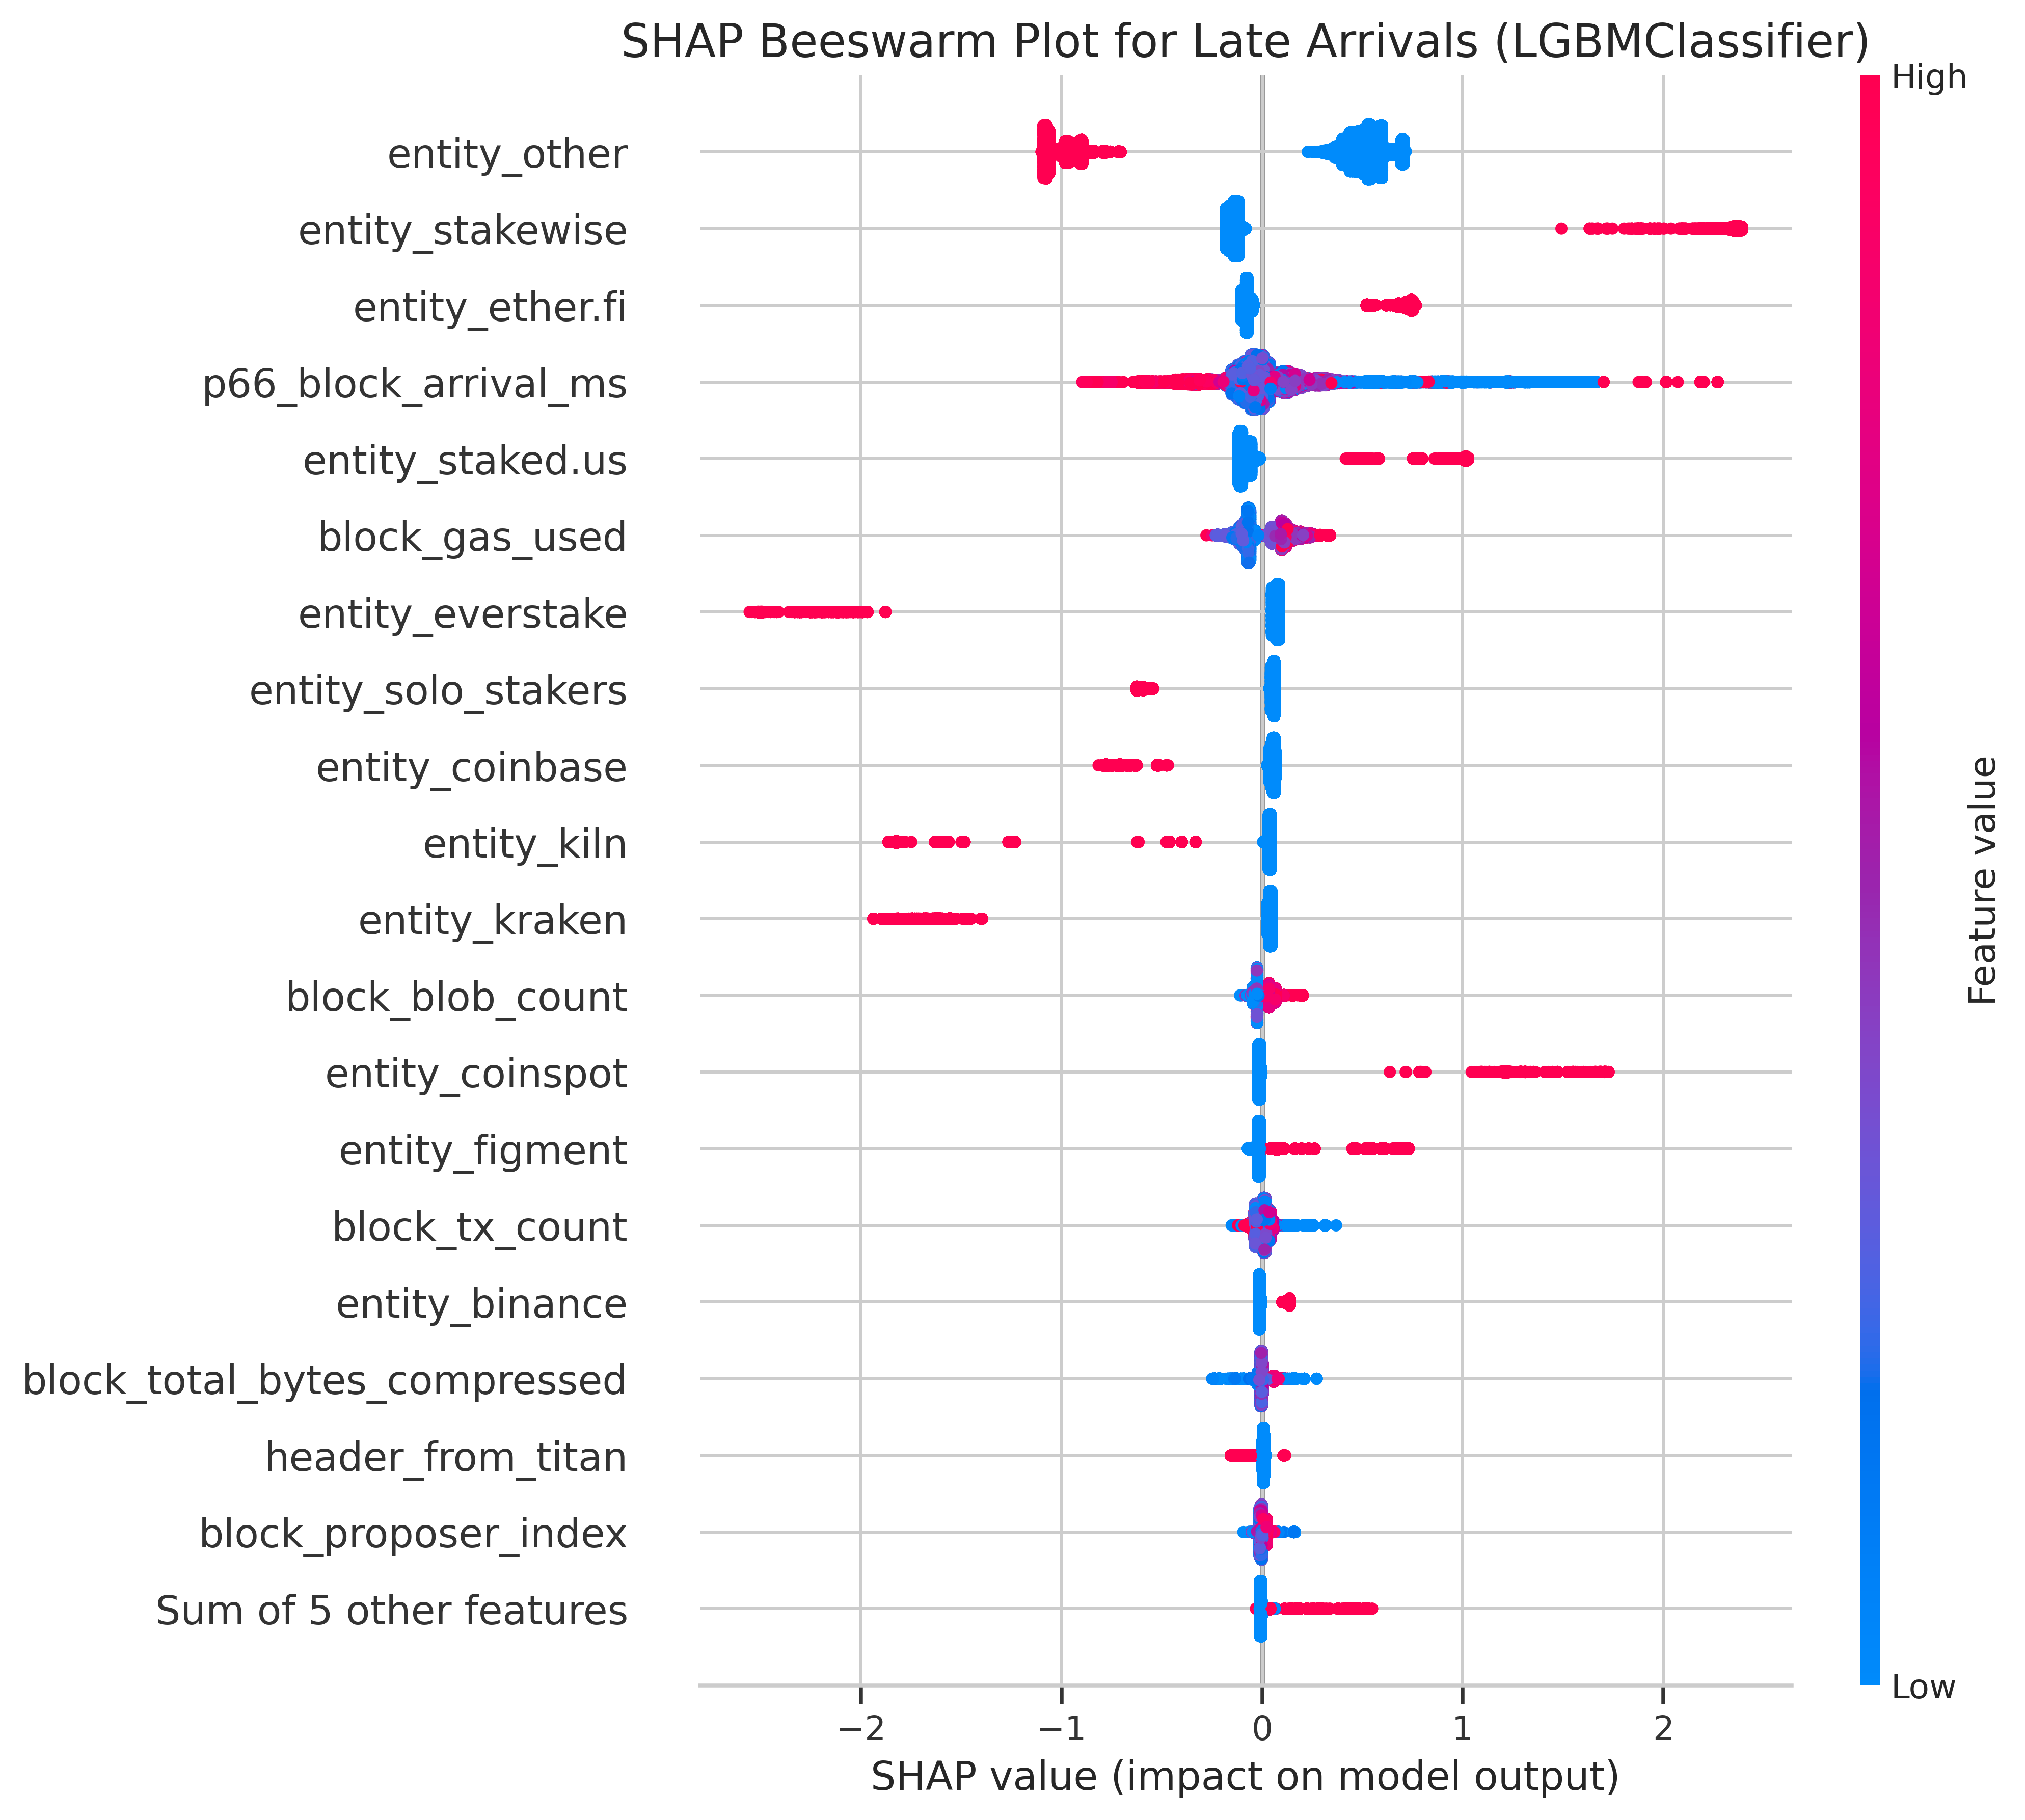
Solo stakers appear to contribute negatively to late attestations, i.e., they tend to have fewer late attestations than the average validator. Besides the entities, the number of blobs and the gas used continue to show as relevant, which supports the results from the Logistic Regression model.
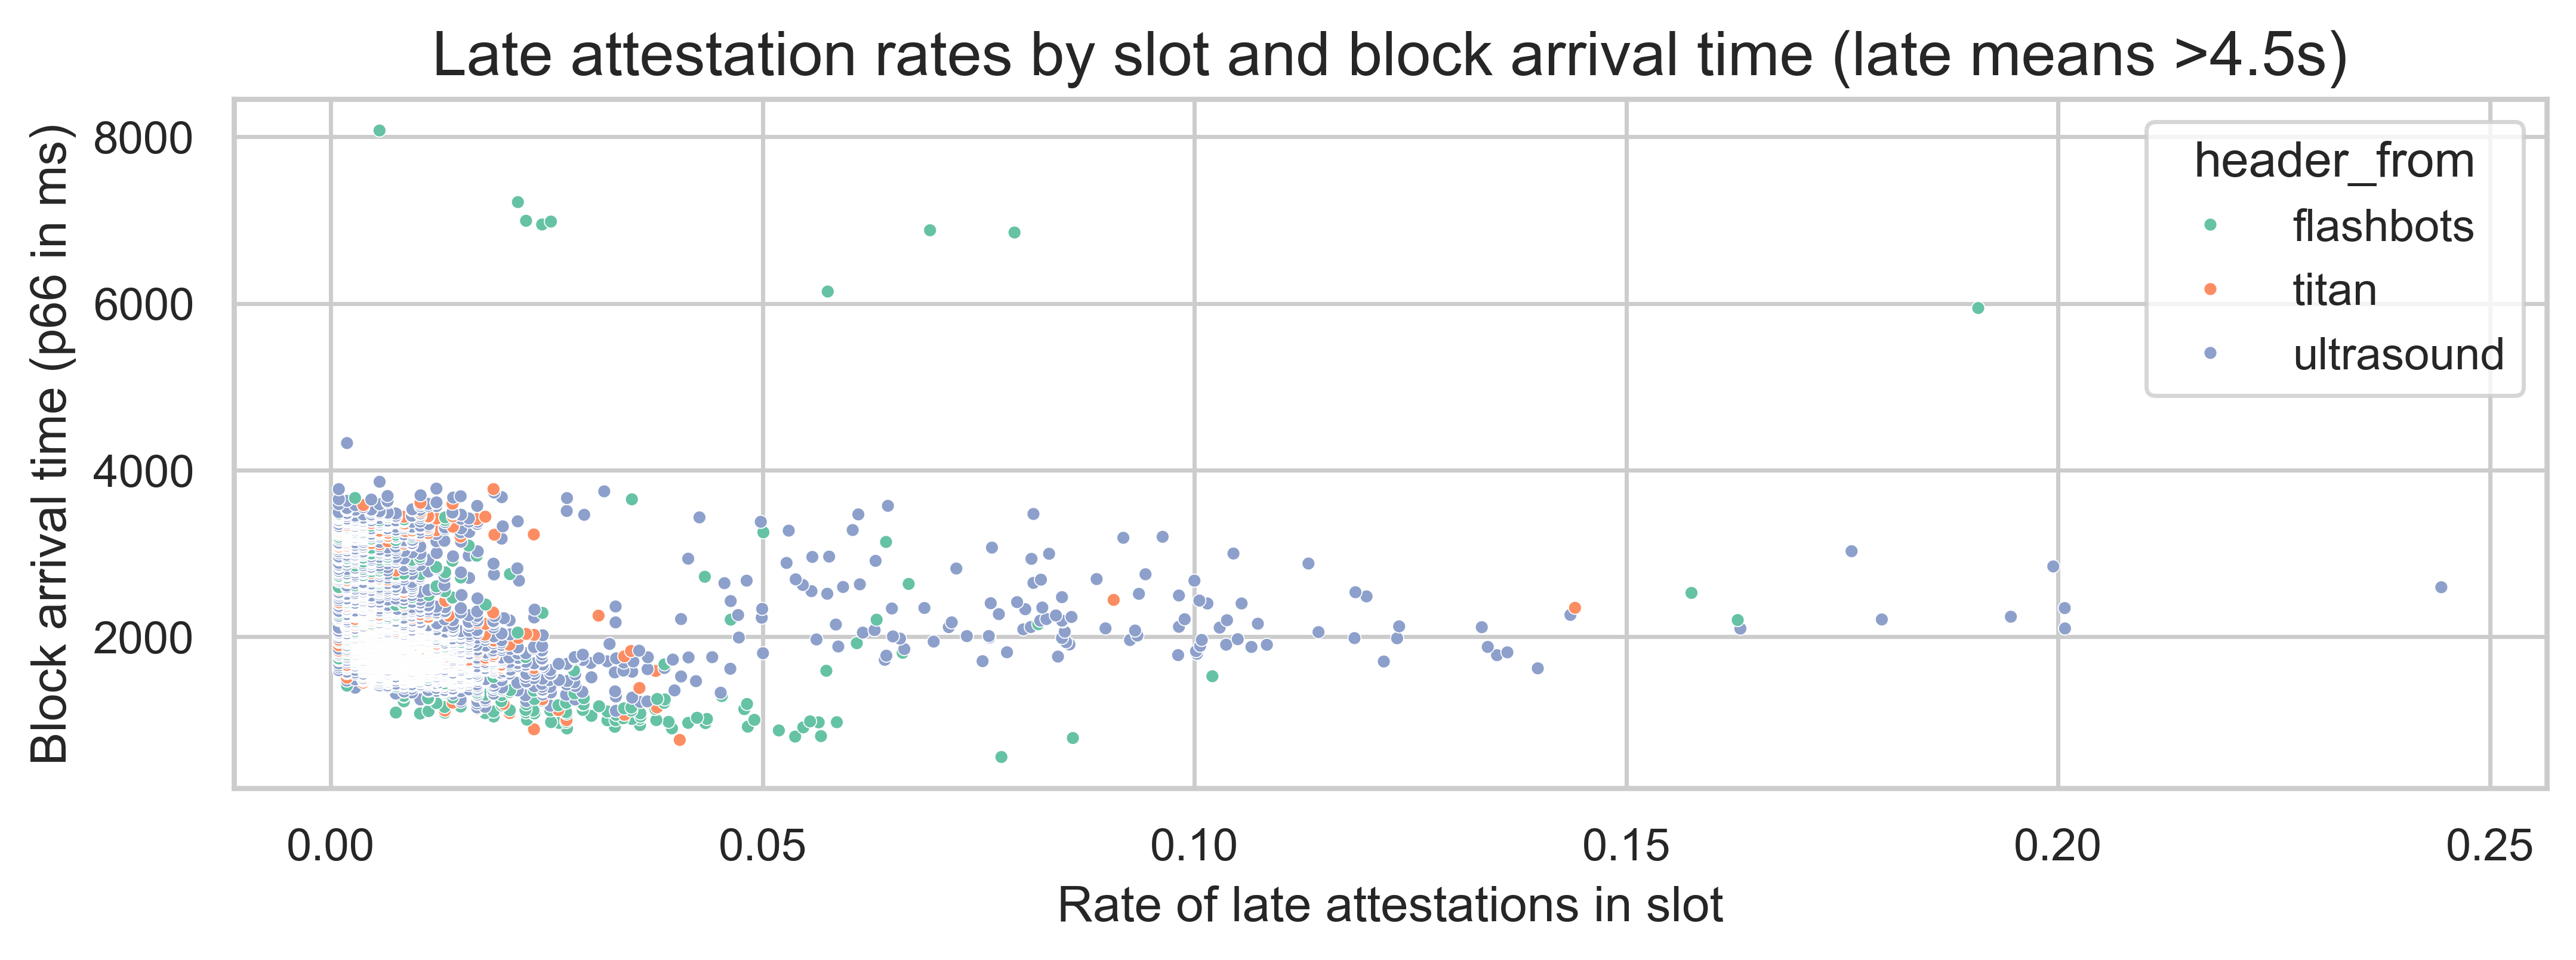
Surprisingly, the 66th percentile block arrival time does not show a clear relationship with late arrivals. It does have the highest feature importance, but the Shapley values do not show a clear trend. Looking at the following scatterplot, which compares this feature with the late arrival rate in the slot, we see that block arrivals between 1 second and 3.5 seconds do not significantly impact the rate of late attestations within a slot. This suggests that while this feature is relevant, its relationship with late attestations is complex and non-linear. Its impact is likely through interactions with other features such as the attester entity.
For additional plots and analysis, refer to the model_report. The code to replicate the model training and evaluation is late_atts_model_runner.py.