Thanks to Ciamac Moallemi, Barnabé Monnot, and Aditya Asgaonkar for discussions that led to this idea.
When trying to evaluate the performance of a network or platform one of the simplest metrics that come to mind is throughput. For Ethereum this would be the amount of transactions processed. However, this is a raw metric that does not take into account the value of processed transactions. This post describes a method to estimate/approximate two more refined metrics of network performance: the amount of value generated (welfare) and the amount of value gained by users (surplus). These can be used in many ways, for example evaluating a policy change (like the introduction of EIP-1559) or estimating how much value different apps in the ecosystem are generating and capturing.
A proper estimation of user welfare and surplus requires experimental data that we don’t have in general. However, we can construct estimators using only observational data. Note that, based on reasonable assumptions, these approximations are most likely underestimating the actual welfare and surplus generated.
Given a set of blockchain transactions, we can use transaction data to specify two relevant metrics value and cost. For type 2 transactions we have
value = max_fee * gas_used
cost = min(base_fee + max_priority_fee, max_fee) * gas_used
The cost is exact, the value is an approximation which underestimates the true value to the user. To see this note that users will never set a max_fee higher than their private valuation since this is the expression of their willingness to pay. Also, Tim Roughgarden’s analysis of EIP-1559 proves that is typically user incentive compatible to set a max_fee that is equal or smaller than their private valuation.
There is still a non-trivial amount of type 0 legacy transactions for which the users set only the gas_price. In this case we estimate cost = gas_price * gas_used which is again exact and we estimate the value using the max_fee for similar type 2 transactions. In particular, for each type 0 transaction we define a set of matched type 2 transactions (matched on time and other transaction features) and then we estimate the max_fee_0 for the type 0 transaction as the median over the matched set max_fee params and then value = max_fee_0 * gas_used.
Now for each transaction we have a measure of user welfare = value and of user surplus = value - cost and we can aggregate at any level we please.
Examples
Considering all Ethereum transactions from January 1st 2023 we can see that the network generated user welfare of 2,754 ETH and surplus of 943 ETH. Users paid for transactions 35% less than they were valuing them and gained in aggregate almost 1K ETH of economic value!
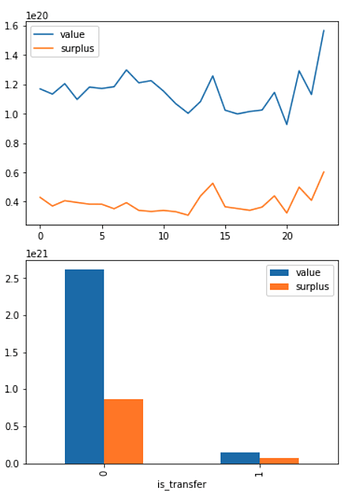
Similarly we can look at sum over all blocks in each hour of day and see that the network was consistently generating about 120 ETH of welfare and 40 ETH of surplus per hour. [See first chart below.]
As another example of things we can measure, we can look at the nature of transactions. Here we look at simple token transfers versus other types (but one measure specific contracts, apps and other parts of the ETHconomy). Here we see that the majority of value is more complex transactions, but while these are relatively expensive to users (surplus is only 30% of value on average) token transfers are quite cheap with user surplus ratio up to 50%. [See second chart below.]

