Bayesian network model of Witness Creation - Feedback request
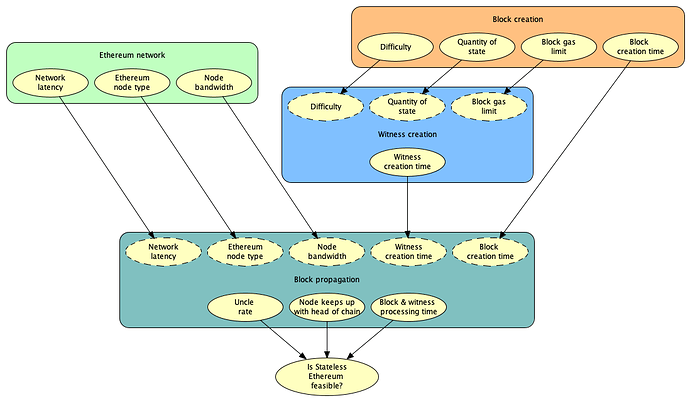
We developed a Bayesian Network (BN) model to capture and quantify the key factors and processes of Ethereum MainNet, and their interactions, including the proposed changes being introduced to the network by implementing Stateless Ethereum (Figure 1). The expected outcome is to have a probabilistic estimate of the feasibility of Stateless Ethereum, and to reason about different scenarios that may occur and their potential impact on the feasibility of Stateless.
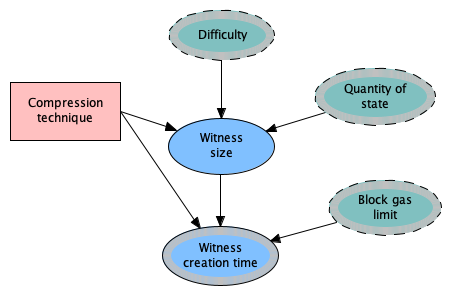
The aim of this post is to elicit feedback from the Ethereum community regarding the inclusion of proposed techniques for reducing witness sizes in the Witness Creation BN model (Figure 2).
Bayesian networks
A Bayesian network (BN) is a probabilistic graphical modelling approach, constructed as a directed acyclic graph (DAG) comprising key factors as nodes, directed links between factors representing relationships between the nodes and then quantified using conditional probability distributions that capture the nature and strength of relationships between factors.
BN models are typically constructed in one of three ways:
- entirely from data, using various machine learning algorithms to determine the model structure and the probability distributions, or
- entirely from expert knowledge and/or literature, especially if data are not available, or difficult, or dangerous, to obtain, or
- using a combination of data sources: empirical, expert knowledge, model output, and literature.
Option 3 is arguably the preferred approach, since it enables us to gather and include all available knowledge and information available at the time.
There are many extensions to the basic BN mode. For example, an object oriented BN (OOBN) is a more hierarchical approach to BN model development. This was the approach taken for the Stateless Ethereum BN; see Figure 1 below.
Using a BN, it is possible to ask “What if?” questions, e.g. “What is the likely impact on the feasibility of Stateless Ethereum if the state size grows by 1.5 times?” (predictive reasoning), or “If we observe a particular situation, what are the most probable explanations?” (diagnostic reasoning).
This modelling approach is widely used in areas such as software defects prediction [1], criminal profiling [2], forensic science [3], medical body sensors [4], medical diagnosis [5], pathology [6], algal blooms[7], conservation [8, 9], pest risk management [10], manufacturing: assembly fixture fault diagnosis [11], finance operational risk modelling [12], and is of particular interest in the context of Stateless Ethereum due to the combination of known and unknown processes and influences on the Ethereum ecosystem.
Stateless Ethereum Bayesian network model
The initial model structure was designed through consultation with Ethereum experts, predominantly from ConsenSys. The structure was then updated to incorporate some additional insights gained from running BN data mining algorithms. The validity of the proposed changes were discussed with experts before incorporating them into the model.
The overall aim of the Stateless Ethereum model is to have a better understanding of the feasibility of Stateless Ethereum, particularly in light of changes being introduced into the Ethereum 1.0 network, i.e. exploring what the potential consequences of different scenarios may be, and how they affect other parts of the system, as well as the overall feasibility of Stateless.
The high level OOBN model of Stateless Ethereum (Figure 1) consists of four sub-models, each representing a particular part of Stateless Ethereum. The Witness creation OOBN is shown in Figure 2 below.
Figure 1: High level OOBN model of Stateless Ethereum showing four BN sub-models and the flow of information between them
- Empirical data were used to calculate conditional probability tables, and to run BN data mining algorithms to learn model structures.
- Expert knowledge was used to critique data generated structures, identify key processes, dependencies and interactions, and to elicit prior probabilities.
- Probabilities were learnt from data, and supplemented with expert knowledge as required.
Figure 2: Witness creation OOBN model
In Figure 2, the nodes (factors) shown as broken line ellipses: Difficulty, Quantity of state, and Block gas limit, are known as input nodes. Input nodes act as placeholders for factors whose marginal probability distributions have been calculated in another OOBN sub-model. For example, Quantity of state is quantified in the Block creation sub-model using block data from Ethereum mainnet, and is also required as input to the Witness creation OOBN.
The ellipses with solid lines: Witness size and Witness creation time, are being quantified in this sub-model using output from the witness spec implementation done by TeamX of ConsenSys in August 2020. Compression technique, which is represented by rectangle, indicates a decision. In this case the decision is the choice of compression technique:
- No compression
- Verkle tree
- SNARKed tree
The probability distributions for Witness size and Witness creation time were obtained by supplementing the block data of 26,545 blocks with the corresponding data from the Besu witness spec implementation. No compression techniques were applied to the witnesses to decrease their size, and therefore these results correspond to decision option 1 above.
The conditional probability table for Witness size, which was learnt from data, is shown in Figure 3.
Figure 3: Conditional probability table for Witness size
Witness size reduction
The current (March 2021) proposal for witness size reduction, appears to favour the implementation of Verkle trees, a tree of Kate commitments, leveraging the benefits of trees and cryptographic accumulators.
Therefore the conditional probabilities of Witness size and Witness creation time need to be updated to reflect option 2. Similarly, the probabilities will need to be updated if SNARKed trees (option 3) are used.
Request for feedback: Integrating current witness compression techniques
The time to perform the necessary calculations for Verkle trees and STARKed trees, and the expected reduction in size need to be taken into account in the Witness creation BN model.
The open question is:
What is the most appropriate way to incorporate these techniques in the BN model?
In other words, if Verkle trees are being implemented, how will the resulting conditional probability distributions of Witness size and Witness creation time be affected?
Based on Vitalik’s comments regarding Verkle trees:
-
one possible approach is to use the maximum witness size and creation time estimates, and assume that the conditional probability distributions based on the witness spec implementation are preserved.
-
An alternative option would be to check what the expected size reductions would be for particular combinations of difficulty and quantity of state, if Verkle trees were being used, again applying them to the current distribution. (Similar approach to 1.)
-
The preferred option is to create Verkle trees for the blocks that were used for the witness spec implementation and record the corresponding witness size and creation time.
A similar process could be used for STARKed binary trees using the same historic block data. However, the time overheads to use STARKed trees and the expected reduction in size may be less clear at this stage.
I look forward to hearing from the Ethereum community on suggested ways to incorporate witness compression techniques, especially Verkle trees, in the Witness Creation BN model.
References
[1] K. Jeet, N. Bhatia, and R. Minhas, “A bayesian network based approach for software defects prediction,” ACM SIGSOFT Softw. Eng. Notes, vol. 36, no. 4, pp. 1–5, 2011.
[2] K. C. Baumgartner, S. Ferrari, and C. G. Salfati, “Bayesian Network Modeling of Offender Behavior for Criminal Profiling,” vol. 2005. IEEE, pp. 2702–2709, 2005.
[3] F. Taroni, Bayesian Networks for Probabilistic Inference and Decision Analysis in Forensic Science, 2nd Edition, 2nd edition. John Wiley & Sons, 2014.
[4] H. Zhang, J. Liu, and A.-C. Pang, “A Bayesian network model for data losses and faults in medical body sensor networks,” Comput. Networks, vol. 143, pp. 166–175, 2018.
[5] A. T. S. Alobaidi and N. T. Mahmood, “Modified Full Bayesian Networks Classifiers for Medical Diagnosis.” IEEE, pp. 5–12, 2013.
[6] A. Onisko, M. J. Druzdzel, and R. M. Austin, “Application of Bayesian network modeling to pathology informatics,” Diagn. Cytopathol., vol. 47, no. 1, pp. 41–47, 2019.
[7] S. Johnson, E. Abal, K. Ahern, and G. Hamilton, “From science to management: Using Bayesian networks to learn about Lyngbya,” Stat. Sci., vol. 29, no. 1, 2014.
[8] S. Johnson et al., “Modelling cheetah relocation success in southern Africa using an Iterative Bayesian Network Development Cycle,” Ecol. Modell., vol. 221, no. 4, 2010.
[9] S. Johnson et al., “Modeling the viability of the free-ranging cheetah population in Namibia: an object-oriented Bayesian network approach,” Ecosphere, vol. 4, no. 7, p. art90, Jul. 2013.
[10] J. Holt et al., “Bayesian Networks to Compare Pest Control Interventions on Commodities Along Agricultural Production Chains,” Risk Anal., vol. 38, no. 2, 2018.
[11] S. Jin, Y. Liu, and Z. Lin, “A Bayesian network approach for fixture fault diagnosis in launch of the assembly process,” Int. J. Prod. Res., vol. 50, no. 23, pp. 6655–6666, 2012.
[12] A. D. Sanford and I. A. Moosa, “A Bayesian network structure for operational risk modelling in structured finance operations,” J. Oper. Res. Soc., vol. 63, no. 4, pp. 431–444, Apr. 2012.


