TDLR
- The main applications using blobs are rollups, accounting for approximately 87%. Non-rollup applications mainly include Blobscriptions and customized type 3 transactions.
- Rollup applications choose different blob usage strategies according to their own situations. The strategies will consider the number of blobs carried by type 3 transactions, blob utilization, and blob submission frequency to balance the costs of availability data fees and delay costs.
- Non-rollup applications can be characterized and distinguished from rollup applications by the number of blobs carried by type 3 transactions, blob utilization, and blob submission frequency. These features help identify scenarios of blob abuse, allowing for the design of corresponding anti-abuse mechanisms.
- In most cases, using blobs as a data availability solution is more cost-effective than calldata. However, there are a few scenarios where calldata is cheaper: blob gas price spikes and blob utilization is extremely low.
- Short-term fluctuations in blob gas price is mainly influenced by the demand from non-rollup applications. Rollup applications have a relatively inelastic demand for blobs, so they do not significantly impact short-term fluctuations in blob gas prices.
- Currently, rollup applications do not seem to consider blob gas price as a reference factor in their blob usage strategies.
- The probability of blocks containing type 3 transactions being reorganized is extremely low. Additionally, carrying more blobs does not increase the probability of block reorganization. However, there is a clustering phenomenon in block height for blocks containing type 3 transactions.
Introduction
This report provides an in-depth analysis of type 3 transactions used for carrying blobs from the time of the Ethereum Decun upgrade until May 22, 2024. It focuses on blob usage strategies of rollup and non-rollup applications. The dataset, data processing programs, and visualization code for this report are open source, detailed in the following “Dataset” section.
Type 3 Transactions & Blobs Share by Applications
Rollup Applications
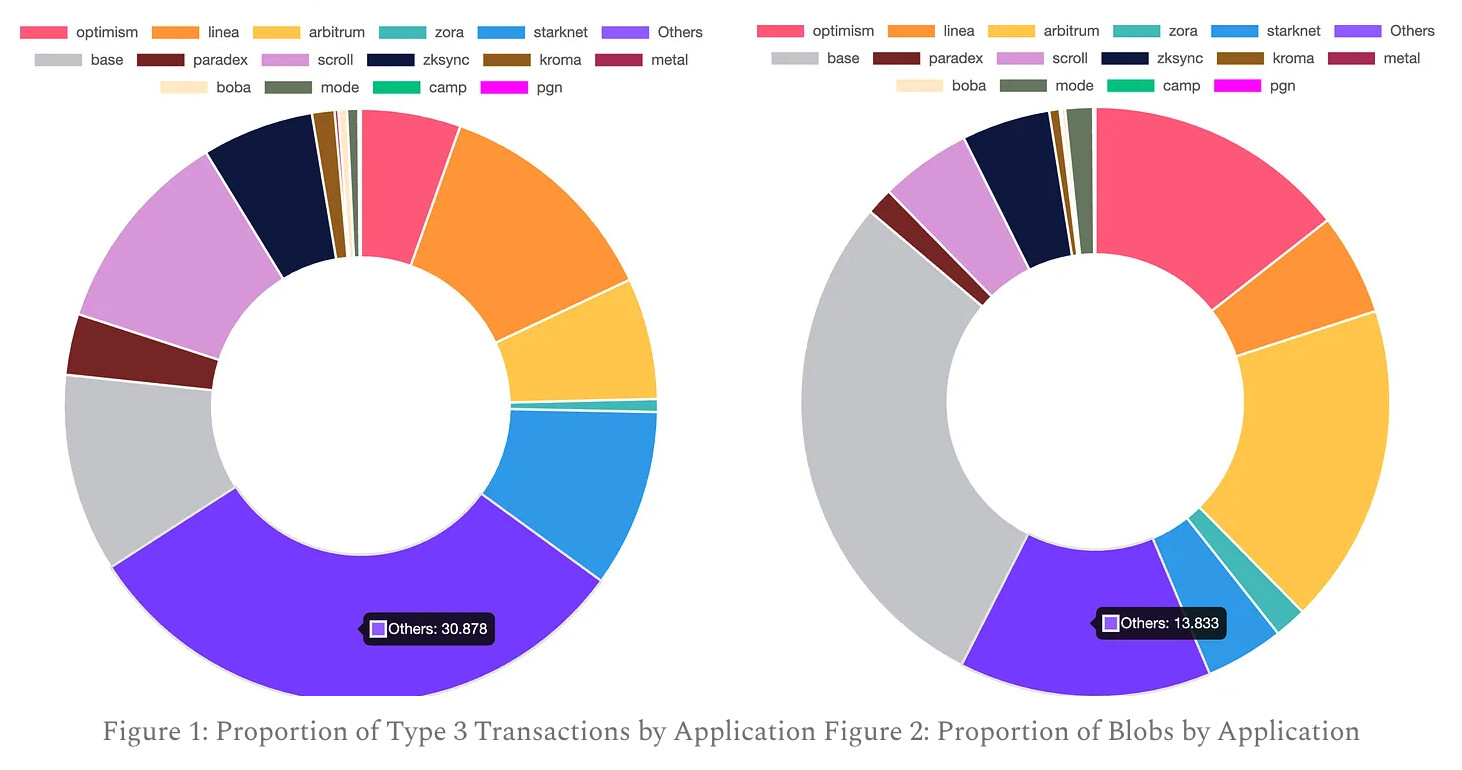
Observations from Figure 1 on the proportion of type 3 transactions:
- Base, Scroll, Linea, and Starknet are in the same tier, having the highest transaction proportions.
- Arbitrum, Optimism, and Zksync are in the next tier, having the second-highest transaction proportions.
This phenomenon seems counterintuitive as Arbitrum and Optimism have higher TPS than Scroll, Linea, and Starknet and should have a higher proportion of type 3 transactions.
Figure 2 shows that counterintuitive phenomenon is caused by different rollup strategies in the number of blobs carried by type 3 transactions.
Observations from Figure 2 on the proportion of blobs:
- Base stands alone, having the highest proportion of blobs.
- Arbitrum and Optimism are in the same tier, having the second-highest proportion of blobs.
- Scroll, Linea, Starknet, and Zksync are in the same tier, having a medium proportion of blobs.
This phenomenon aligns more with intuition: blob proportions are directly related to the scale of rollup’s availability data, thus showing a positive correlation with rollup TPS.
The difference between the proportion of type 3 transactions (31%) and blobs (14%) for non-rollup applications indicates that non-rollup applications and rollup applications have different needs.
Non-Rollup Applications
- Rollup applications are B2B businesses aiming to fill fine-grained Layer 2 transaction availability data, so their type 3 transactions are not limited to carrying only 1 blob.
- Non-rollup applications are B2C businesses aiming to upload complete text, images, etc., so their type 3 transactions usually carry only 1 blob to meet their needs.
Rollup Blob Usage Strategies
Rollup Strategy Model
This section models the rollup blob usage strategies with
blobNumber, i.e. the number of blobs carried by type 3 transactionsblobUtilization, i.e. blob space utilizationblobInterval, i.e. the blob submission interval
Fee Cost
The fee cost per transaction for rollups is expressed as:
fixedCost: the fixed cost of a type 3 transactionblobCost: the cost of a single blob- The larger the
blobUtilization, the lower the amortized cost of the blob fee \frac{blobCost}{blobUtilization} and the fixed cost \frac{fixedCost}{blobNumber*blobUtilization}, resulting in a lower fee costfeeCost. - The larger the
blobNumber, the lower the amortized cost of the fixed cost \frac{fixedCost}{blobNumber*blobUtilization}, resulting in a lower fee costfeeCost.
Delay Cost
The delay cost per transaction for rollups is expressed as:
- The larger the
blobUtilization, the larger the delay costdelayCost. - The larger the
blobNumber, the larger the delay costdelayCost. - The larger the
tps, the smaller the delay costdelayCost.
The derivation of the formula can be found in the full version.
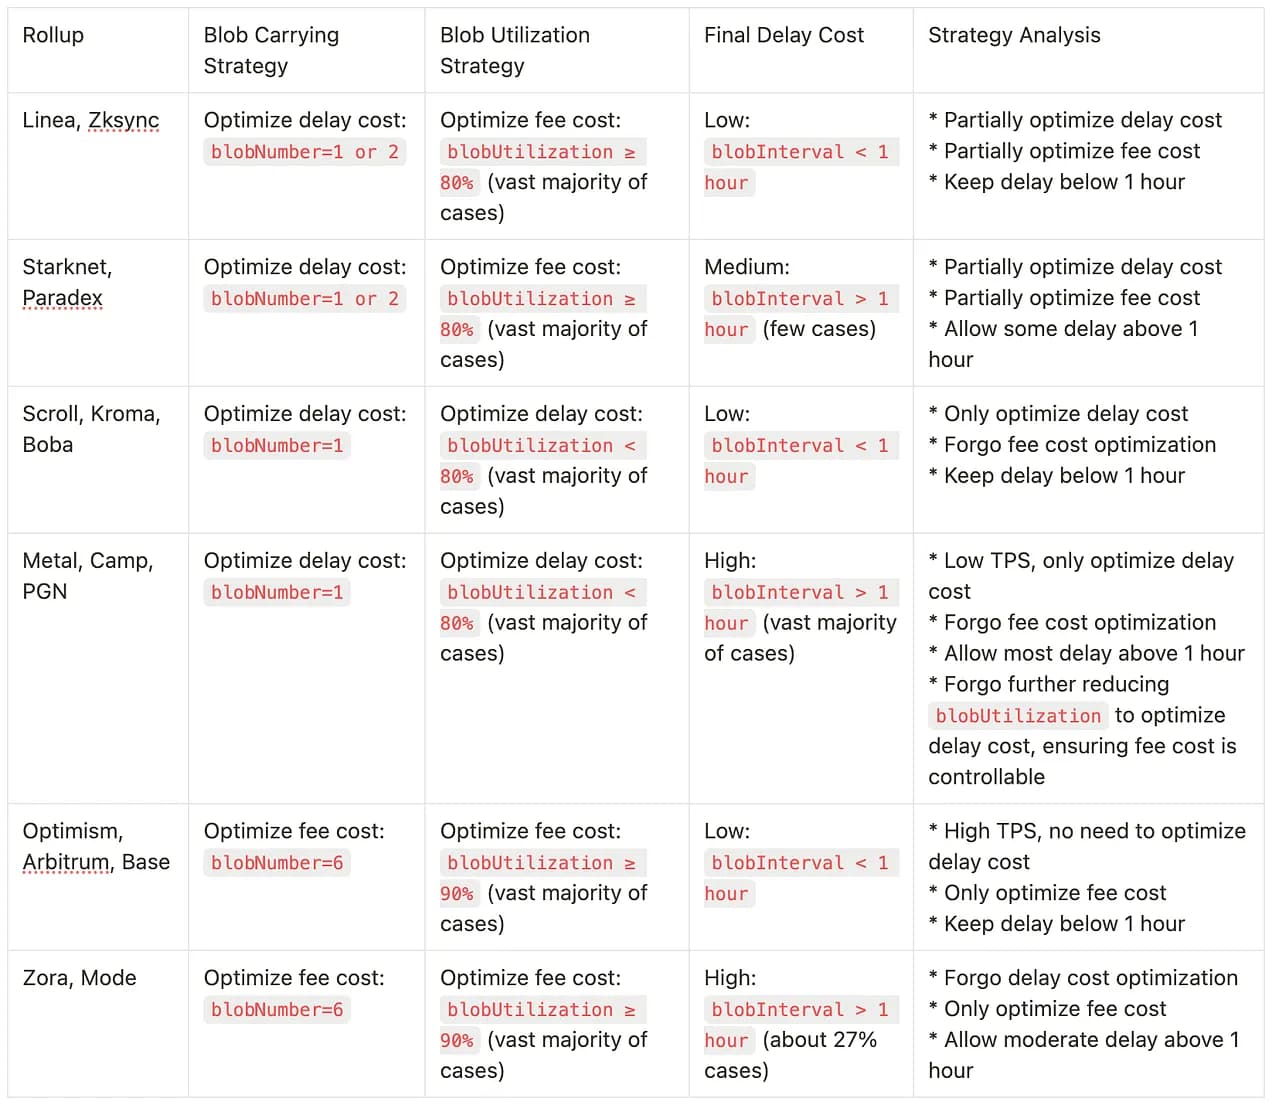
Rollup Strategy Analysis
Non-Rollup Blob Strategies
Rollup applications are B2B, while non-rollup applications are B2C. Therefore, non-rollup applications differ from the rollup strategy model. For non-rollup applications:
- The number of blobs carried by type 3 transactions depends on the size of the content (texts/images) stored in the blobs.
- Blob utilization depends on the size of the content (texts/images) stored in the blobs.
- Blob submission intervals depend on the immediate needs of C-end users, with no delay costs involved.
-
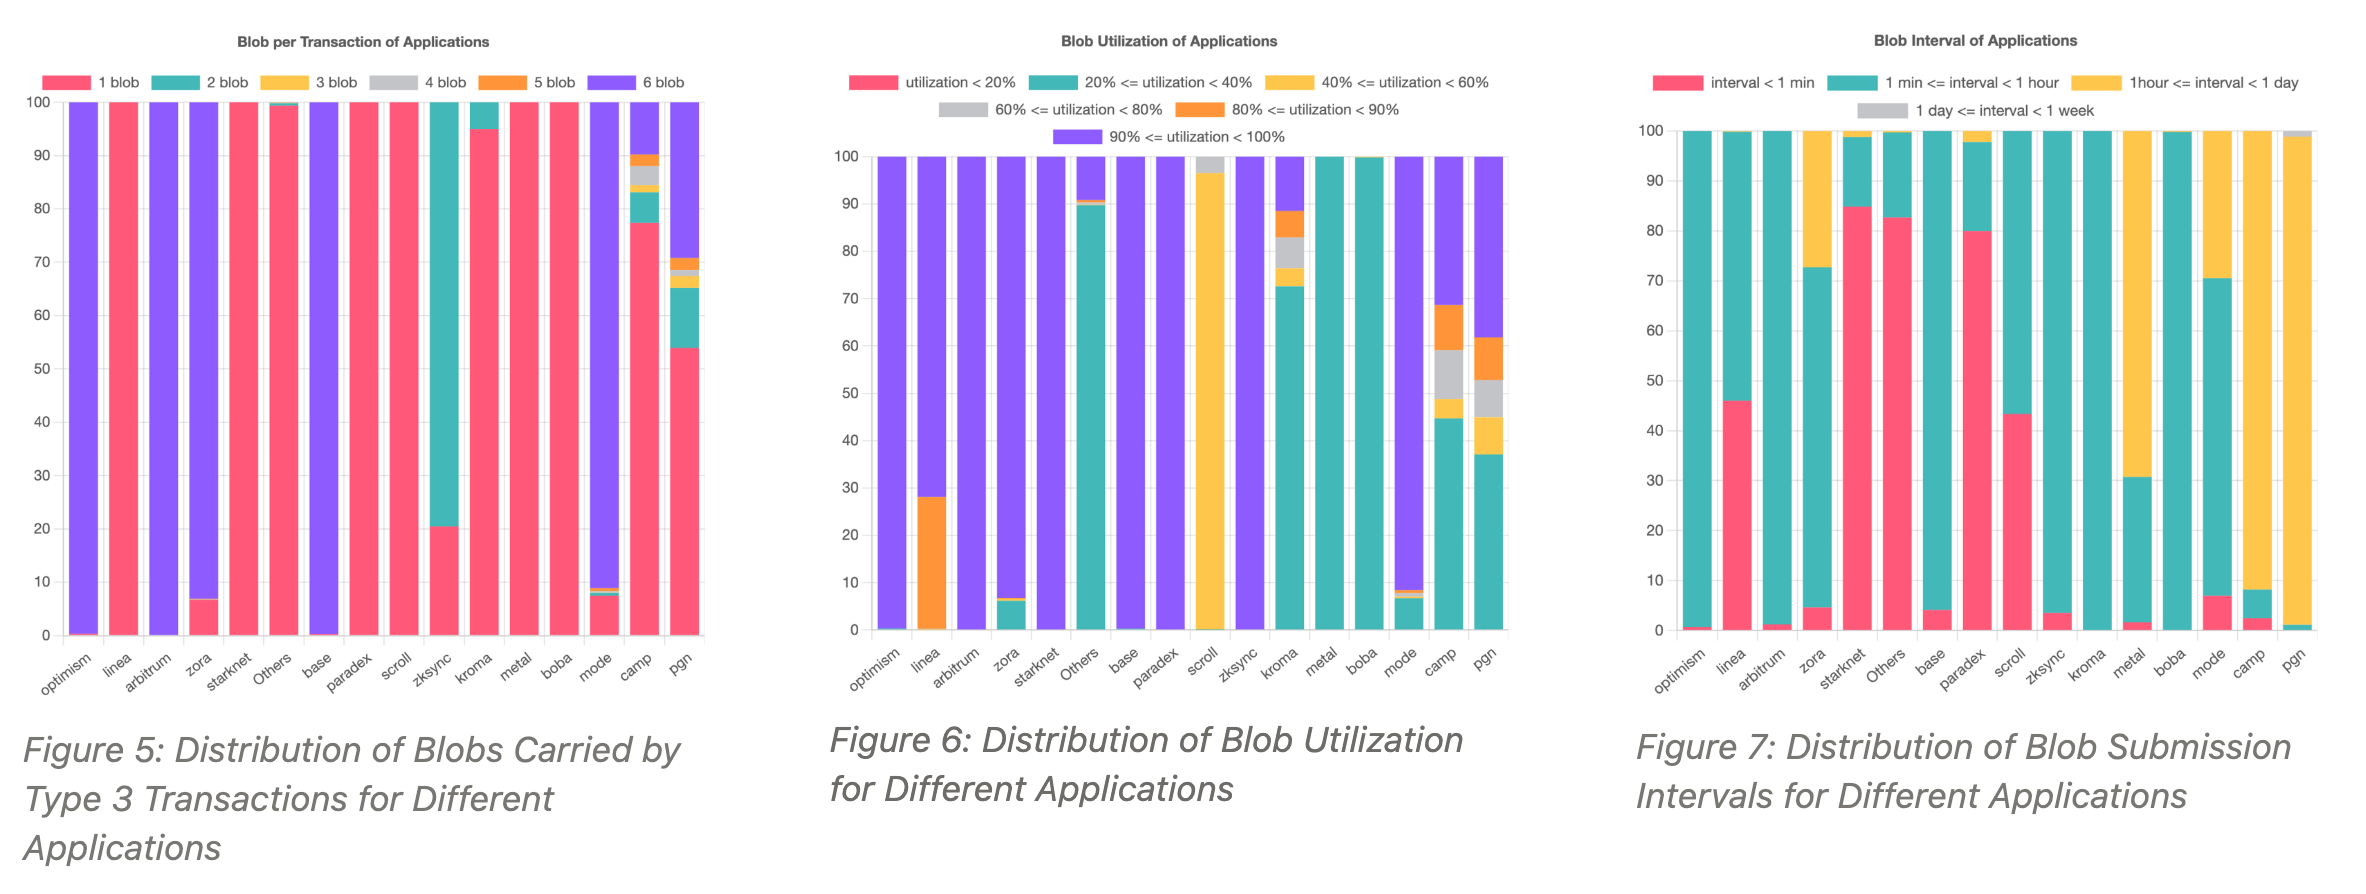
According to Figure 5 (Others ), 1 blob can meet the needs of most non-rollup applications.
-
According to Figure 6 (Others ), the blob utilization is concentrated between 20% and 40%, indicating that non-rollup applications generally cannot fill the blob, with the data size mainly between 25.6 kB and 51.2 kB.
-
According to Figure 7 (Others ), about 83% of blobs have a submission interval of less than 1 minute, indicating a relative high frequency of user demand for non-rollup applications.
In summary, the type 3 transactions for non-rollup applications can be characterized as: high-frequency transactions carrying 1 low-utilization blob .
The essence of this characterization is that non-rollup applications are driven by immediate needs and are less concerned about the fee cost per data byte compared to rollup applications.
This characterization allows for the identification of non-rollup applications, which in turn helps design mechanisms to limit blob abuse by non-rollup applications.
Is Using Blobs Always More Cost-effective than Calldata?
Introducing feeRatio to measure the relative advantages of the two solutions:
- When
feeRatio≥ 1, it indicates that using blobs as a data availability solution is not worse than calldata. - When
feeRatio< 1, it indicates that using blobs as a data availability solution is worse than calldata.
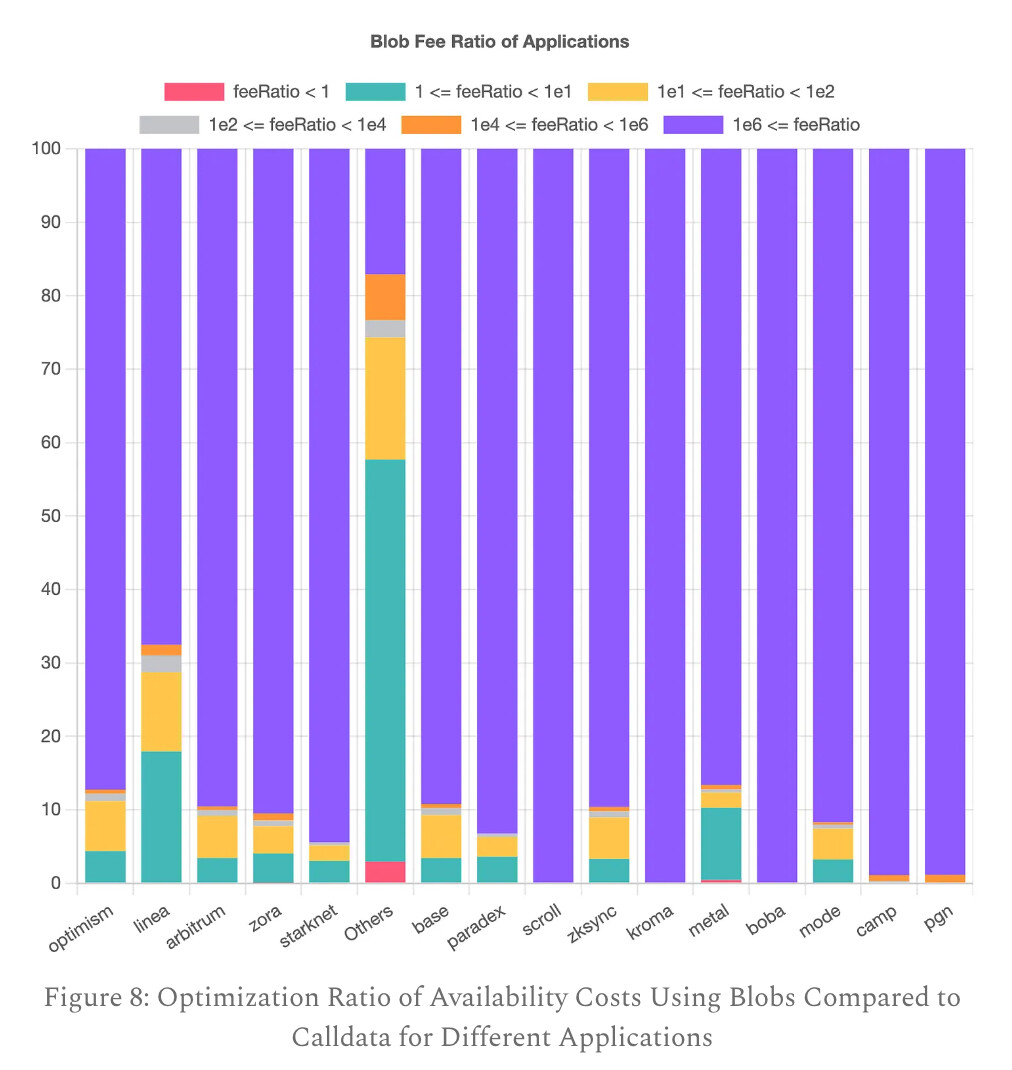
Figure 8 also shows a few cases where feeRatio < 1 (red), indicating that calldata is more cost-effective than blobs:
- Mostly in non-Rollup applications (Others):
- Non-rollup applications generally do not care about the cost differences between blobs and calldata; they care about using blobs itself, such as in Blobscriptions.
- A few in Metal rollup:
- Rollup application Metal seems not to have considered switching between blobs and calldata in its strategy, leading to suboptimal choices in some extreme cases.
- Extreme cases are mainly due to Metal’s low blob utilization (see Figure 6) coinciding with a spike in blob gas prices.
- However, given that extreme scenarios are rare and maintaining two data availability solutions is costly, Metal’s suboptimal strategy in extreme cases seems acceptable.
The analysis of blob and calldata solutions in this section only considers fee costs and not delay costs. Considering delay costs, calldata has an actual advantage.
Blob Gas Price and Blob Usage Strategies
Analysis of Blob Gas Price Fluctuations
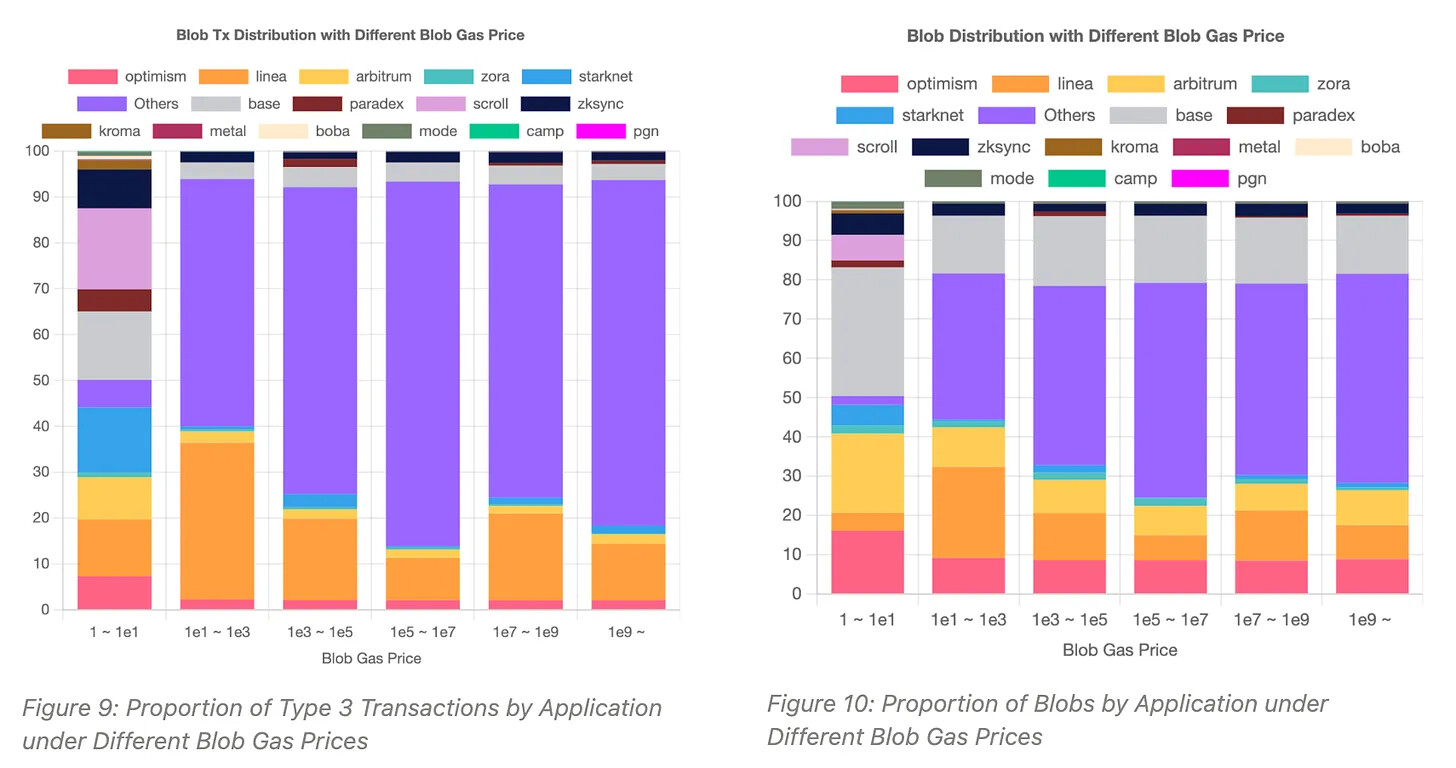
Figures 9 and 10 show that in scenarios of high blob gas prices (> 10), the proportion of non-rollup applications (Others) is significantly higher than in scenarios of low blob gas prices (< 10).
Therefore, it can be concluded that the surge in blob gas prices is mainly driven by the demand from non-rollup applications, rather than rollup applications. Otherwise, the proportion of rollup and non-rollup applications should remain stable.
How Rollups Respond to Blob Gas Price Fluctuations
Hypothesis 1: The higher the blob gas price, to reduce fee costs, applications should carry more blobs in type 3 transactions, i.e., the number of blobs should be positively correlated with blob gas prices.
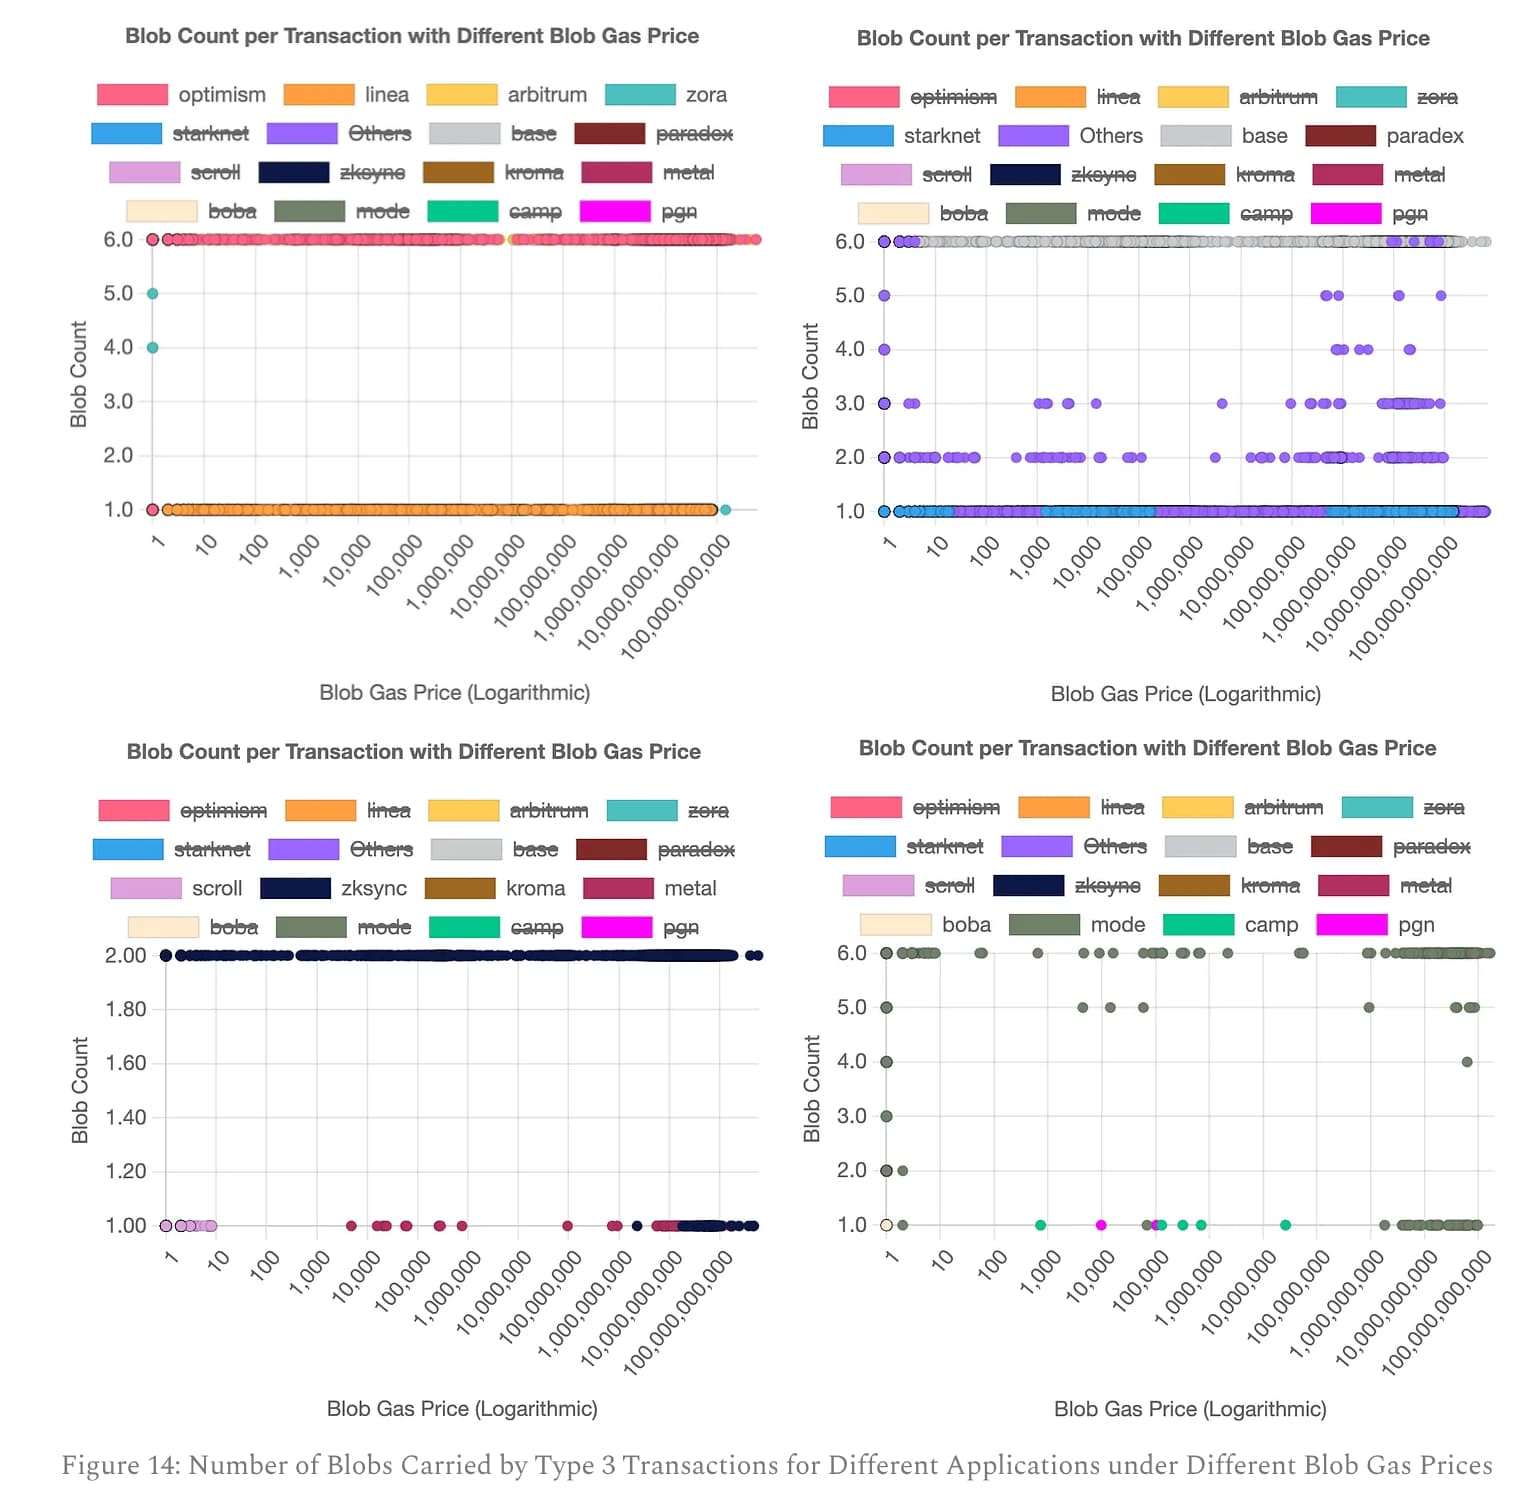
Figure 14 shows that the hypothesis does not hold.
Hypothesis 2: The higher the blob gas price, to reduce fee costs, applications should increase blob utilization, i.e., blob utilization should be positively correlated with blob gas prices.
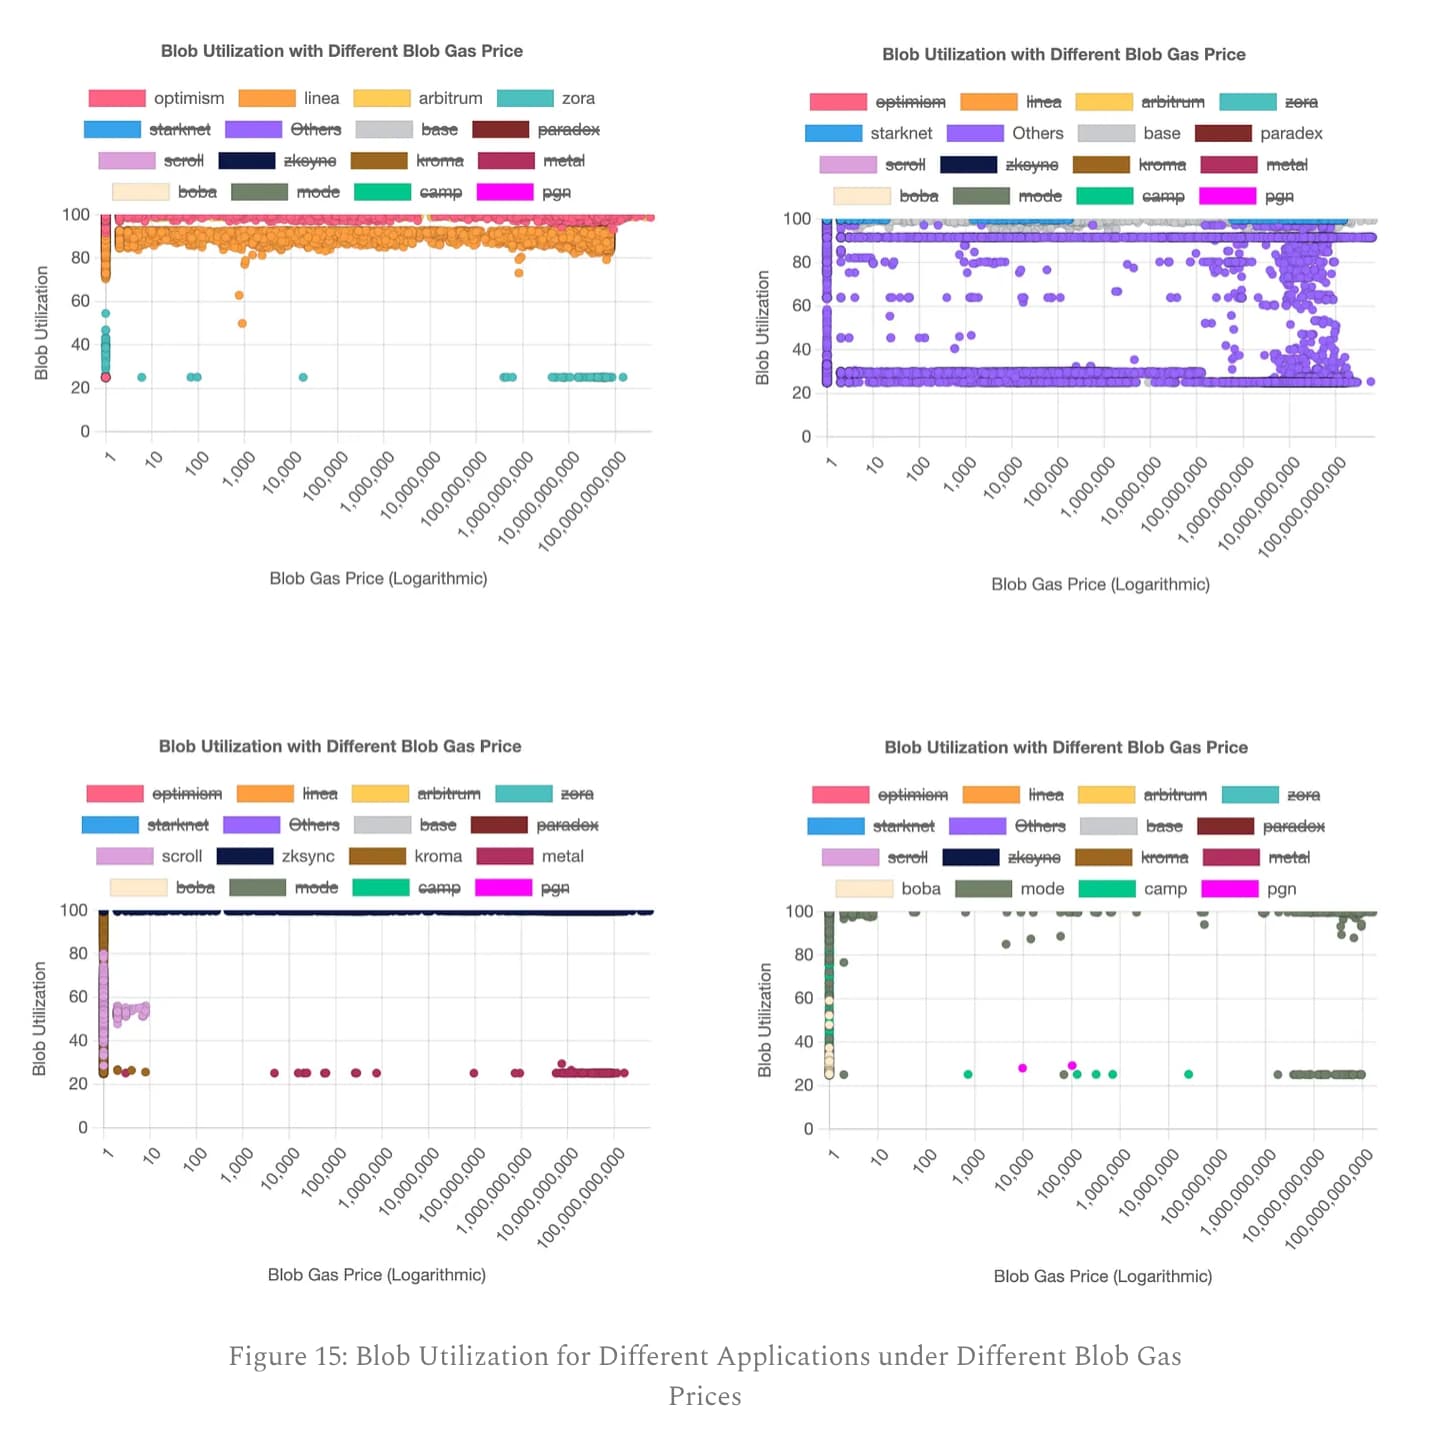
Figure 15 shows that the hypothesis does not hold.
Hypothesis 3: The higher the blob gas price, to reduce fee costs, applications should delay blob submissions, i.e., blob submission intervals should be positively correlated with blob gas prices.
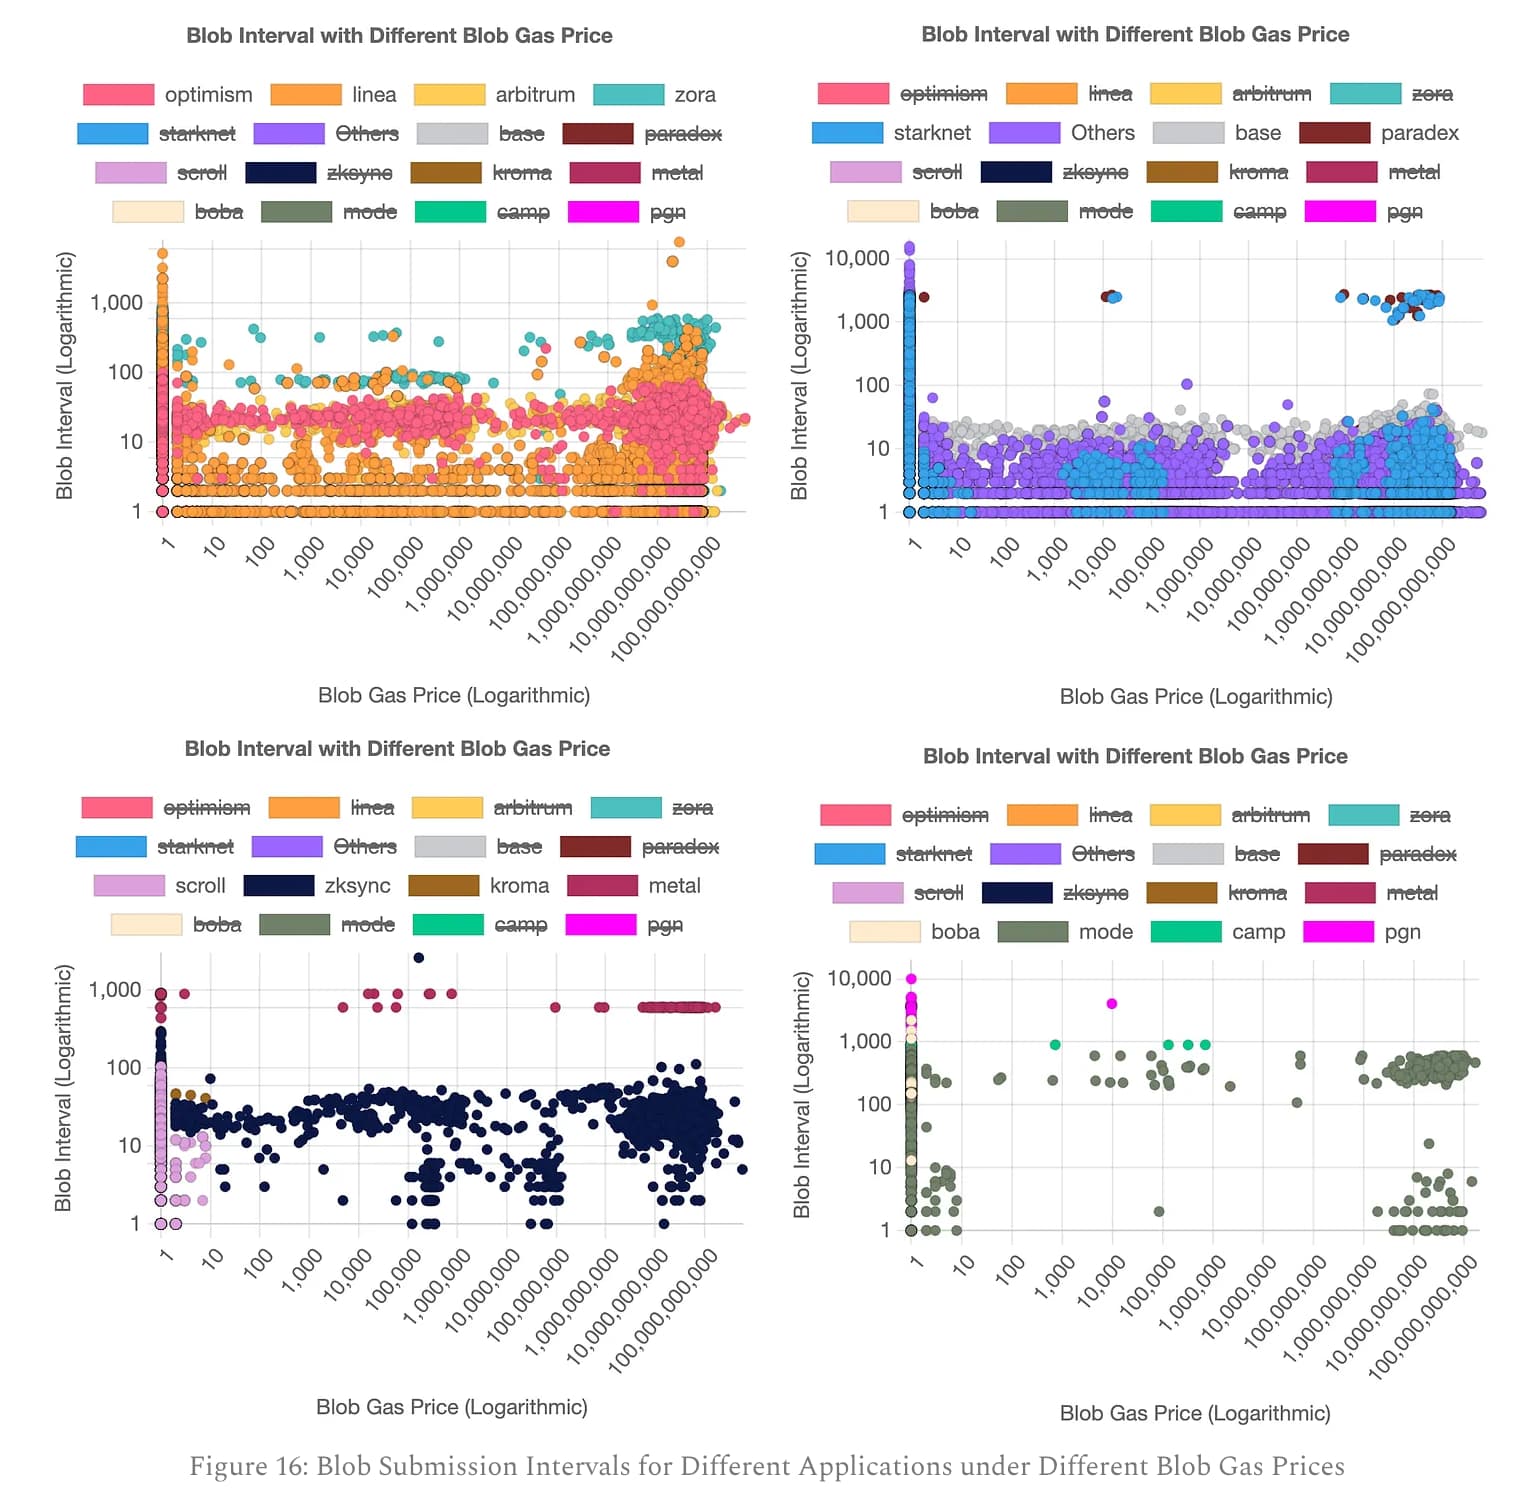
Figure 16 shows that the hypothesis does not hold.
In Figures 9 and 10, readers might notice that some rollup applications seem to respond to high blob gas prices. Scroll seems to suspend blob submissions under high blob gas prices. However, this conclusion is incorrect. The reason is that not all rollups immediately used blobs after the EIP-4844 upgrade.
Blobs and Block Reorg
From the Decun upgrade to May 22, there were 171 type 3 transactions included in the forked blocks and 348,121 included in the canonical blocks. Therefore, the proportion of type 3 transactions being forked is approximately 0.049%. This section explores the relationship between block reorg and blob.
Blob Number Distribution in the Canonical and Forked Blocks with Blobs
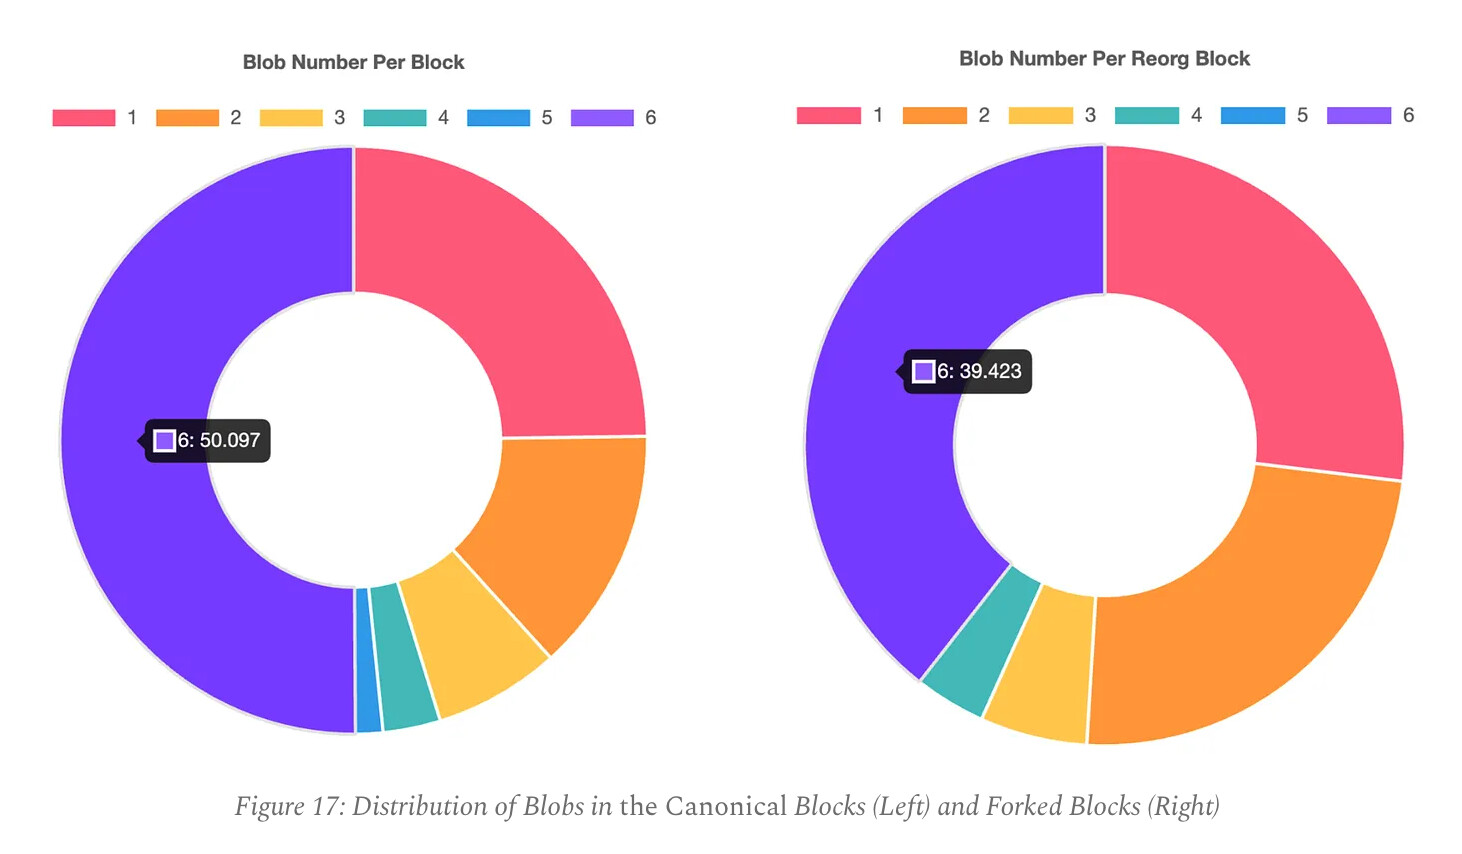
Hypothesis: More blobs increase the probability of block reorganizations.
If the hypothesis holds, the following inequality should be satisfied:
According to Bayes’ theorem, inequality above is equivalent to:
We check whether the actual data satisfies inequality and obtain the following table:
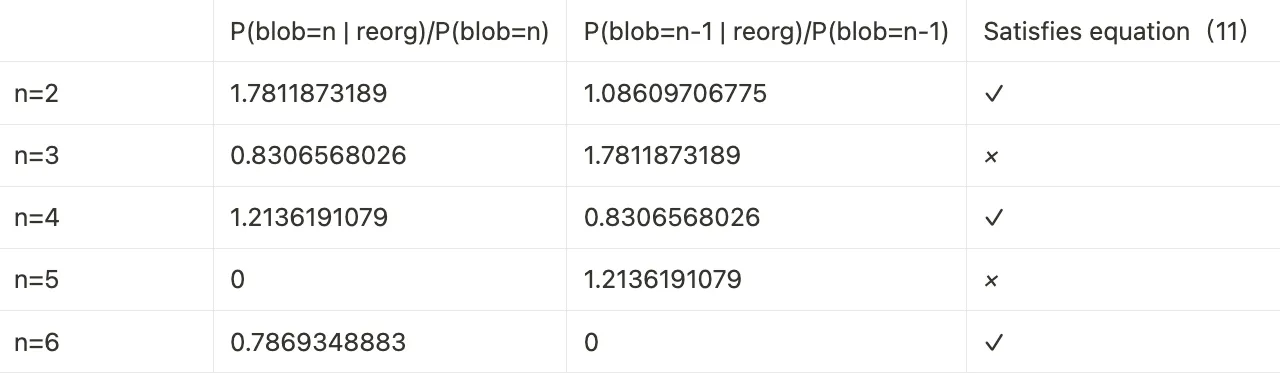
The table above shows that equation (10) does not hold for all n. Therefore, the hypothesis does not hold, indicating that more blobs are not significantly related to block reorganizations.
Distribution of Type 3 Transactions and Blobs by Applications in the Canonical and Forked Blocks with Blobs
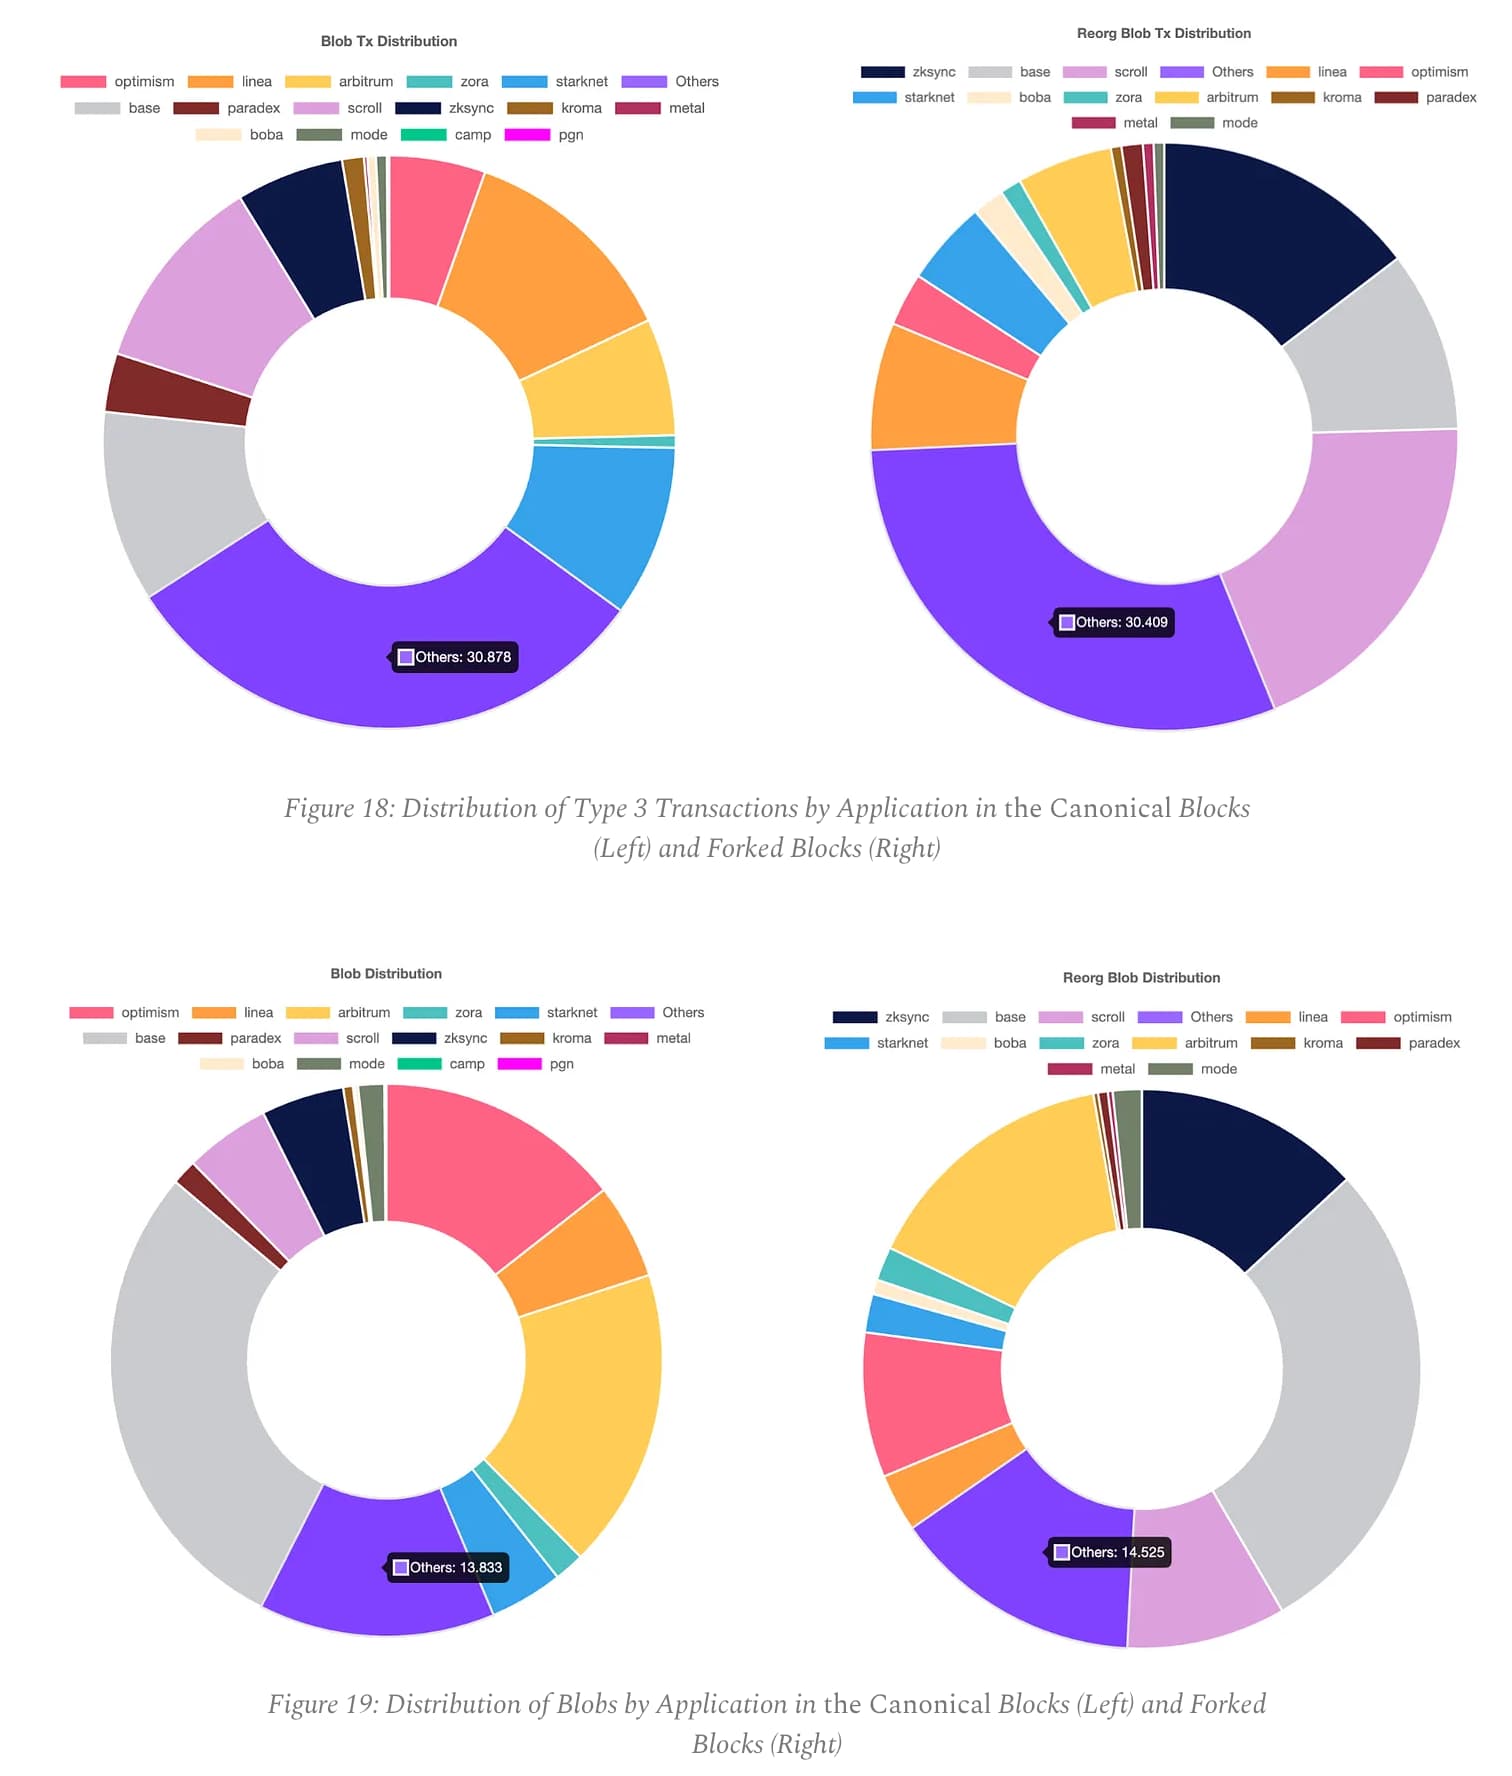
Figures 18 and 19 show that the proportion of type 3 transactions/blobs for Zksync and Scroll in forked blocks is significantly higher than in the canonical blocks.
Applications seem to have some connection with block reorganizations, possibly related to differences in blob usage strategies by applications:
- Zksync and Scroll are less strategic in selecting the timing of submitting type 3 transactions, targeting block heights prone to reorganization.
- The unique characteristics of Zksync and Scroll’s type 3 transactions make the blocks containing them more likely to be reorganized.
Clustering Phenomenon of Forked Blocks with Blobs
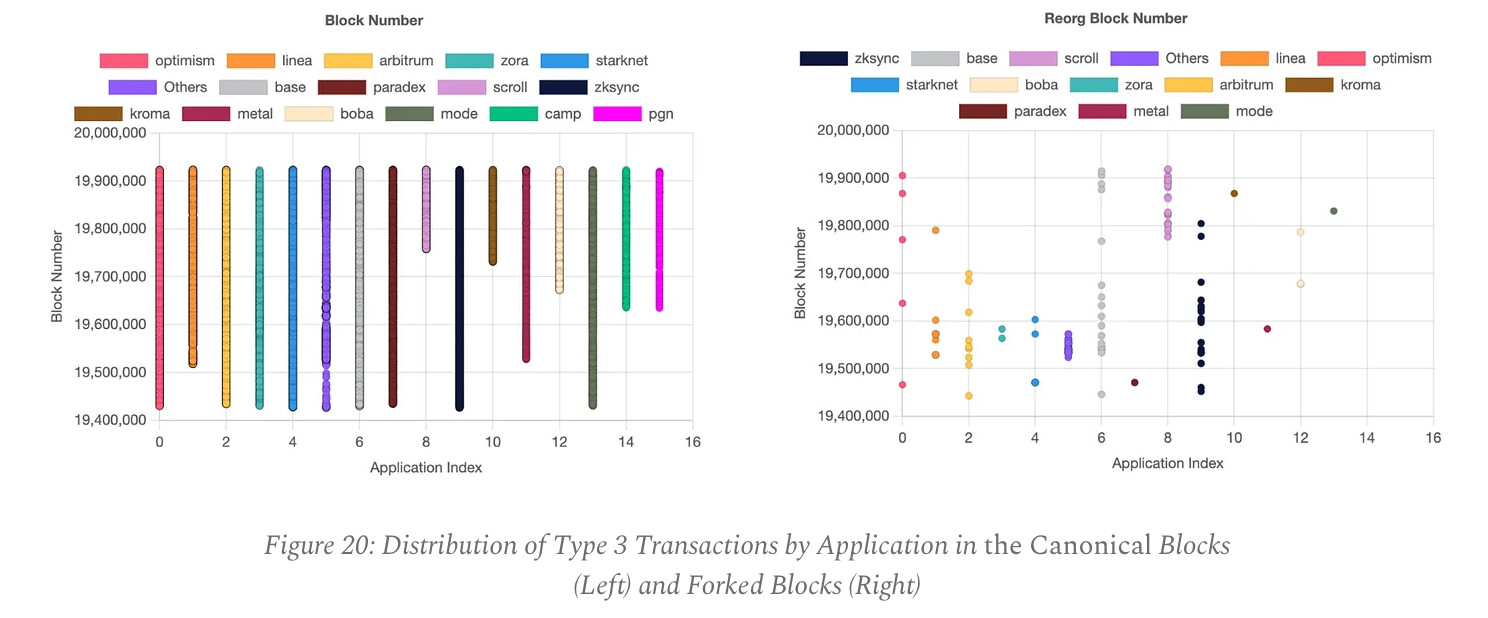
If each block has the same probability of being reorganized, the forked blocks should be evenly distributed across the block height range. However, Figure 20 shows a clustering phenomenon in block heights for forked blocks, possibly related to network conditions.
In addition, the clustering phenomenon that occurs in block reorganization seems to be somewhat related to the applications that submit blobs. For example, type 3 transactions for non rollup applications are only included in forked blocks between 19500000 and 19600000.