Link to working draft (includes feedback from @vbuterin in the bottom)
Casper FFG: Macroeconomic Participation Constraint
tl;dr Given non-zero chance of losing deposits, we can’t assume people will participate as long as yield is positive. To quantify the threshold at which a validator may participate, we make an explicit participation constraint framework. Before diving into game theory, we explore and define the macroeconomic constraints and how that may affect the incentives for the entire validator set on average. Any reward and penalty shape optimization or security parameters that are not in the realm of this analysis has limited significance as this is a key driver of both the global constraints of the network as well as the the pro rata deposit yield as a function of total deposits.
takeaways: [~15% ( \pm 5%)] annualized net yield would be a compelling starting point for discussion. This will be bound by a [~0.5%] gross issuance rate, which bounds the “total deposit capacity” at 6.7% of market capitalization, which is about $2B today (at $30B cap). Any deposit level below that would increase the yield (e.g. $0.2B → 150% annualized net yield), providing strong incentives for joining the validator network. (Those parameters above can be tuned depending on our economic security needs).
Context
A common failure mode in cryptoeconomic analyses will be to take for granted that people want to participate in your mechanism at all (especially while including draconian penalties for bad actors). The unexplored tradeoff there is that many honest/good validators may not be incentivized to validate at all due to the risk of losing part (or all) of their deposits.
This analysis in theoretical microeconomics is referred to as a participation constraint analysis. A participation constraint tries to measure if actors will benefit (or at least not be worse off) from participating in a given mechanism.
More specifically, for yield functions Y(p_v, ESF, TD) and N(p_v, ESF, TD) (for having voted or not in a checkpoint), this analysis explores \frac{dYield}{dTD} and whether that is compelling enough for validators to participate.
In general, we should have an intuition for how enthusiastic people will be about validating. Out of a 100 miners or Ethereum users, how many people will be willing to validate? This will be a large driver of total deposits, the centralization level and even potentially the % of bad actors.
The rewards in excess of the participation constraint is the exact margin of safety a mechanism has to enforce additional security measures (i.e. penalties) for bad actors. The margin also compensates for the friction of getting started in a new process to begin with (i.e. “activation energy”). Therefore, even before beginning to shape the specific shapes of the reward and penalties for each type of situation and actors, we must engage in an macroeconomic analyses of a participation constraint for a given validator set (future work will explore game theory among a heterogenous set of validators with various levels of centralization). In other words, is the overall amount of rewards going to be worth the average cost of joining the network as a validator (i.e. risk and illiquidity)?
Framework
# constraint
(Net profit from participation) > (Opportunity Cost)

# rational model
(Net profit) - (opportunity cost) > 0

# behavioral model
(Net profit) - (opportunity cost) - (activation energy) > 0
Opportunity cost is yield of comparable assets classes in risk & liquidity level.
[Activation energy is a proxy that captures the idea that given two asset classes with similar volatility and liquidity, people will prefer the well-known / more familiar asset class. It’s a proxy for all other risk outside of the traditional asset pricing (i.e. “PoS validation is a new process” rather than “PoS validation yields 8% returns”). Therefore the new asset class has to have excess returns to have parity.].
Method
Reverse engineering net profit, incremental issuance and “total deposit capacity”
- Figure out what the risk of loss and illiquidity are for Casper validation.
- Figure out what the opportunity cost for required return is for the given risk/liquidity profile
- TODO: Figure out how much more we can provide as a premium (to get over the hump of other activation thresholds etc)
- Determine the impact of that on the Ethereum economy will be (issuance level and margin of safety vs ideal threshold)
Opportunity Cost Range
Let’s assess opportunity cost to “reverse engineer” the appropriate yield range.
Opportunity cost is defined by the yield of an asset with comparable risk (chance of losses) and liquidity. Required returns go up as they have higher risk of loss and become more illiquid.
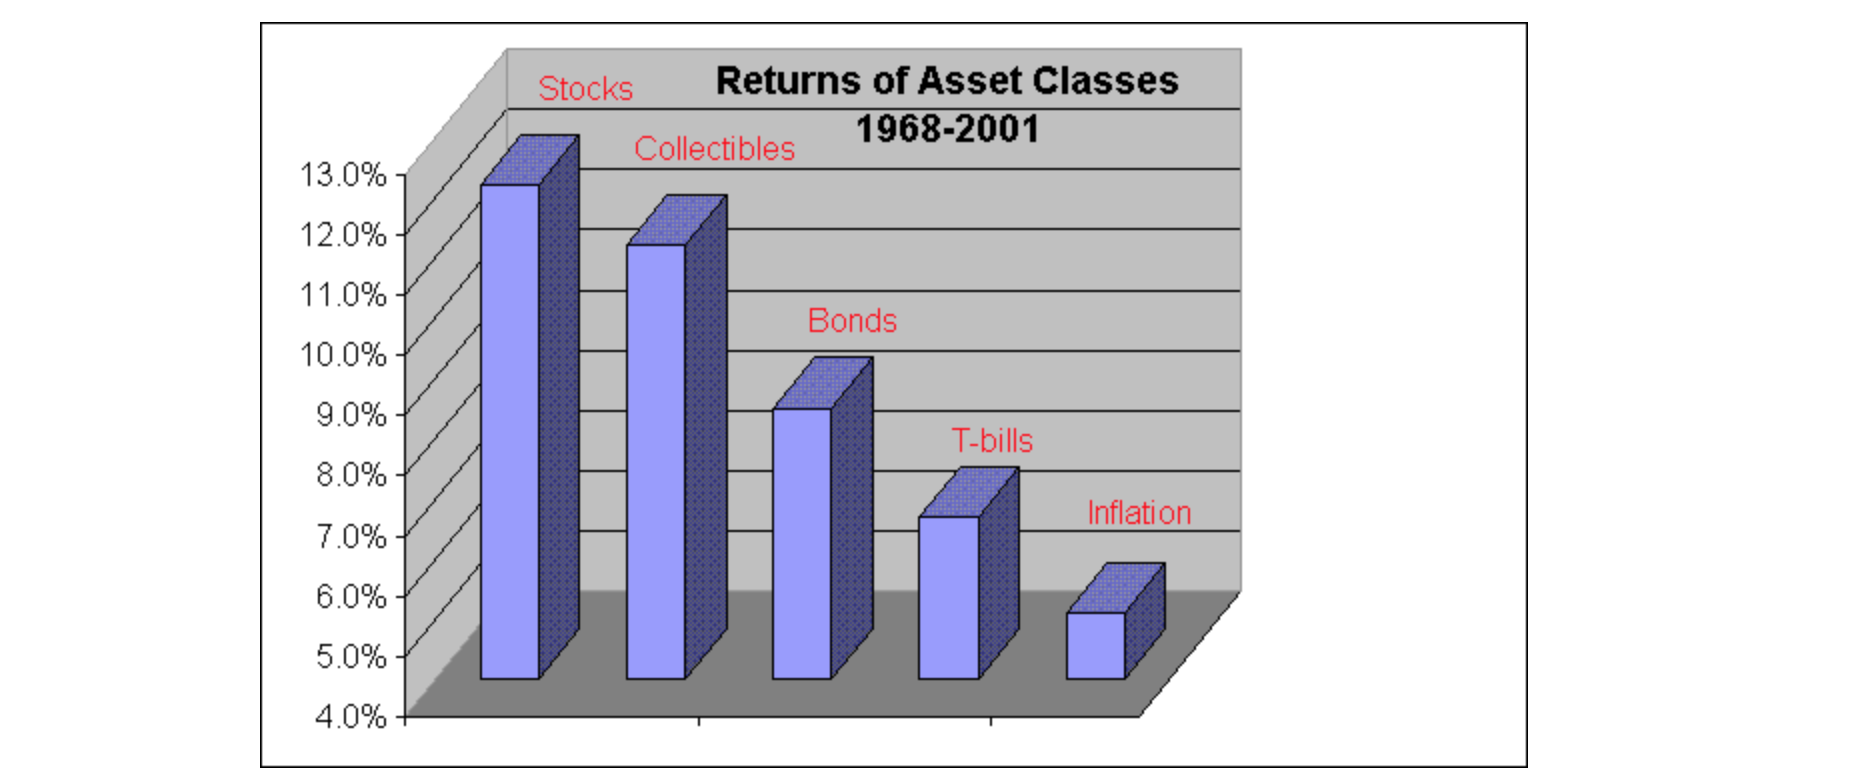
Cost of capital is a spectrum of risk and reward
- Inflation (1%)
- Treasuries (2%)
- Secured mortgages (4%?)
- Corporate bonds (5%?)
- Sofi personal loans (6-7%?)
- US equities (8%?)
- High yield bonds (6-10%?)
- Real estate (9-12%?)
- Private equity, HF, VC (20%?)
- Crypto (multiples)
These rates are optimized over decades with self-correcting market mechanisms. [Therefore, regardless of the state of whether validating is a “securitized asset,” these define the market’s appetite for risk/reward.] For any given overall reward pool amount, the amount of total deposits will rise and fall to reflect an implicit “risk assessment”. For example, if the yield is too low, people will sell the asset and the price will fall, which will increase the yield (fixed) and vice versa.
So the question then becomes, what sort of risk of loss and illiquidity constraints most likely represent the risk level of an Ethereum validator?
Two approaches to assess Risk & Return
- Current risk and illiquidity → Define necessary rate of return
- Liquidity: 4 month lock up
1. Less liquid than stocks, more liquid than real estate - Risk: potential of losing [20%+] (group penalties when under attack)… non-zero chance of slashing the whole deposit
1. Riskier than equity, but not as risky as venture? - Rate of return → Define risk and illiquidity
- At 5%: very liquid and low risk of loss
- At 10%: need to be relatively liquid and have equity level volatility
- At 15%: can start locking up with liquidity and have non-trivial risk of loss
- At 20%+: maximal lockup and flexibility to slash with high-volatility
Assessing Penalty, Illiquidity, and Required Returns
Illiquidity
4 month withdrawal period puts it some where in between stocks/ETFs/tokens (very liquid) and real estate, HF investments (multi year lock up)
- This would suggest ~12-15% yield. (Between 8%-20%)
Penalty
Group penalty (i.e. out of the validator’s control): [~20% annually?]
Possibility of being slashed (if there’s a validator client bug for example) (100%-50%-25%)
This is a high chance of loss and will require things to yield on the higher end of it’s range.
Summary
So perhaps, high range of the 12-15%: 15% is a good rough starting point for required return for participation. (We will later examine the macroeconomic model to determine how much inflation is required at various validator total deposit levels and whether that is beneficial & sustainable for the ecosystem)
Issuance
Etheruem Current Issuance Levels
Currently 14.75% inflation rate. Heading down to 10% by 2020. Terminal inflation rate at 1-2%. (source).
PoS Issuance Levels
https://twitter.com/vitalikbuterin/status/879858608091144193
If partial tx fee burning is net [-0.5-1%] effect, it appears that [0.5%-1%] issuance for Casper is a reasonable starting place for optimizing issuance levels.
Total Deposits and Total Deposit Capacity
TD ~ Gross Yield
This is a huge factor because having more increases security but also lowers yield. Therefore, any reward scheme and target required return will have an implicit target total deposit rate. (or vice versa).
- For example, at 1% incremental inflation/issuance and 15% target return and no appreciation: $30B*1% = $300M in available rewards / 15% = $2B in total deposits (~6.7% of market cap… huge).
- Thought experiment: If reward pool is fixed (and other variables are fixed too), and there are only $200M in total deposits, annualized returns would be 150% (!) (this starts to behave like a fixed income asset / bond)
- at 0.1% incremental inflation/issuance and 20% target return and no appreciation: $30B*0.1% = $30M in available rewards / 20% = $0.6B in total deposits (~2% of market cap).
- Thought experiment: if there are only $0.1B in TD, annualized returns would be 120%.
Bounding TD
- There should be a minimum stake to secure the network. (future work)
- “How much damage could you do if you own the entire validator set?”
- There exists a maximum: either as (1) a % of the market cap (i.e. it would be unhealthy for [50%] of all ether to be locked up for validation) or (2) implied yield (i.e. at a any given inflation level for reward pool, the yield cannot go below US equities or high yield bonds unless liquidity and risk fall below those).
Summary
As we create a mechanism where significant loss of principal (deposit) is possible, we need to rigorously analyze the participation constraint. Otherwise, we may have a theoretically economically secure mechanism that drives away risk-averse good actors and end up with a disproportionate % of bad actors in the validator set–compromising the security of the network.
We explore various opportunity costs in existing asset classes to assess how the market currently rewards various levels of risk and liquidity. We use that discrete curve to approximate a minimum opportunity cost for this mechanism ([~15%]). We build on that by adding on gross incremental issuance that will be “financing” the validation process, which implies a “total deposit capacity” or the max TD that can yield at least the opportunity cost. A lower level of deposits (while TD is growing)–at the same level of issuance with the same opportunity cost–provides a higher yield and a strong incentive for validators to join the system. In other words, the mechanism can have a reward that is significantly higher than the participation constraint (e.g. yield starts at ~50% at lower TD thresholds and asymptotically approaches the ideal target yield of ~[15]%).
This analysis can provide the foundation for macroeconomic constraints in the system and define the security thresholds that the network can tolerate. As we continue to define griefing factor analysis and oligopolistic analyses, we can return to confirm or reassess these these assumptions in light of new insights, but it is imperative to realize that validators have a choice in participating. And while some validators may altruistically join to support Ethereum, that is a fragile assumption for building economic security. To the contrary, we should always hope to have incentives in excess of the participation constraint as a margin of safety.