The following report, aims to be a collection of data that will hopefully be a resource that will help ACD to take a decision over EIP-7907.
Also, this hopefully sets a new methodology of backing up EIPs or proposals with as much data as possible, which can definitely help taking better and more informed decisions when scoping forks.
*I want to thank @rjl493456442 for his PR adding metrics in Geth and his advice and support during the benchmark collection which has been extremely helpful. And which I’d like to standarize eventually across all clients such that we can compare data easily and collect data easily to inform our decisions on repricings and scaling.
Finally, it’s important to highlight that Geth is severely underperforming due to the totally disabled cache (which also affects pre-warming). Notice that in a real-world scenario, even this benchmarks would be better. The intention is getting the worst-possible case such that if we’re good under it, we can skip 7907 repricing straight away.*
Related Issue:** EIP-7907
Date: 2026-01-13
Benchmark Environment: Geth (dev mode) with mainnet-sized database (~24M blocks), internal caches disabled
Test Configuration: ~18,106 EXTCODESIZE operations per block (all different bytecode contracts), ~50M gas
Hardware: WD Black SN850X NVMe (8TB)
Executive Summary
This report analyzes the performance of the EXTCODESIZE opcode when reading contracts of varying bytecode sizes (0.5KB to 64KB) with Geth’s internal code cache disabled. This represents the worst-case attack scenario where an attacker deploys thousands of unique contracts to force cold disk reads.
The iteration also has the lowest overhead possible leaveraging CREATE2 deterministic address generation.
More information regarding this can be found in:
- feat: add extcodesize_setup scenario for deploying EXTCODESIZE benchmark contracts by CPerezz · Pull Request #161 · ethpandaops/spamoor · GitHub
- https://github.com/ethereum/execution-specs/pull/1961
Key Findings
| Finding | Value |
|---|---|
| Code read time range | 107ms - 904ms (for ~18K code reads) |
| Per-call latency range | 5.9µs - 49.9µs |
| Code read time scaling | 8.5x growth (0.5KB → 64KB) |
| 64KB block execution time | ~1006ms |
| Code read % of block time | 51% (0.5KB) → 90% (64KB) |
| Geth efficiency vs raw NVMe | 24-51% |
EIP-7907 Verdict
| Size | Block Time | % of 1s Budget | Verdict |
|---|---|---|---|
| 24KB (current) | 535ms | 54% | Safe |
| 32KB | 685ms | 69% | Safe |
| 64KB | 1006ms | ~100% | Viable at 60M gas |
| 128KB+ | Projected 1.5s+ | >100% | Might need gas repricing, We need more data after BALs + ePBS |
Recommendation: Proceed with 64KB as the new maximum contract size. Beyond 64KB would require new data collection once BALs and ePBS’s optimizations are landed in all clients.
If a repricing was required after the data collection mentioned above, such pricing would also require being able to benchmark the rest of the clients as well as looking to the rest of EXTCODE* opcodes.
1. Methodology & Benchmark Setup
1.1 Test Environment
| Parameter | Value |
|---|---|
| Geth version | v1.16.8-unstable (with lots of hacks) |
| Database | Mainnet synced (~24M blocks) |
| Geth cache | Disabled (forces disk reads) |
| Contract sizes tested | 0.5, 1, 2, 5, 10, 24, 32, 64 KB |
| EXTCODESIZE operations | ~18,106 per block |
| Gas per block | ~50M |
| Deployed contracts | 18,100+ unique contracts per size |
| Iterations per size | 8 |
| Hardware | WD Black SN850X NVMe 8TB |
1.2 Attack Scenario Design
This benchmark represents the worst-case attack against EXTCODESIZE:
- 18,100+ unique contracts deployed per size (forces code cache misses)
- Each block reads bytecode from all unique contracts exactly once
- Code cache hit rate: <2% (effectively disabled)
- OS page cache cleared between benchmark runs
1.3 Raw Disk Baseline (fio)
To establish theoretical maximum performance, we measured raw NVMe capabilities:
| Block Size | IOPS | Throughput | Avg Latency |
|---|---|---|---|
| 512B | 337K | 172 MB/s | 95 µs |
| 1KB | 320K | 328 MB/s | 100 µs |
| 4KB | 272K | 1.1 GB/s | 117 µs |
| 24KB | 171K | 4.2 GB/s | 185 µs |
| 32KB | 155K | 5.1 GB/s | 204 µs |
| 64KB | 85K | 5.6 GB/s | 366 µs |
2. Benchmark Results
2.1 Code Read Time vs Bytecode Size
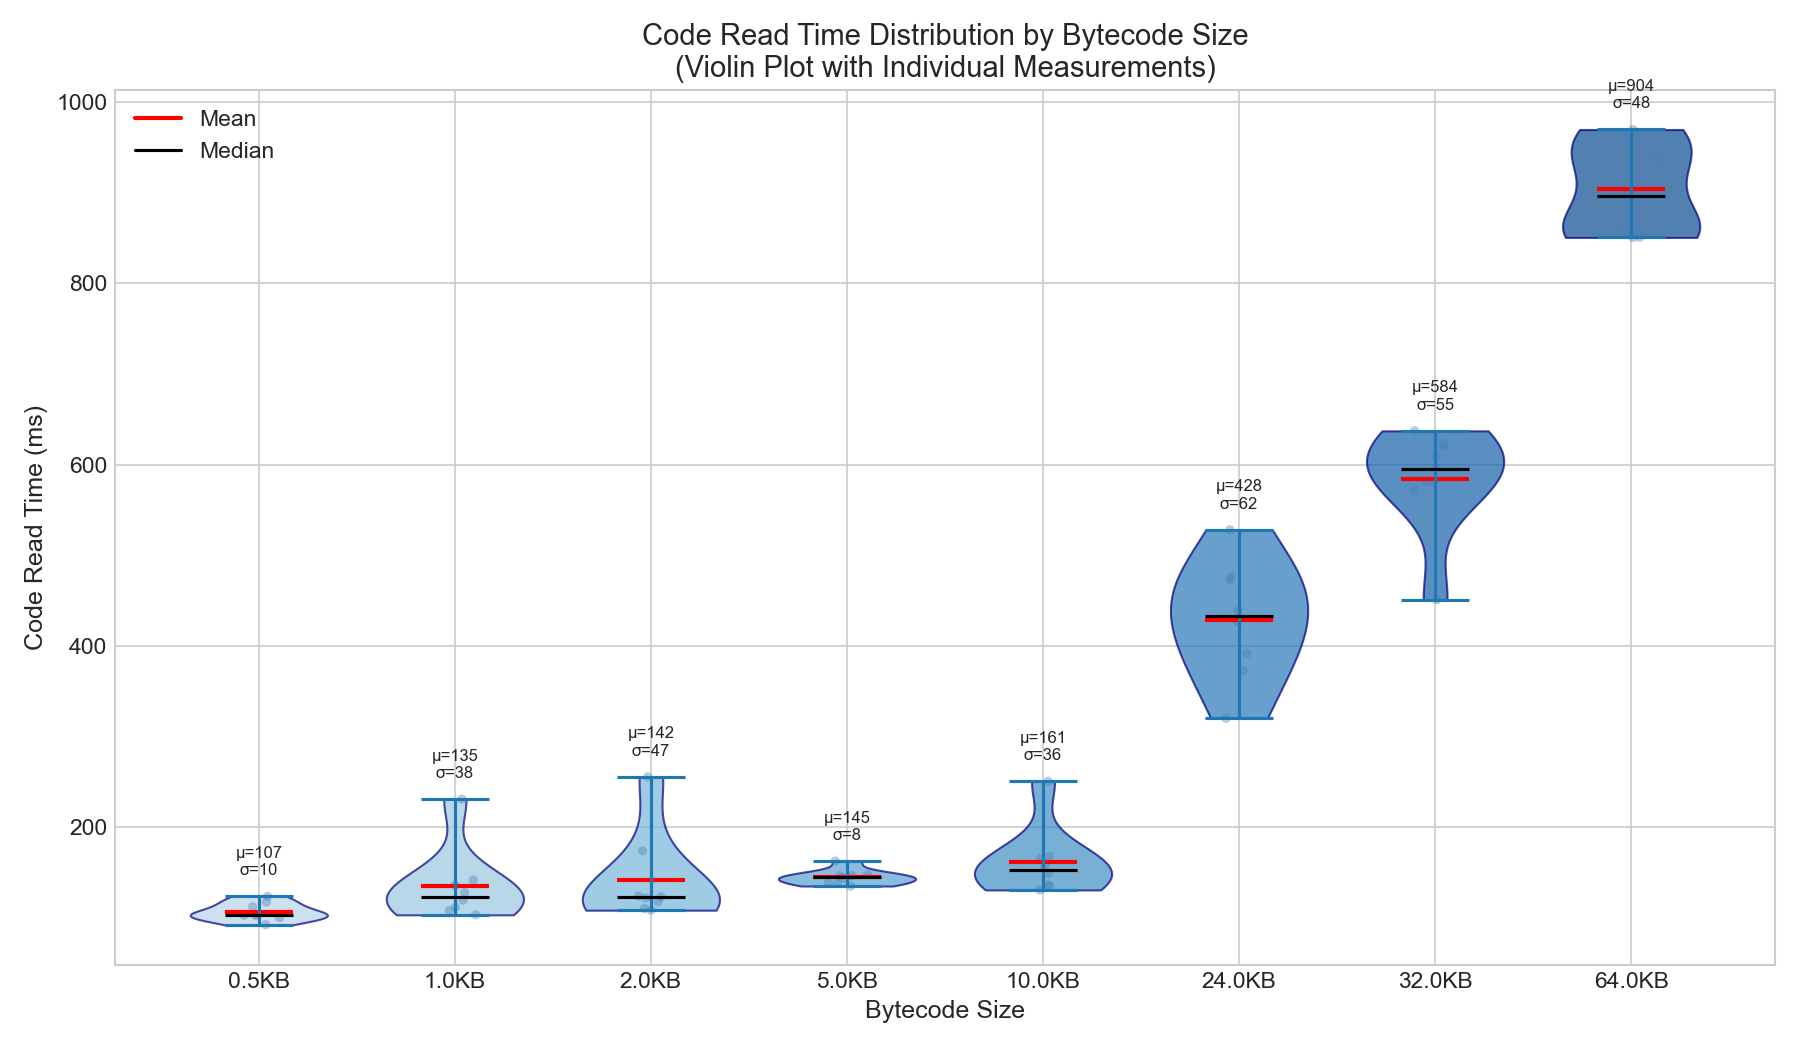
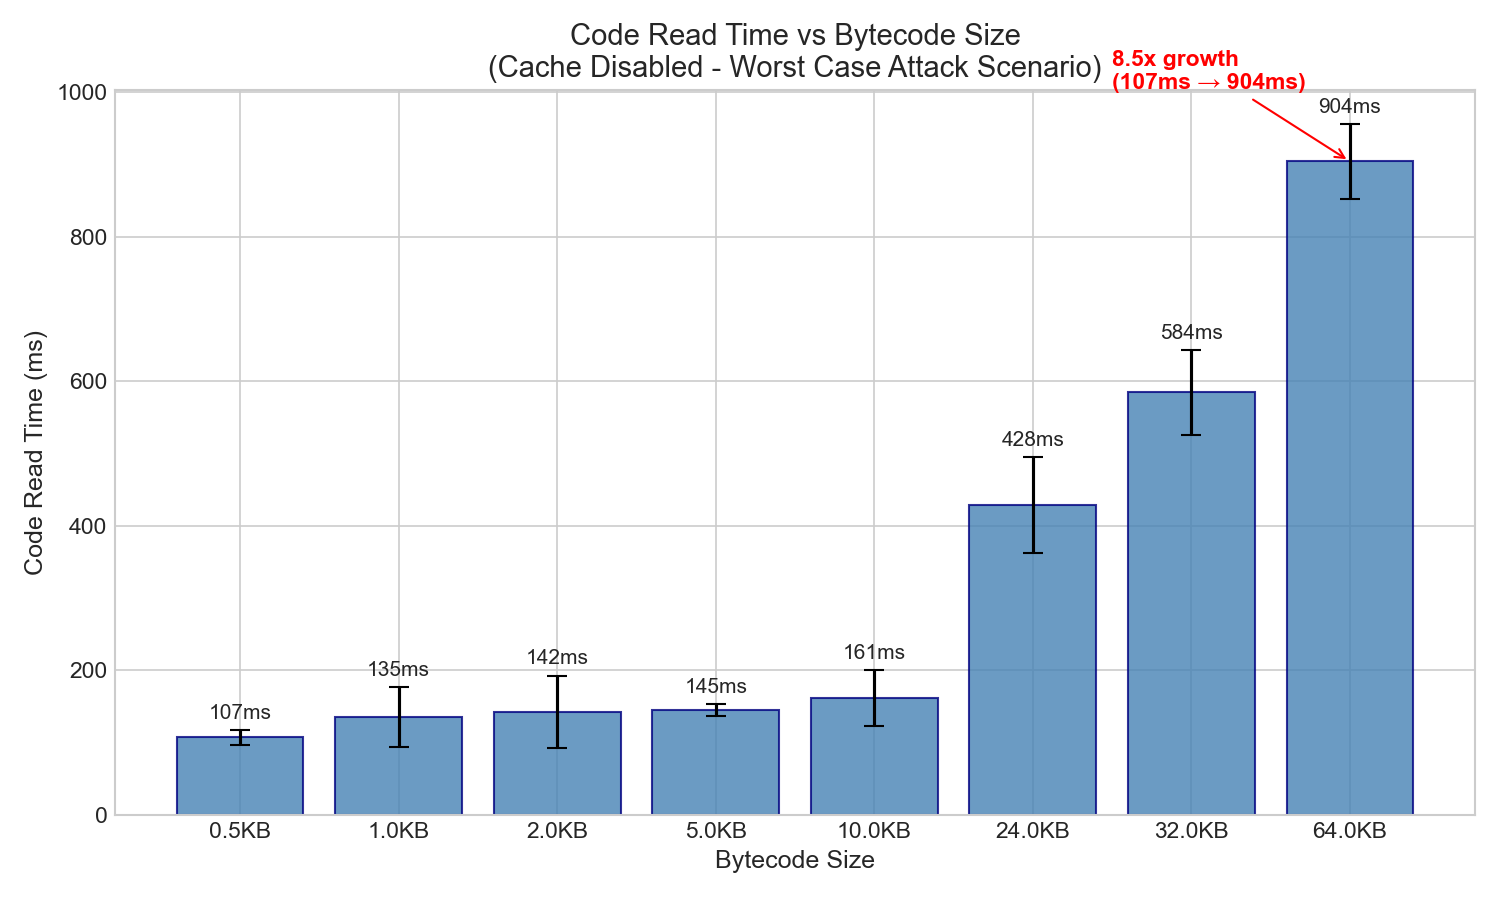
Core Finding: Code read time scales with bytecode size when cache is ineffective.
| Size | Code Read (ms) | Growth vs 0.5KB |
|---|---|---|
| 0.5KB | 107ms | 1.0x (baseline) |
| 1KB | 135ms | 1.3x |
| 2KB | 142ms | 1.3x |
| 5KB | 145ms | 1.4x |
| 10KB | 161ms | 1.5x |
| 24KB | 428ms | 4.0x |
| 32KB | 584ms | 5.5x |
| 64KB | 904ms | 8.5x |
Key insight: Code read time grows 8.5x as bytecode size grows 128x. This is sub-linear scaling (not 1:1), but the absolute time impact is significant.
2.2 Bytes Read vs Code Read Time (Correlation)
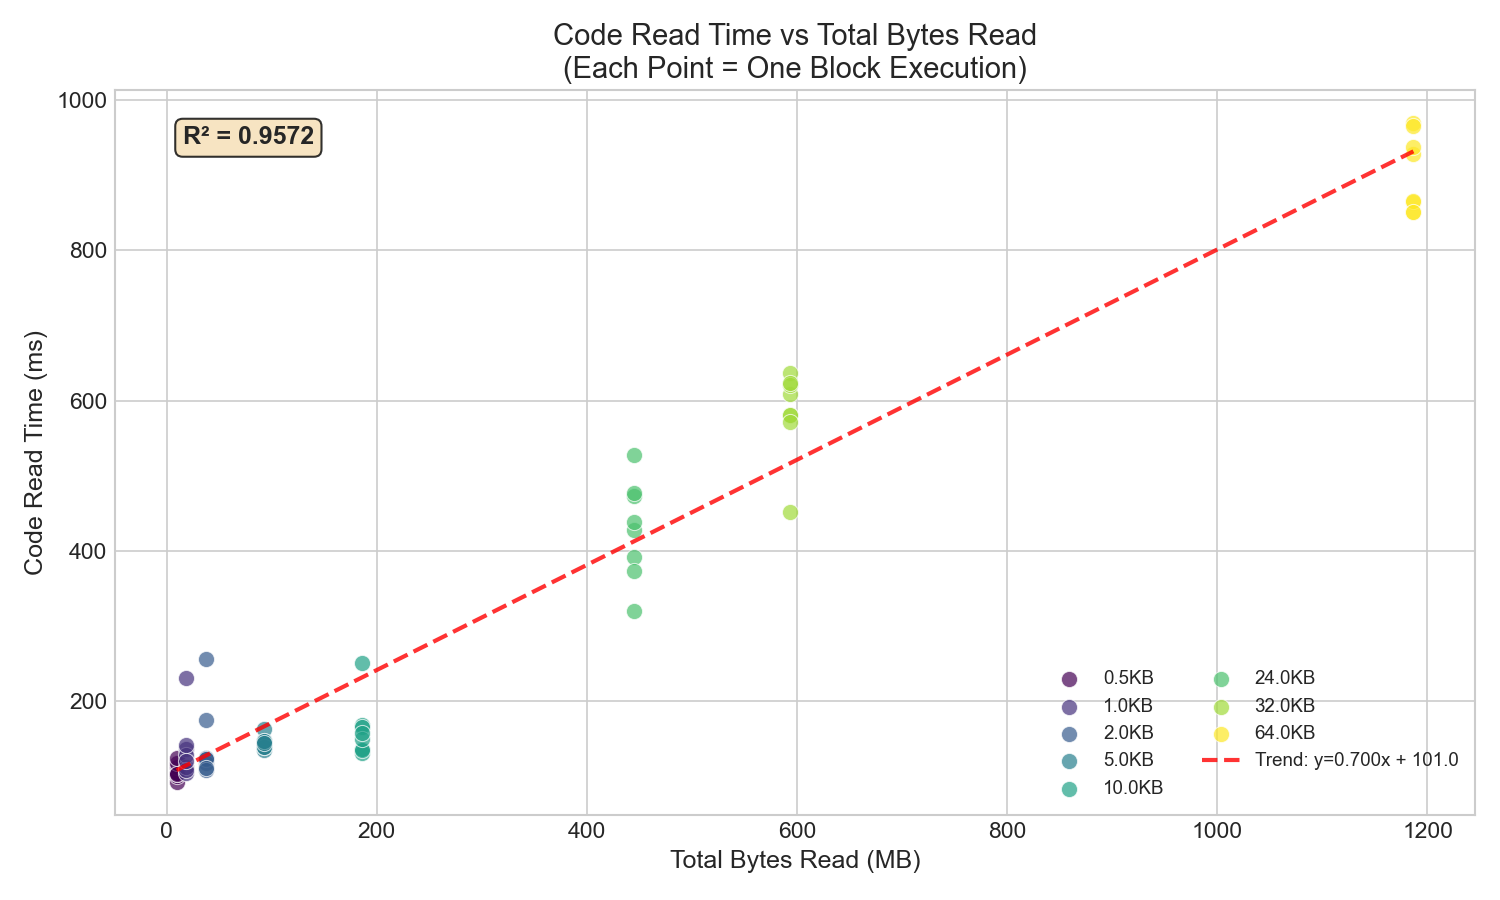
The strong positive correlation (R² ≈ 0.96) confirms that code read time scales with total bytes read when caches are ineffective.
2.3 Per-Call Latency
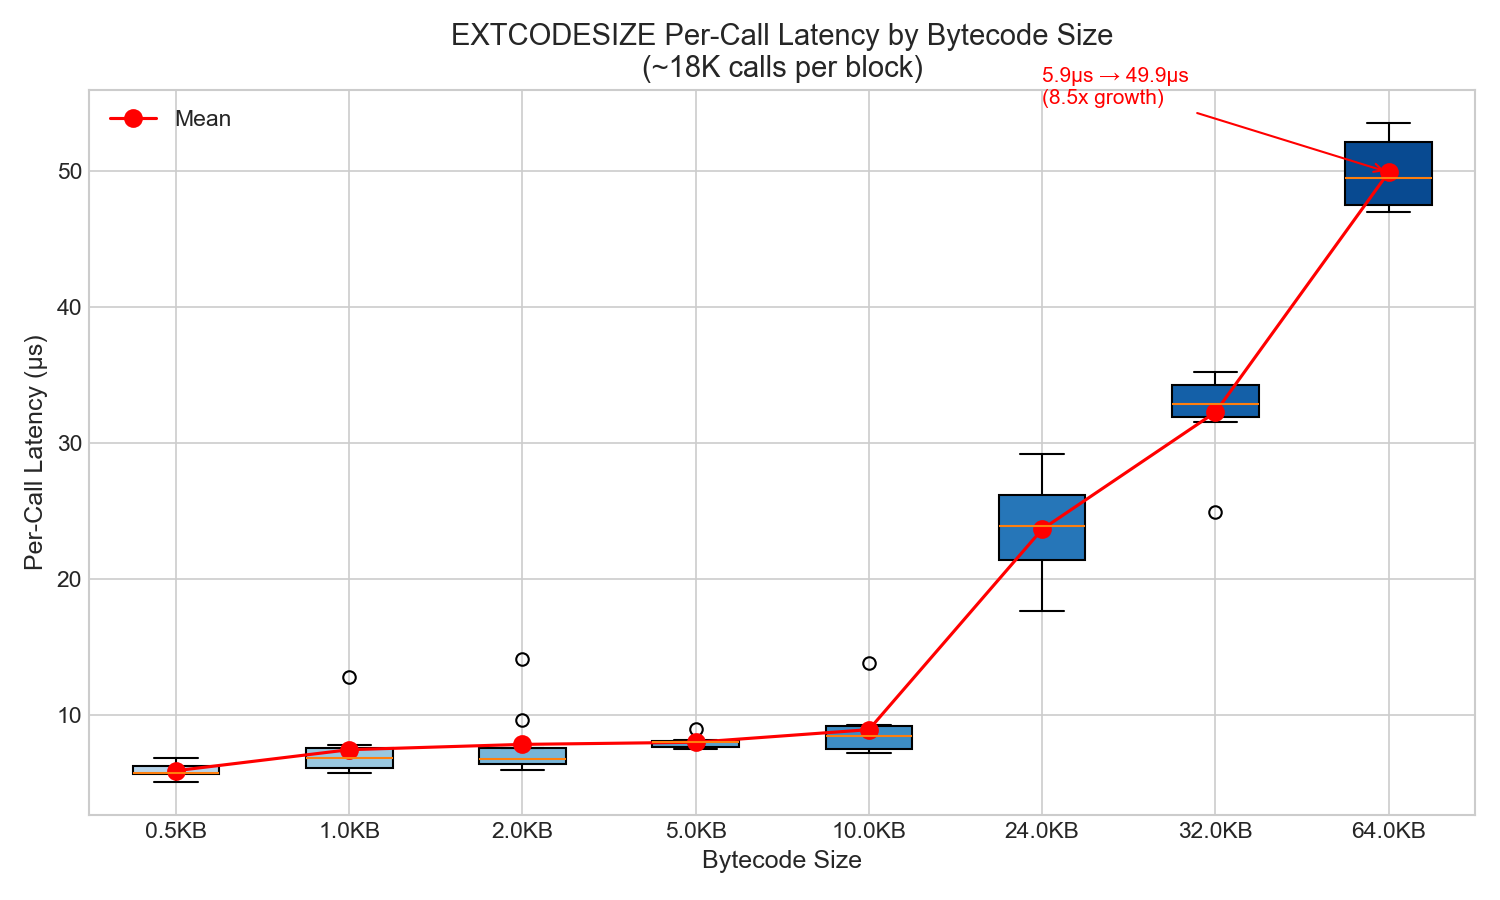
Per-call latency grows with bytecode size:
| Size | Per-Call Latency | Growth |
|---|---|---|
| 0.5KB | 5.9 µs | 1.0x |
| 1KB | 7.5 µs | 1.3x |
| 10KB | 8.9 µs | 1.5x |
| 24KB | 23.7 µs | 4.0x |
| 32KB | 32.3 µs | 5.5x |
| 64KB | 49.9 µs | 8.5x |
3. Execution Time Breakdown
3.1 Component Analysis
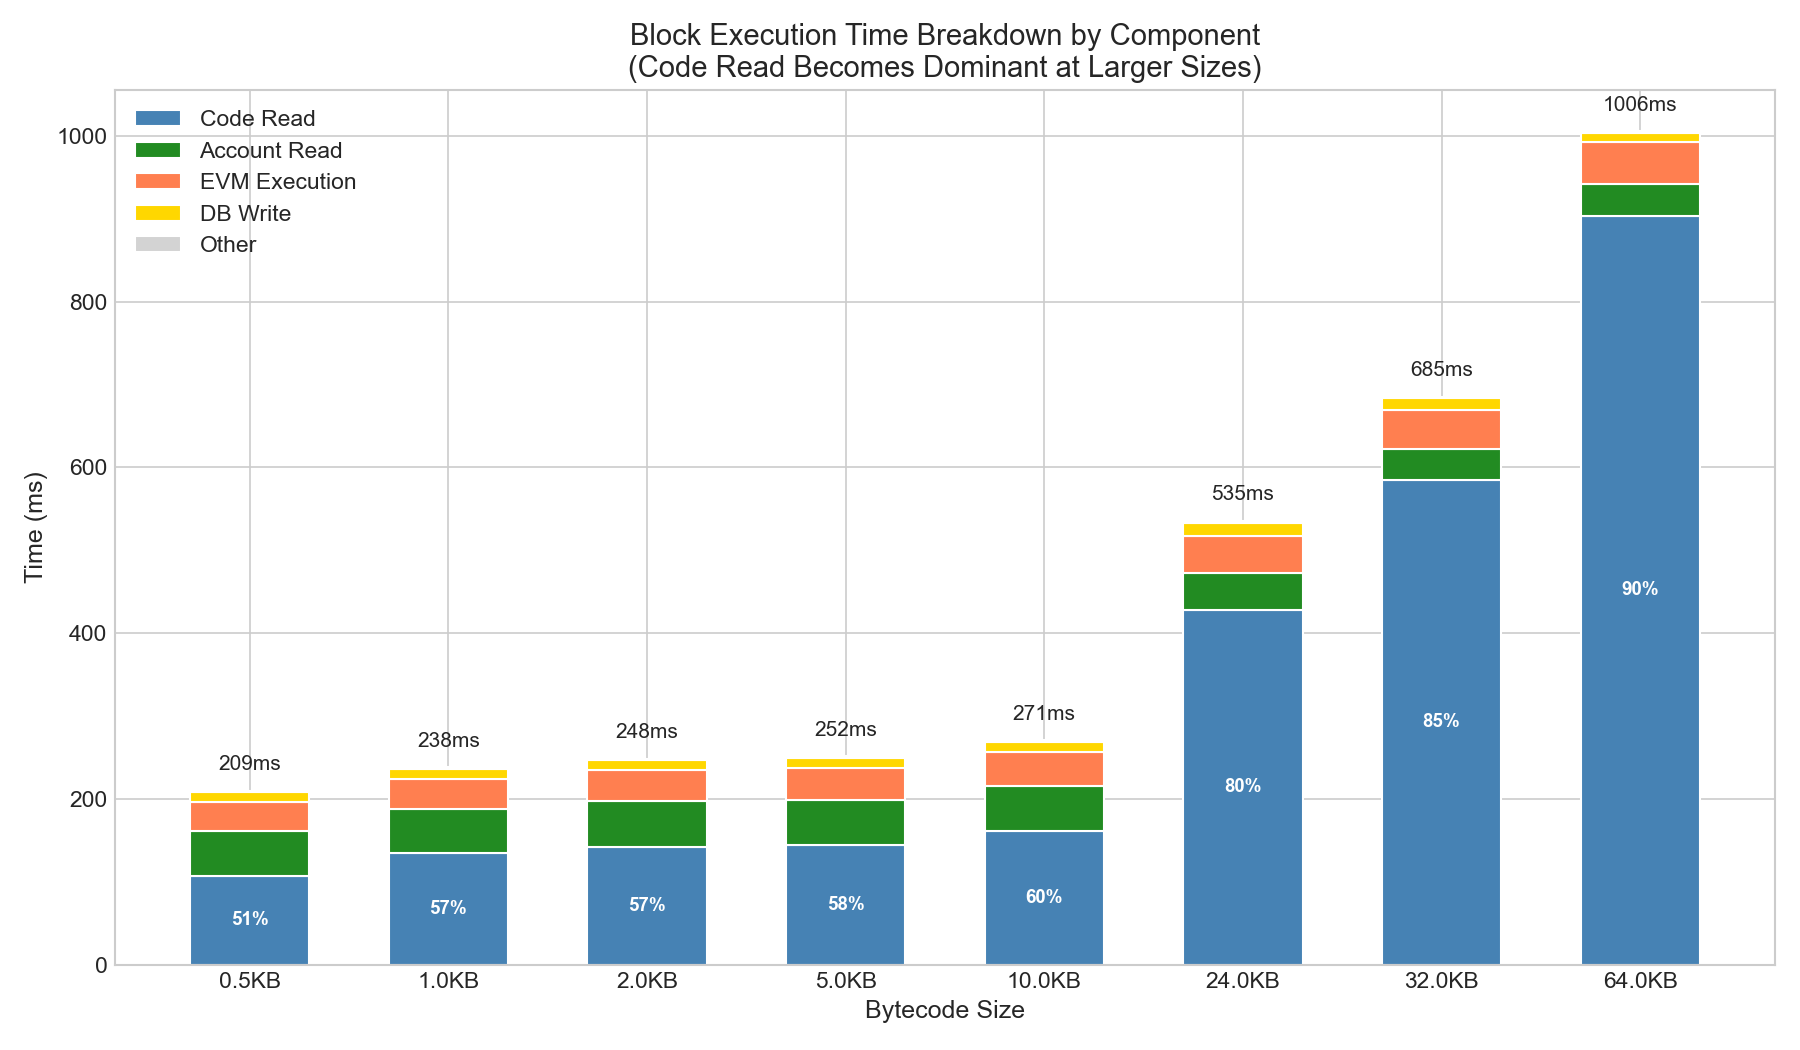
Code read becomes the dominant factor at larger bytecode sizes:
| Size | Code Read | Account Read | EVM Exec | DB Write | Other | Total |
|---|---|---|---|---|---|---|
| 0.5KB | 107ms (51%) | 54ms | 34ms | 12ms | 2ms | 209ms |
| 1KB | 135ms (57%) | 53ms | 37ms | 12ms | 1ms | 238ms |
| 10KB | 161ms (59%) | 53ms | 40ms | 12ms | 5ms | 271ms |
| 24KB | 428ms (80%) | 44ms | 46ms | 15ms | 2ms | 535ms |
| 32KB | 584ms (85%) | 38ms | 47ms | 13ms | 3ms | 685ms |
| 64KB | 904ms (90%) | 38ms | 51ms | 12ms | 1ms | 1006ms |
Observation: At 64KB, code read consumes 90% of block execution time. This is dramatically different from warm-cache scenarios where code read is only 8-10%.
4. Block Time Budget Analysis (EIP-7907 Focus)
4.1 Time vs Budget Target
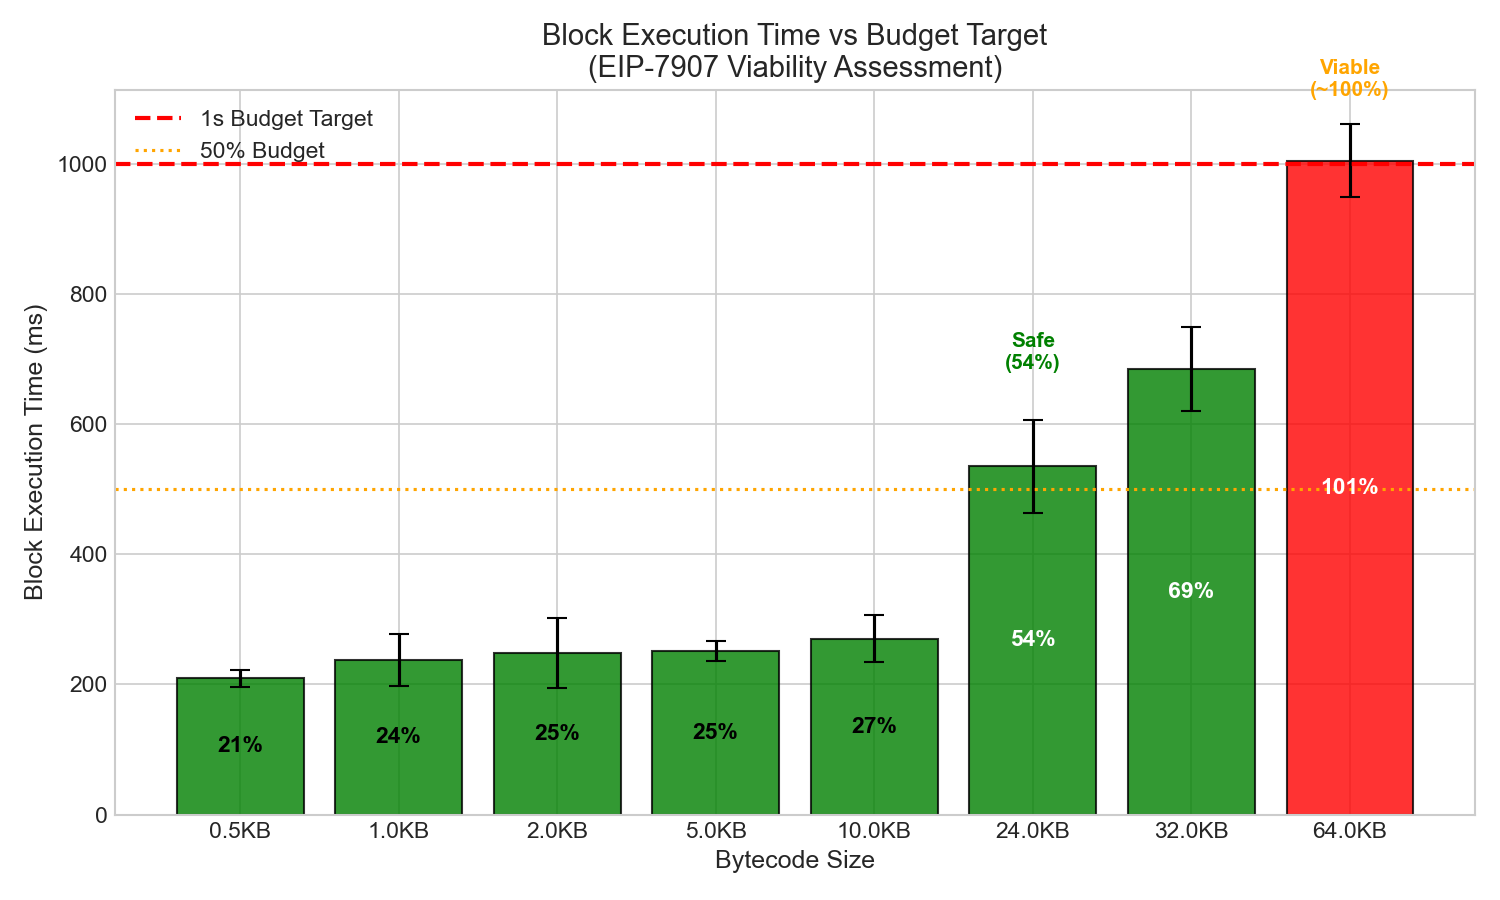
Using a 1-second target for block execution:
| Size | Block Time | % of 1s Budget | Status |
|---|---|---|---|
| 0.5KB | 209ms | 21% | Well under budget |
| 1KB | 238ms | 24% | Well under budget |
| 2KB | 248ms | 25% | Well under budget |
| 5KB | 252ms | 25% | Well under budget |
| 10KB | 271ms | 27% | Well under budget |
| 24KB | 535ms | 54% | Under budget |
| 32KB | 685ms | 69% | Under budget |
| 64KB | 1006ms | ~100% | At limit |
Conclusion: 64KB contracts are viable under worst-case attack conditions at 60M gas blocks. The ~1-second execution time is at the budget limit but acceptable. Note that this is a quite conservative limit considering ePBS & BALs will likely reshape what we consider a safe budget in the near future.
4.2 Gas Processing Rate (Mispricing Analysis)
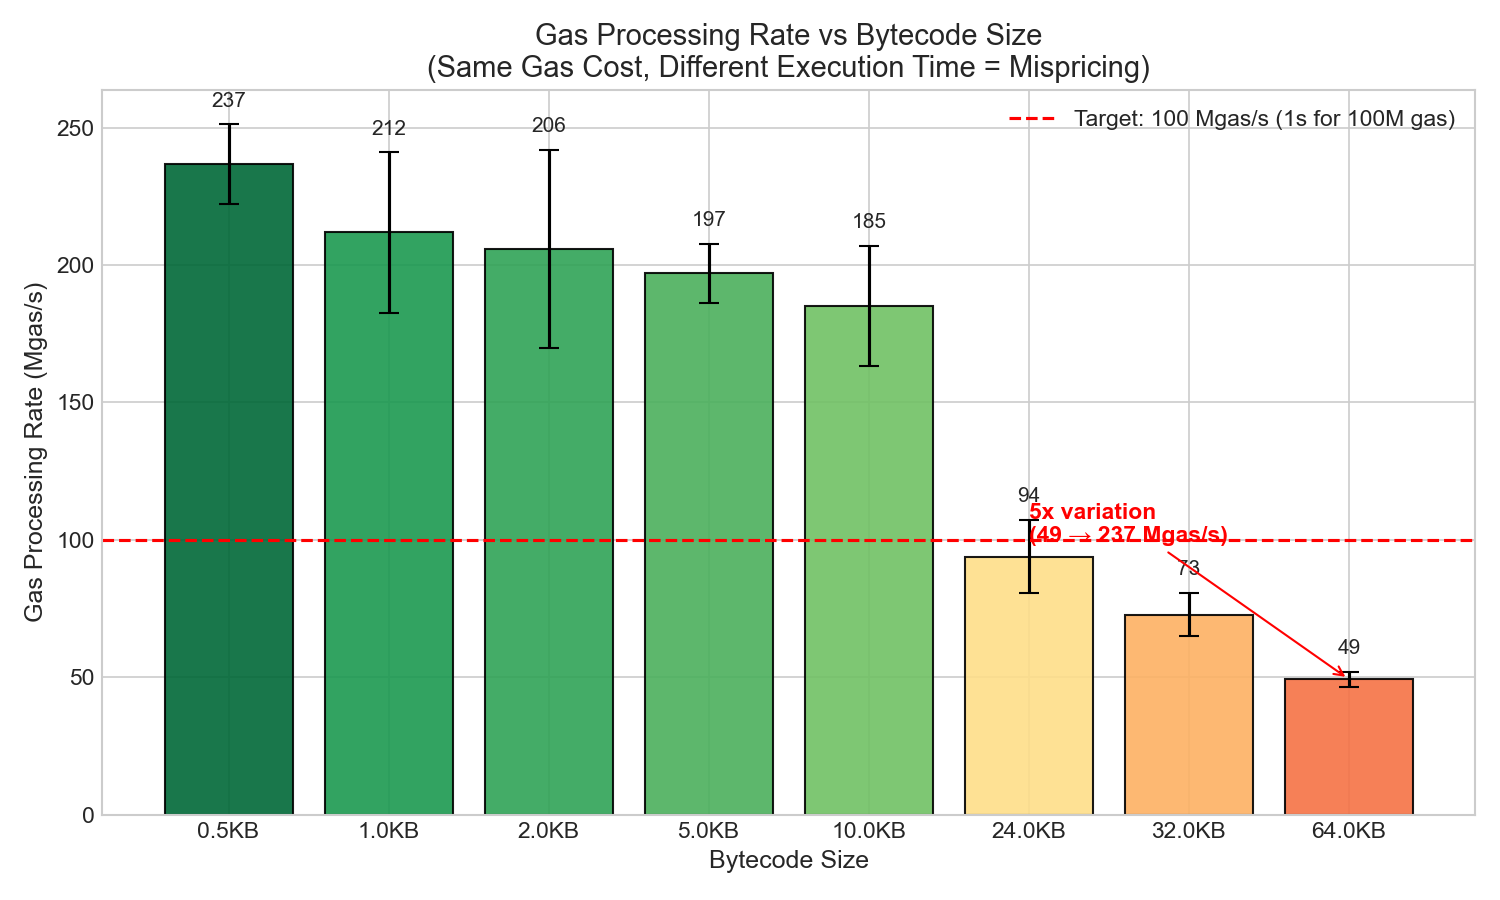
| Size | Gas Used | Block Time | Mgas/s |
|---|---|---|---|
| 0.5KB | 49.4M | 209ms | 236 |
| 1KB | 49.4M | 238ms | 208 |
| 10KB | 49.4M | 271ms | 182 |
| 24KB | 49.4M | 535ms | 92 |
| 32KB | 49.4M | 685ms | 72 |
| 64KB | 49.4M | 1006ms | 49 |
Mispricing observed: Same gas cost, but 5x different execution time (236 Mgas/s → 49 Mgas/s). This indicates that under worst-case conditions, larger contracts impose disproportionately higher cost on validators.
Implication for 128KB+: Beyond 64KB, a gas model adjustment would be needed—likely a base cost plus size-dependent component.
Notice this is quite conservative. As in order to “halt” the network or “significantly hurt slow validators”, the setup required would be of hundreds of times the 18k unique contracts. Which incurrs on a massive costs (we can’t reuse them as they would be cached after the first block execution).
5. Raw Disk Baseline (Geth vs NVMe Efficiency)
5.1 Efficiency Comparison
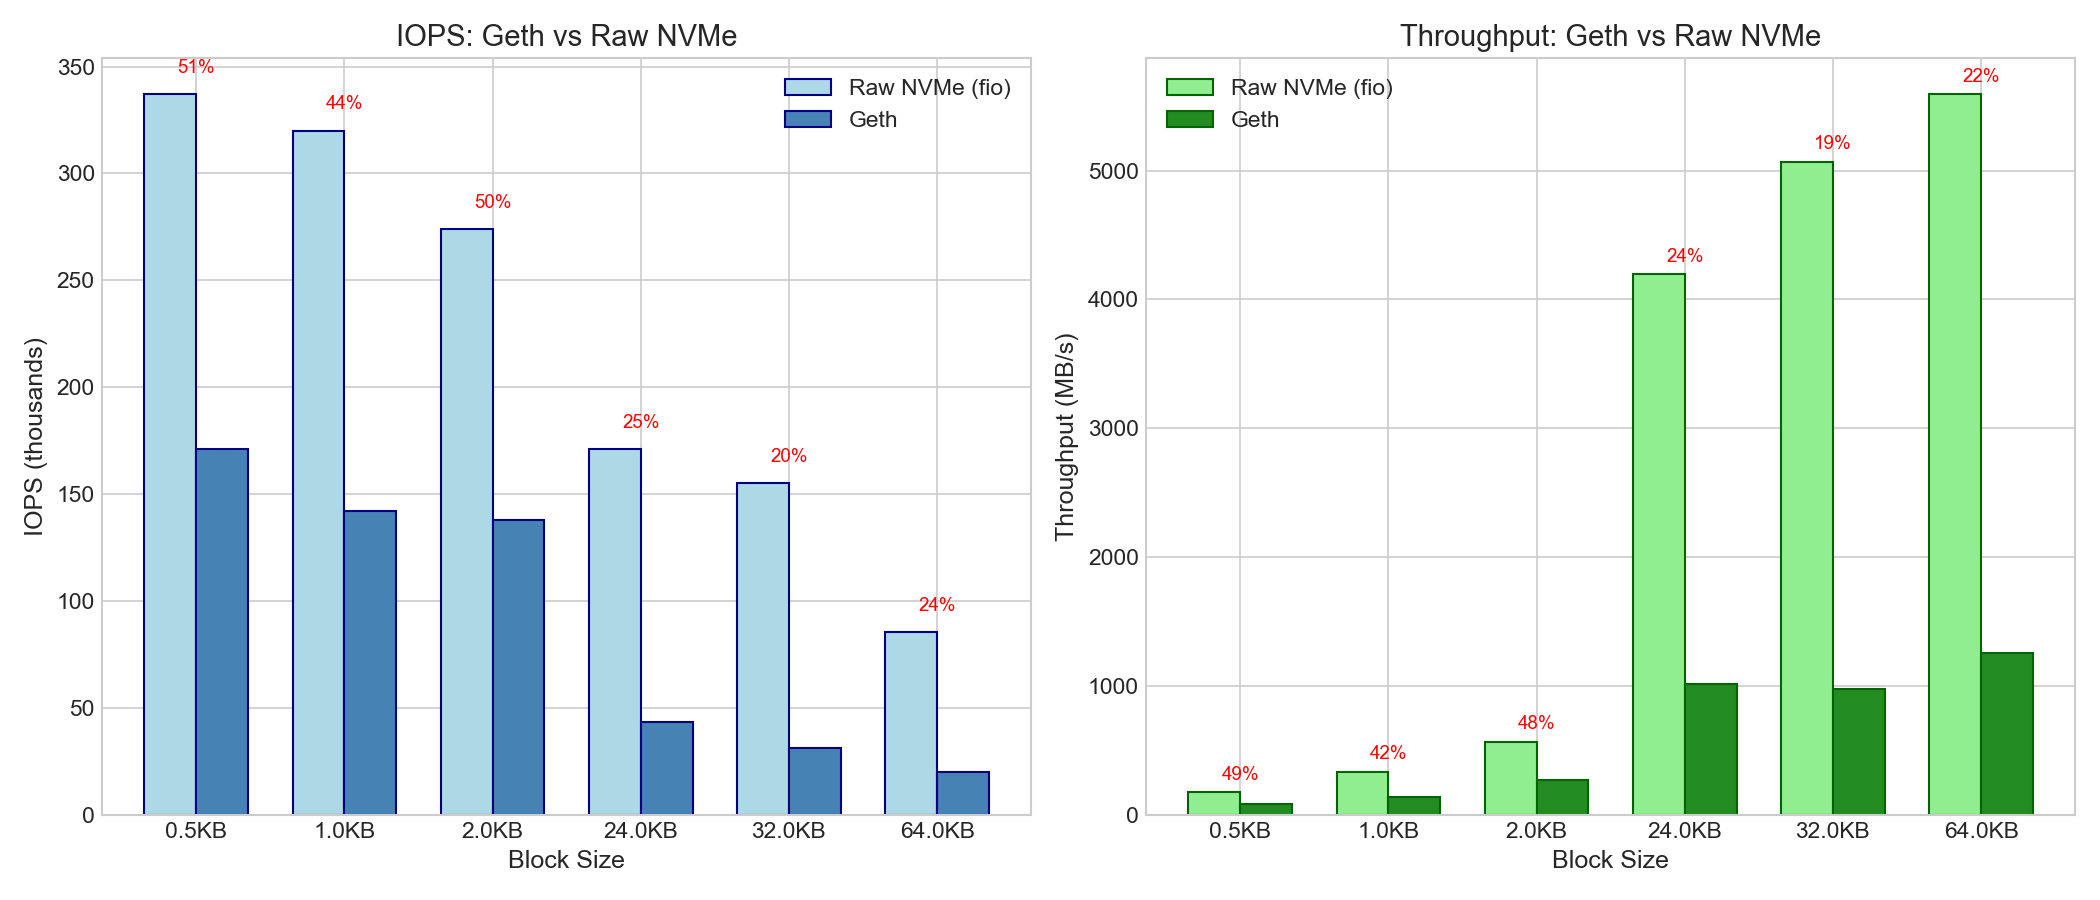
| Size | Geth IOPS | Raw NVMe IOPS | Efficiency | Geth Throughput | Raw NVMe | Efficiency |
|---|---|---|---|---|---|---|
| 0.5KB | 171K | 337K | 51% | 83 MB/s | 172 MB/s | 48% |
| 1KB | 142K | 320K | 44% | 139 MB/s | 328 MB/s | 42% |
| 24KB | 43K | 171K | 25% | 1.0 GB/s | 4.2 GB/s | 24% |
| 32KB | 31K | 155K | 20% | 979 MB/s | 5.1 GB/s | 19% |
| 64KB | 20K | 85K | 24% | 1.26 GB/s | 5.6 GB/s | 23% |
Observation: Geth achieves 20-51% of raw disk performance. The gap is likely due to:
- Pebble/LevelDB overhead (index traversal, bloom filters)
- Key hashing and lookup
- Value deserialization
6. Comparison with Warm Cache Scenario
6.1 Cached vs Uncached Performance
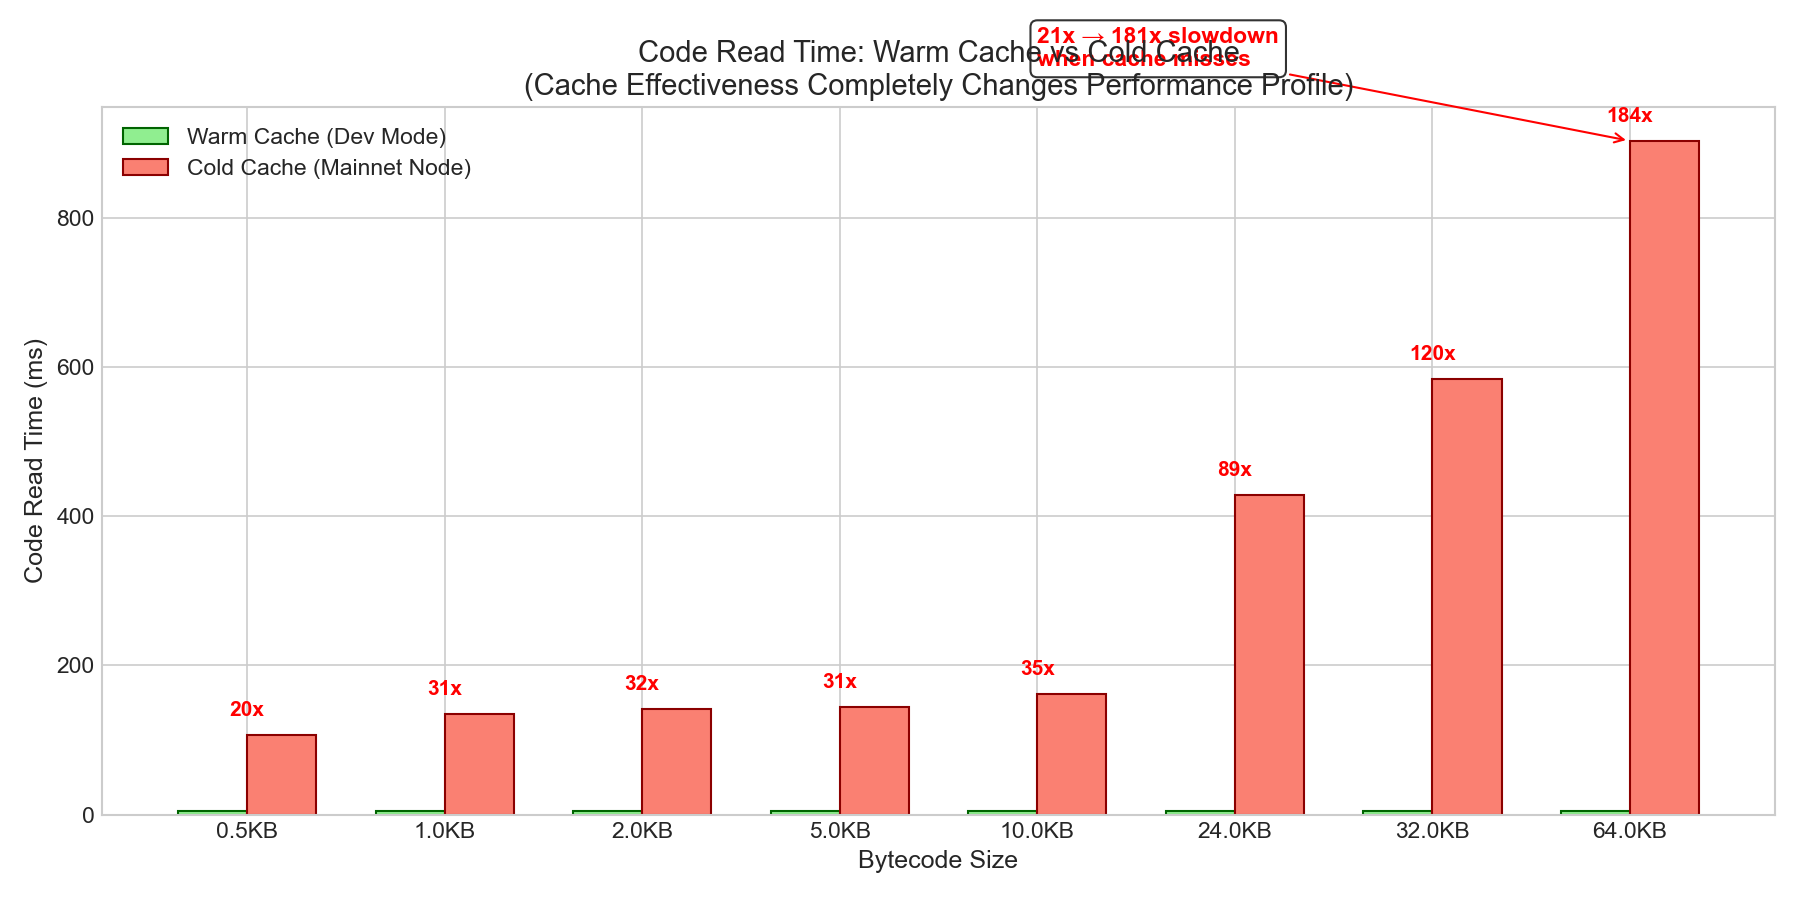
| Size | Warm Cache | Cold Cache | Slowdown |
|---|---|---|---|
| 0.5KB | 5.3ms | 107ms | 21x |
| 1KB | 4.4ms | 135ms | 31x |
| 2KB | 4.5ms | 142ms | 32x |
| 5KB | 4.6ms | 145ms | 31x |
| 10KB | 4.7ms | 161ms | 34x |
| 24KB | 4.8ms | 428ms | 89x |
| 32KB | 4.9ms | 584ms | 119x |
| 64KB | 4.9ms | 904ms | 181x |
The “flat cost” finding from warm-cache benchmarks remains valid for normal operation. Cold cache conditions require extreme attack scenarios (18K+ unique contracts).
7. Implications for EIP-7907 & Recommendations
7.1 Summary of Findings
- Code read time scales with size under attack conditions (8.5x from 0.5KB to 64KB)
- 64KB is viable at 60M gas blocks—worst-case ~1s execution, within budget
- This represents the absolute worst case—18K+ unique contracts is impractical to deploy and maintain (you need a new set for each block you want to run the attack).
- Normal operation is unaffected—warm cache scenarios show flat ~5ms cost
- Gas mispricing exists under attack (5x execution time variation for same gas)
7.2 EIP-7907 Recommendation
| Action | Recommendation |
|---|---|
| 64KB limit | Proceed - viable under worst-case attack. No need for the EIP |
| 128KB+ limit | Requires re-measuring with BALs + ePBS |
It seems we can just “keep it simple” and provide Smart Contract developers a nice upgrade on the codesize limit without any changes to the protocol besides the 64kB limit and the initcode size increase.
Once we have BALs and ePBS on a more ready state, we will be in a position where data will guide us better towards a good decision on repricing/just proceed to 256kB.
But it feels unnecessary to do a repricing now for something that doesn’t really need it even in it’s worst case.
7.3 Why 64KB is Acceptable
-
Attack impracticality: Deploying 18K+ unique 64KB contracts requires:
- ~13M gas per contract deployment (32K base + 64K × 200 gas/byte)
- Hundreds of blocks just for setup
- Significant ongoing cost to maintain attack surface
-
Block time within budget: Even worst-case ~1s is acceptable for 60M gas blocks
-
Cache effectiveness in practice: Real mainnet blocks reuse contracts; code cache hit rate is typically high
-
Sub-linear scaling: 8.5x time for 128x size growth indicates amortization still helps