Colin, in collaboration with Thomas, Julian and Barnabé as a RIG Open Problems (ROP) project - December 6th, 2023
Table of Contents
- Introduction
- Insights on CEX DEX Arbitrages
- Cost Revenue Analysis of Strategies
- Empirical vs Theoretical Profits
- Conclusion
Introduction
Following the Merge on September 15, 2022, 91.8% of blocks (mevboost.pics, n.d) on Ethereum are built via MEV-Boost under the Proposer-Builder Separation (PBS) design. This aimed to minimise the computing power for validators and reduce the centralizing effects of MEV extraction (e.g. exclusive orderflows) by splitting the block construction role from the block proposal role (Barnabe, 2022). Today, sophisticated entities known as searchers look for MEV opportunities, bundle multiple profitable transactions, and send them to builders. Block builders are then in charge of packing blocks efficiently and participate in MEV Boost auctions by bidding for their blocks to be chosen by blocks proposer via relays. Relays are trusted parties which validate these blocks along with their bids, and make them available for proposers to choose from before proposing the block to the rest of the network.
To date, research on MEV has been largely confined within the on-chain space - liquidations, front-running and sandwich attacks (Qin et al, 2021). However, it is important to recognise that large amounts of price discrepancies also exist when compared with the off-chain environment on centralised exchanges (CEX). In fact, cross-domain arbitrages remain a relatively nascent space with limited research (Gupta et al, 2023). Obadia et al (2021) formalized cross-domain MEV through the ordering of transactions in two or more domains; Chiplunkar and Gosselin, (2023) highlighted the phenomenon where certain block builders dominate the market during periods of volatility; Milionis et al (2023) provided a theoretic analysis of the impact of certain cross-domain arbitrages on liquidity provider’s profits and formalized a model, known as “loss versus rebalancing” in the presence of fees; Thiery (2023) had also provided an empirical analysis into the behavioral profiles of block builders to elucidate unique features and strategies in this process. Given the opaqueness of the CEX part in this trade, the exploration of this field is still in its infant stages. Yet, these opportunities have grown in dominance with the rising adoption and maturity of the markets.
In this post, we conduct an empirical analysis of CEX <> DEX arbitrages by studying on-chain daa to infer the relationships between builders and searchers, estimate MEV profits and reverse engineer the strategies used by CEX <> DEX arbitrageurs.
Insights on CEX <> DEX Arbitrages
The following heuristics was applied to identify potential successful CEX <> DEX arbitrages based on the on-chain transactions from the AMM trades. These either contained a single swap followed by a direct builder payment (coinbase transfer) or two consecutive transactions where the first is a single swap while the second is the coinbase transfer. The time period for this data collection started from May 5, 2023 and ended on July 16, 2023, returning a total of 157, 205 CEX <> DEX arbitrages amongst 101, 022 blocks.
Order of MEV Opportunity
We note that nearly all of these arbitrages are top of the block opportunities, suggesting that these searchers vie to be at the front. This is supported by Gupta et al’s (2023) observation that these arbitrages “required priority access” to exploit the price divergence.

Figure 1. Index of CEX <> DEX arbitrages within the block. A. consists of transactions with both a swap and coinbase transfer. B. represents the arbitrage where there are 2 separate transactions - 1 swap (DEX index) and 1 coinbase transfer (Builder index). The y axis indicates the number of arbitrages while the x-axis is the index of the transaction within the block.
Symbols Traded and Venues
Next, we calculated the average number of symbols traded to understand the general preference amongst arbitrageurs. In general, WETH topped the list by appearing in 45.0% of transactions, while USDC and USDT were in 11.5% and 5.3% of the time.
As for the pools, we note that Uniswap v3 was the venue which had the most CEX <> DEX arbitrages (74.65%).
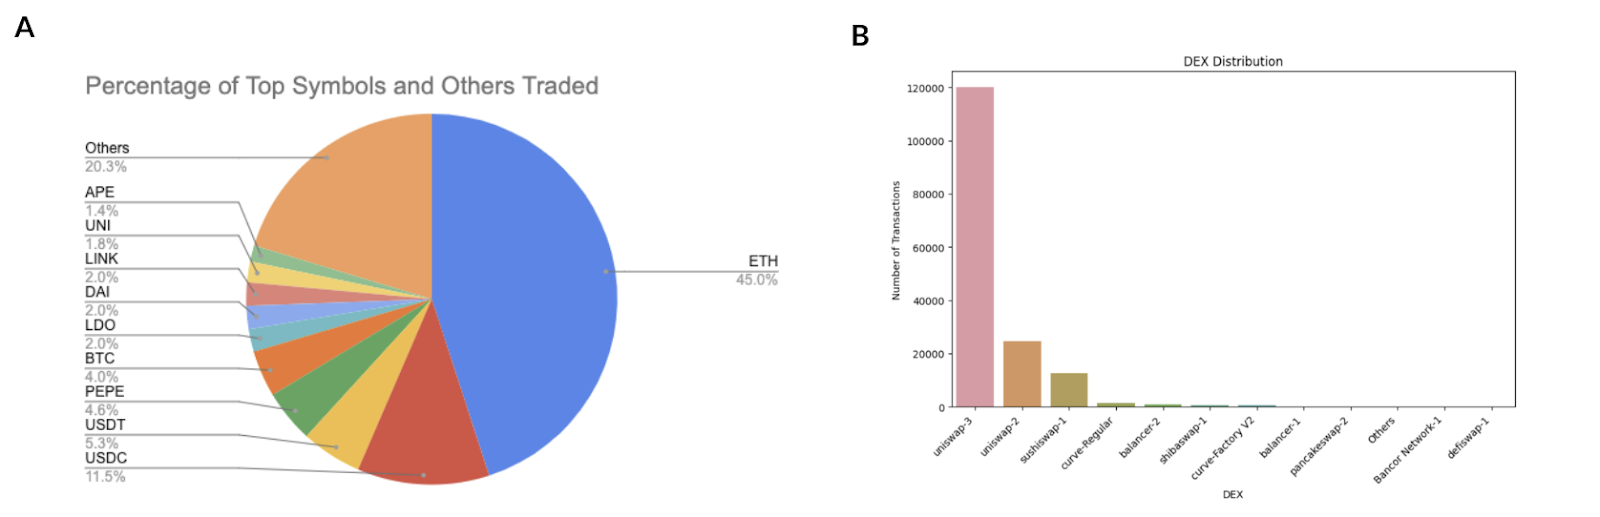
Figure 2. A. Types of token symbols traded. B. Venue where CEX <> DEX arbitrages occur
Searcher - Builder Landscape
To shed light on the distribution of the searchers and builders involved in these arbitrage opportunities, our findings indicated a relatively concentrated market where 1 to 2 entities dominated the CEX <> DEX landscape. Searcher 0xa69 has consistently represented 55.7% of market share while 0x98 had 20.23% of these arbitrages. In the meanwhile, beaverbuild continued to lead in this space with 41.77% of all related blocks and 52.91% of these CEX <> DEX arbitrages.
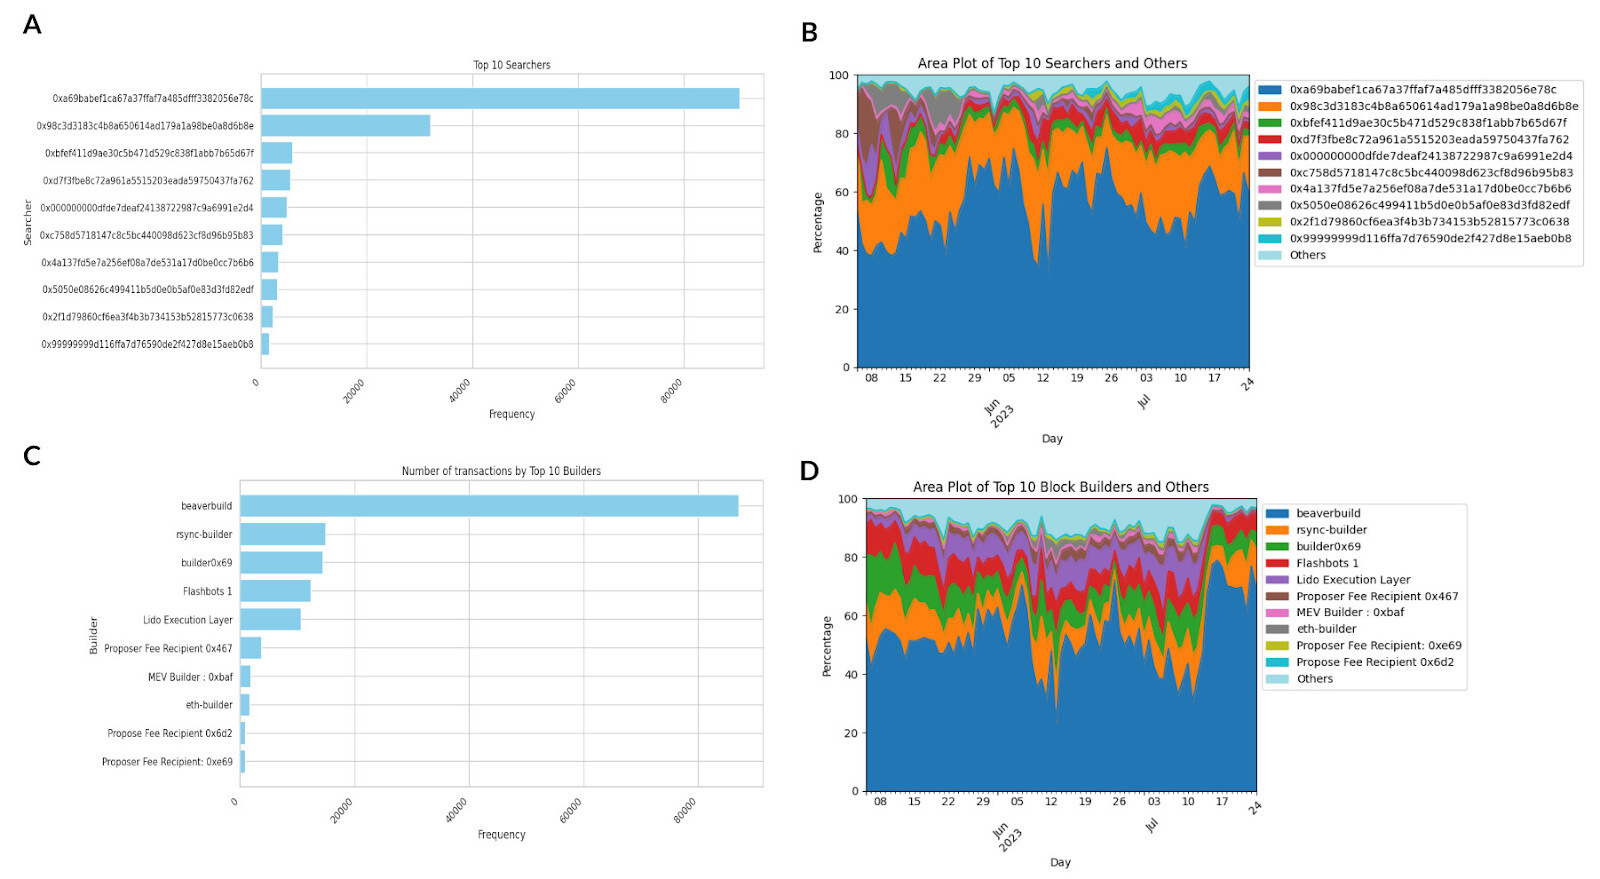
Figure 3. Distribution of CEX DEX Arbitrage amongst searchers and block builders, builder payments. A. Total Transaction Count per Searcher. B. Daily Distribution of arbitrages made by the Top 10 searchers, with the remaining labelled as ‘Others’. C, D: Similar to A, B but distribution for block builders.
Builder Payments
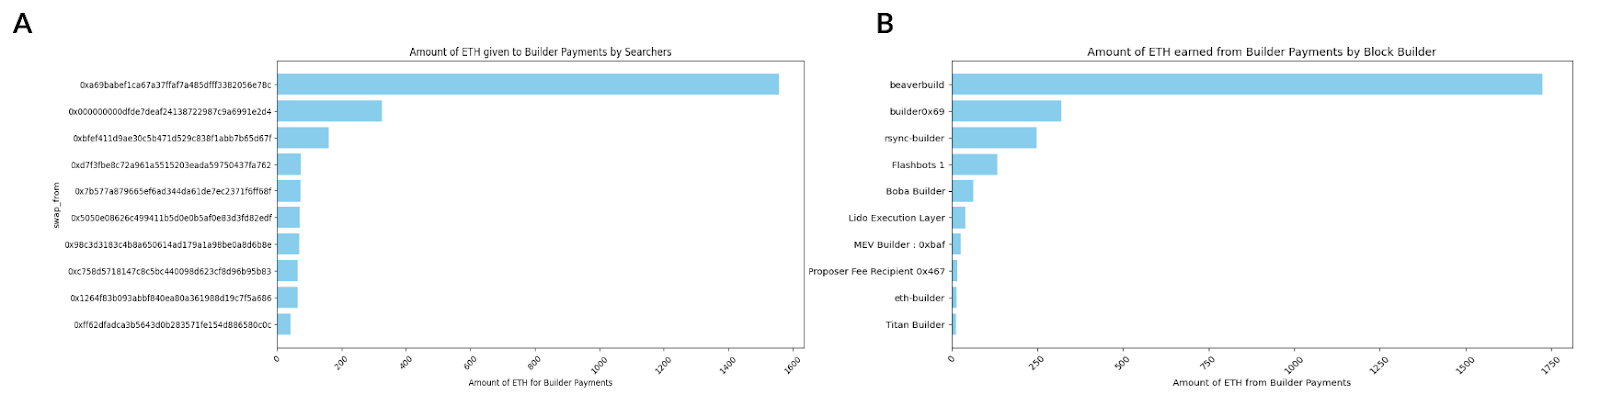
Figure 4. Amount of ETH related to builder payments. A. Amount of ETH given to block builders by searchers. B. Amount of ETH earned by block builders from searchers.
Types of Transactions Made
We then classified the transactions based on the type of asset pairs traded. These conditions were used in the classification process, referenced from Coingecko.
-
Market capitalizations. We note that BTC and ETH are leading cryptocurrencies with significantly higher market capitalizations relative to the other digital currencies and thus, classified them as the majors.
-
Nature of asset. This was based on the inherent stability / volatility of the asset since these influence the potential price movements during the trading window. As such, we further segmented the remaining assets into stablecoins and memecoins (based on Coingecko’s definitions).
Therefore, we derived these categories for the assets - majors (BTC/ETH), Stablecoins (USDC, USDT, BUSD, TUSD, DAI), Memecoins (PEPE, DOGE, SHIB, FLOKI, ELON) and Altcoins (All remaining types of cryptocurrencies). Table 2 highlights the distribution of trades for each category with ‘major-alt’ type representing 43.87% and meme-alts as the least popular token pair.
After which, we determined the average revenue from the arbitrage by collecting price data from Binance at the 1s interval. An example to calculate the revenue of a CEX <> DEX arbitrage can be seen below:
-
Step 1: In this identified CEX <> DEX arbitrage (0xc4322), the arbitrageur swapped 175,070 USDC for 92.70 ETH.
-
Step 2: At the time of trade, it can be interpreted that the DEX exchange rate was at 1,888.57 USDC/ETH. On Binance, the approximated rate was at 1,896.68 USDC/ETH
-
Step 3: Revenue = Difference between Binance price and dex price * Tokens transacted. Since the arbitrageur sold USDC on-chain, it will purchase the same amount of using its ETH on Binance, to form a delta neutral position. Thus, receiving 92.70 * 1,896.68 = 175,822.24 USDC on Binance. The revenue will be 175,822.24 - 175,070 = 752.24 USDC.
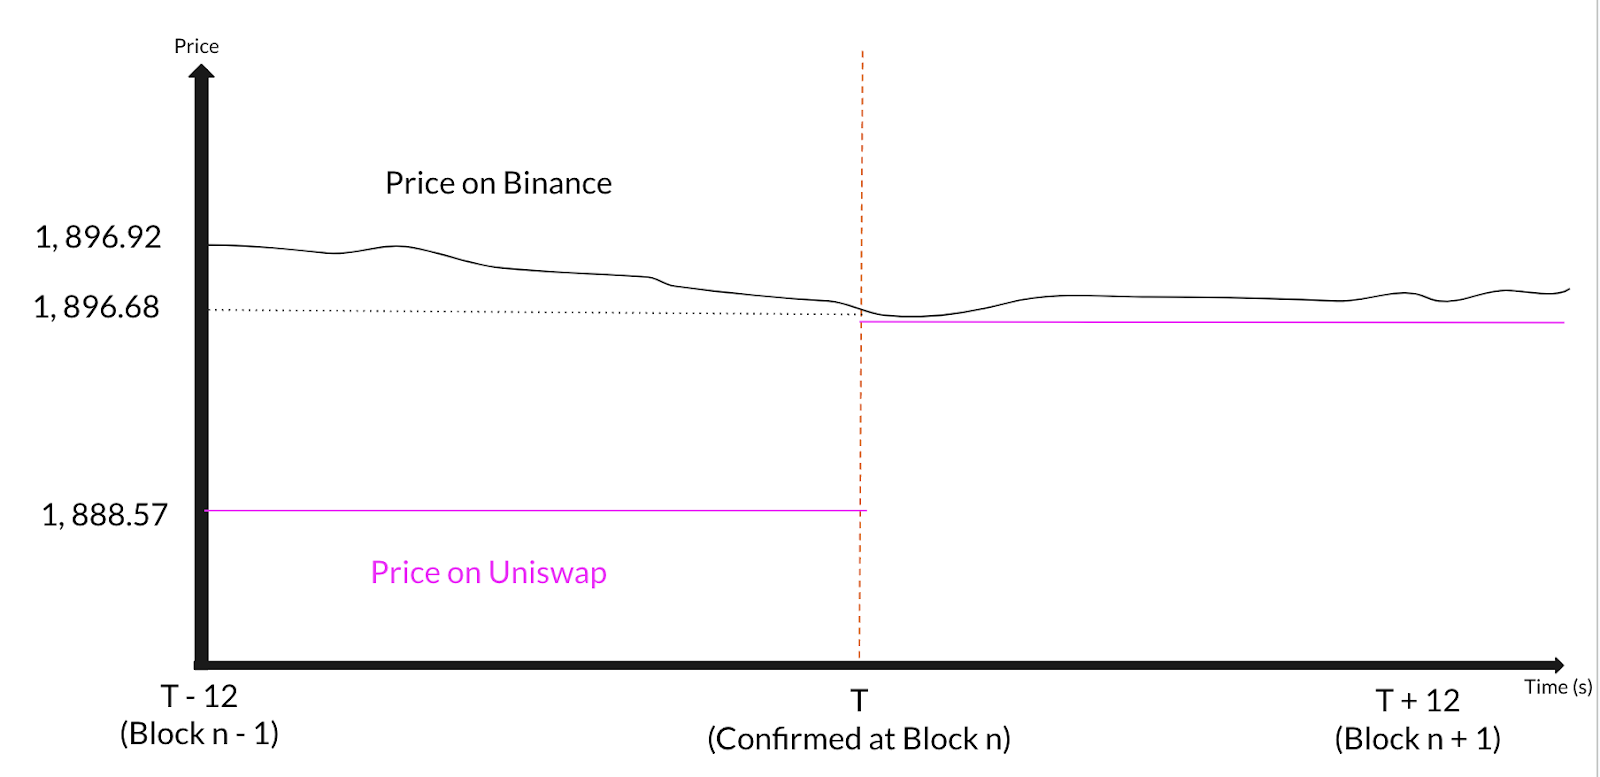
Figure 5. Illustration of the convergence of prices on Binance and on Uniswap across the sampled 25s trading window. Price on DEX remains the same between T - 11 and T which is equivalent to block n - 1 to block n
| Asset Pair | Number of Arbitrages | Average Revenue (Dollars) | Average Revenue Levels (%) | Median Revenue Levels (%) | Std of Revenue Levels |
|---|---|---|---|---|---|
| Major Alt | 68,971 | 27.22 | 0.592280 | 0.357810 | 0.631414 |
| Major Stable | 48,609 | 65.74 | 0.056047 | 0.033804 | 0.652161 |
| Major Meme | 17,378 | 105.23 | 0.438608 | 0.368191 | 0.488297 |
| Alt Stable | 10,924 | 22.78 | 0.724669 | 0.516730 | 0.591118 |
| Major Major | 10,314 | 39.49 | 0.151351 | 0.140248 | 0.118966 |
| Stable Stable | 711 | 16.15 | 0.016461 | 0.007080 | 0.032122 |
| Meme Stable | 235 | 49.38 | 1.613397 | 1.411989 | 0.975270 |
| Alt Alt | 54 | 17.90 | 0.946365 | 0.743498 | 0.626811 |
| Meme Alt | 9 | 8.22 | 1.670403 | 1.430110 | 0.497864 |
Table 1. Number of CEX DEX Arbitrages, average absolute and relative profit levels, segmented by type of asset pairs traded
Meme-alt trading strategies yielded the greatest revenue given that both are relatively volatile assets and thus, reaped the greatest rewards. Conversely, Stable-stable coin pairs had the lowest rewards given the inherent stability compared to the data set.
Minimising Risks
We then computed the distribution in revenue over the window, before and after block time. Given that blocks are created in 12s intervals, this means that the searcher will be potentially vulnerable to risks from changes in market prices. Therefore, we aimed to highlight the distribution and relative comparative advantage by computing the marginal change in revenue earned per second, over the window.
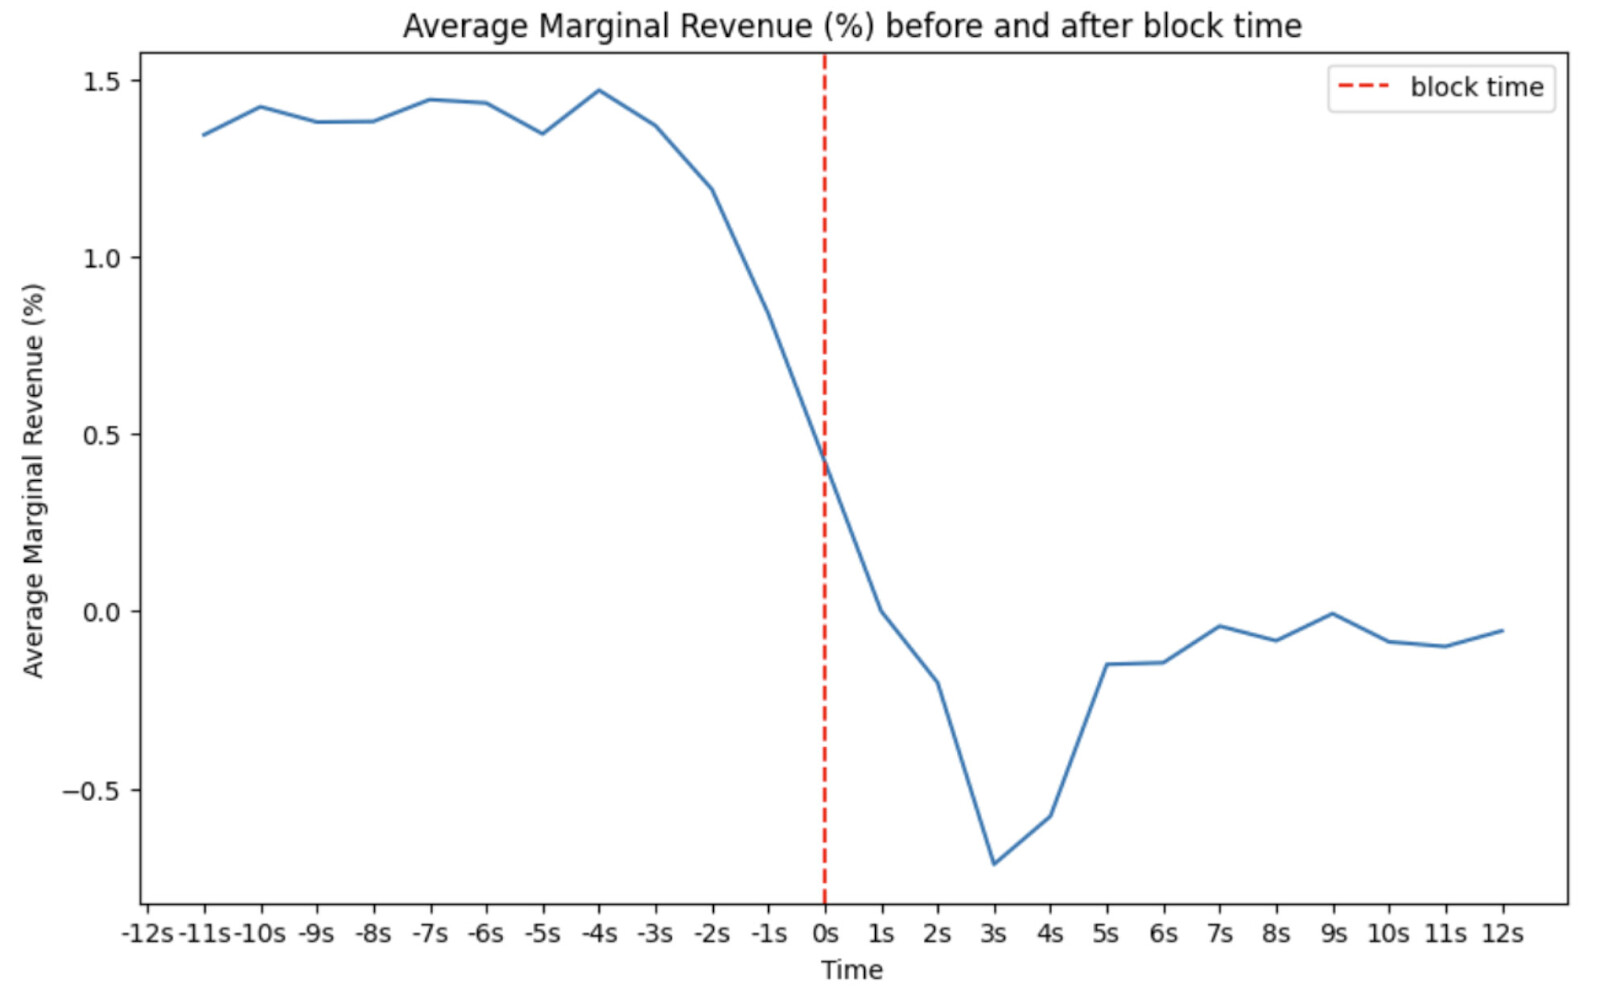
Figure 6. Marginal difference in revenue before and after block time, calculated by taking the difference in average revenue per second.
In general, the average revenue for the strategies continues to increase just before block time (at t = 0s) before tapering off This can be seen that latency is important in maximising the revenue extracted nearer to the actual block confirmation. The arbitrage opportunity closes out thereafter as the price on-chain gets updated and the differential with the off-chain price (on Binance) narrows. As a result, the average difference in prices decreased and thus, revenue flattened out which remained relatively constant.
We then determined the market risks borne by these arbitrageurs over the period by referencing the revenues at each juncture. This is because they will be holding onto inventory on either CEX or DEX depending which leg gets executed first. It aims to provide insights on the uncertainty of their revenues in this arbitrage by optimising for latency and executing their trades. We visualized the spread of the profitability by taking the 25th, 50th, and 75th percentiles for each asset pair.With the exception of meme-alt pairs (due to the small sample size), the findings indicated that -2s to +2s intervals will be generally preferred to minimise the uncertainties involved in trading. In fact, we noted that stablecoin pairs exhibited the least deviation while meme-stables showed the greatest change in expected rates of return. This is largely aligned with the intuition that volatile assets will show a greater difference.
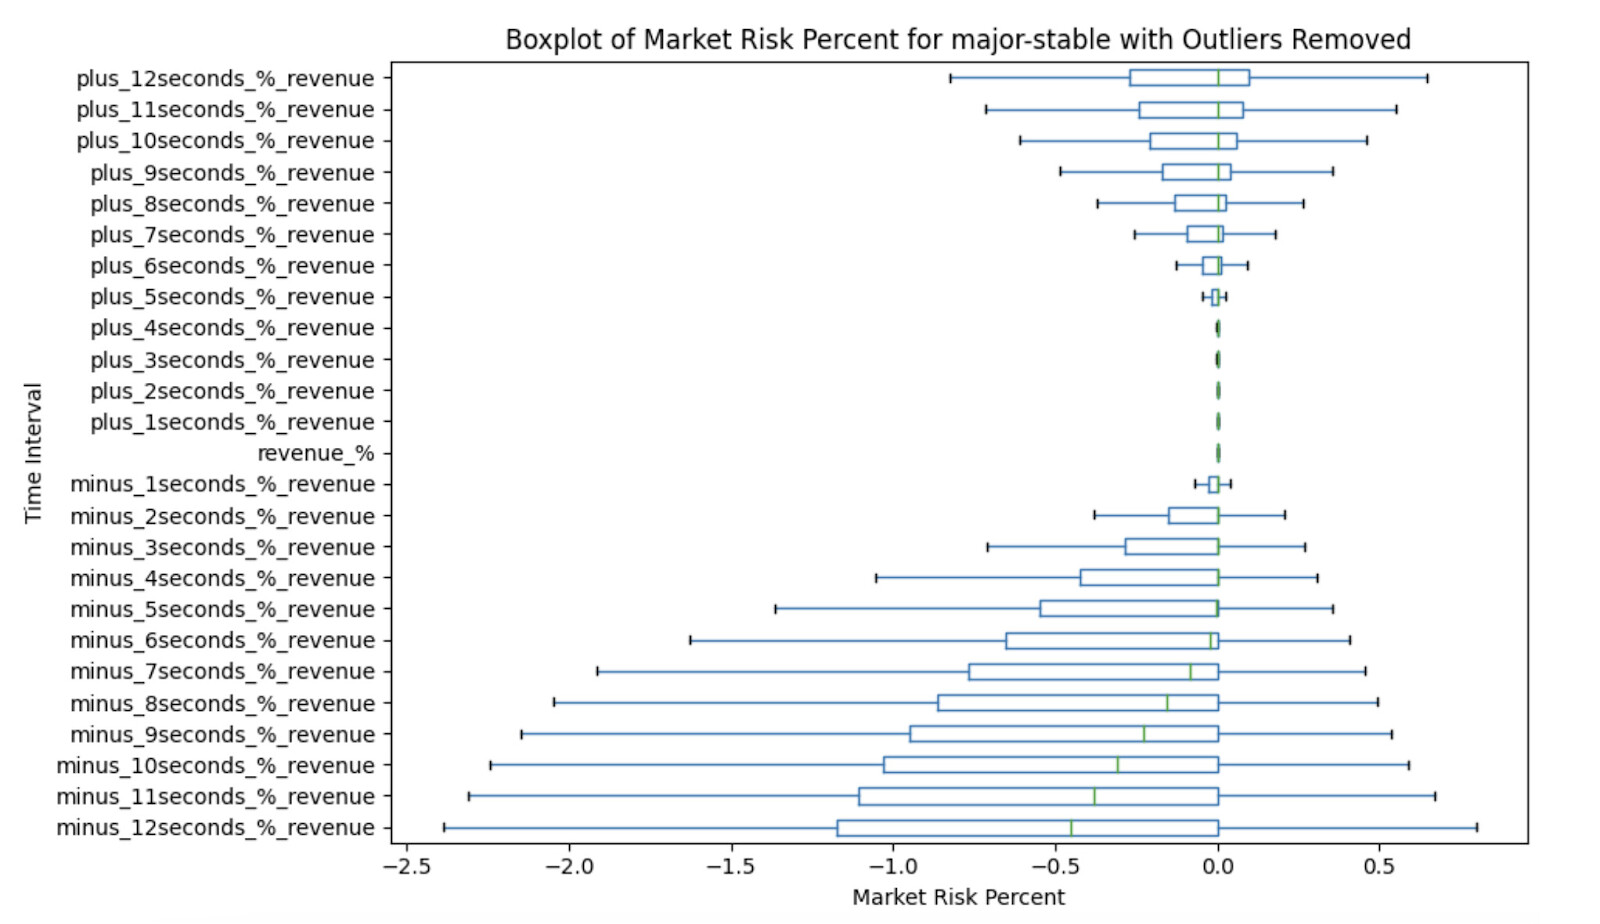
Figure 7. Market Risk that arbitrageurs bear from fluctuations in prices throughout block time. This is measured by taking the percentage difference between the profitability of the transaction at time t, and comparing it to the profits at block time. The average for these differences were derived then derived and plotted. A sample of the boxplot was taken, which represents the distribution in revenue over the trading window for major-stable asset pairs.
Cost and Revenue Analysis
To further analyze the profitability of these strategies, we segregated the dataset into arbitrageurs which interacted with Flashbots builder against those which did not interact with it. This is because Flashbots publicly stated that they are not for profit builders and will not take part in strategic or integrated searcher-builder behaviors. In addition, based on searcherbuilder.pics, we extracted the searcher-builder entities which consist of:
-
Symbolic Capital Partners <> beaverbuild
-
Wintermute <> rsync builder
The addresses of these searchers and block builders are based on the raw data processed by searcherbuilder.pics team. The list may not be exhaustive.
These entities are likely to shown forms of vertical integration across the MEV Supply Chain, where the searcher enjoys preferential access to blockspace and increased certainty of their transaction by being associated with a builder downstream.
In all, there were 46.24% of CEX <> DEX arbitrages by searcher-builder entities, 7.77% by searchers which interacted with Flashbots and 46.00% which did not interact with Flashbots.
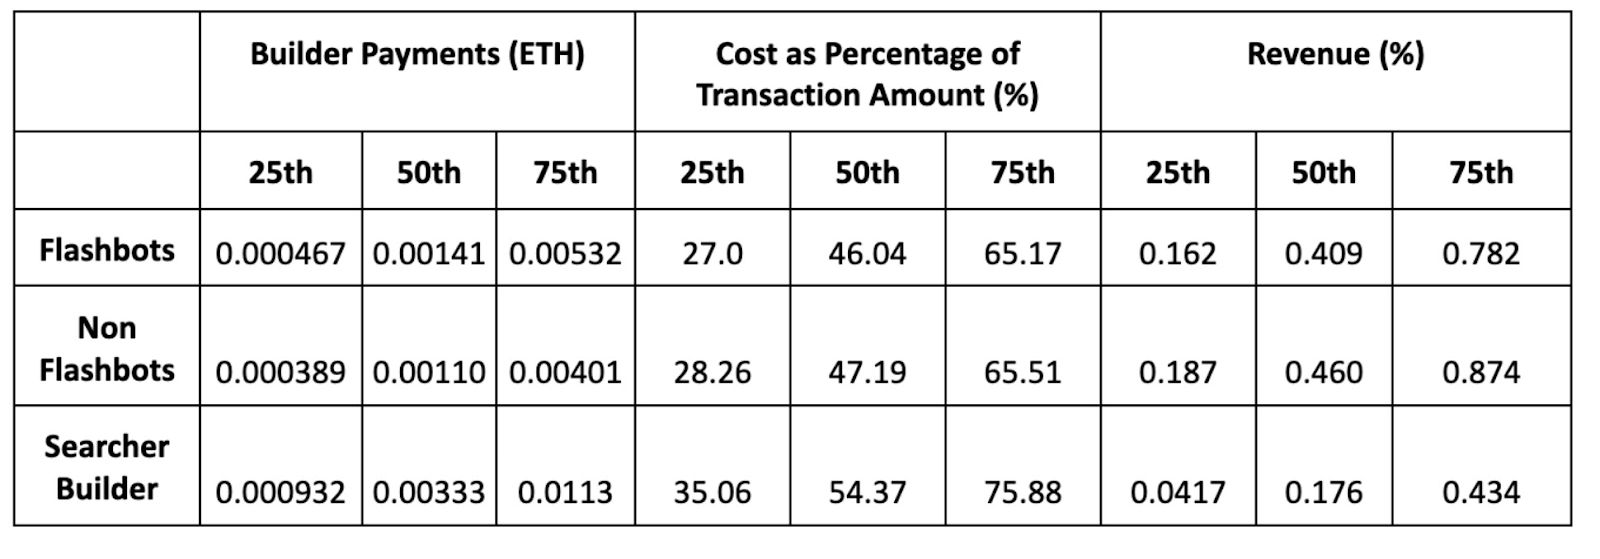
Table 2. Descriptive Statistics on costs for arbitrageurs, split into those which interacted with a Flashbots builder vs a Non-Flashbots builder vs the searcher builder entities. Builder Payments (ETH) represents the amount of ETH the arbitrageur sends the block builder for each segment. Cost as Percentage of Transaction Amount = Total Cost / Transaction Amount. * Revenue (%) measures the revenue earned by arbitrageurs from the CEX DEX Arbitrage.
On average, searchers which interacted with non-Flashbots block builders paid lower amounts of builder payments and appear to have a higher level of revenue compared to the others which interacted with Flashbots builders and for searcher builder entities. This could be explained by the relatively higher proportion of CEX-DEX arbitrages where over 46% of these arbitrages are made by the SCP <> beaverbuild entity and they represent nearly 100% of all arbitrages by the searcher-builders identified above. Furthermore, given that this is only over a period of slightly over 2 months, there are possible limitations to the dataset with certain skews, contrary to the general perception that searcher-builder entities enjoy a significant advantage. Nonetheless, this can be offsetted by the relatively large number of arbitrages the searcher builder entities contribute and hence, cumulative profits will likely be the highest.
Empirical vs Theoretical Arbitrage
Based on the empirical revenue calculated from the price difference between Binance and DEXs, we can determine if these searchers were rational by comparing with the theoretical revenue that can be yielded based on the AMM formula. Anthony et al (2022) introduced the arbitrageur’s optimization problem based on the pool reserves, where a rational profit-maximising user will be able to earn:

where L is the invariant, P is the price of the pair on the CEX, x and y are the reserves in the pool.
Figure 8. Formula to determine the theoretical profits from the Uniswap V2 AMM Model (Adapted from Anthony et al (2022) - Automated Market Making and Loss-Versus-Rebalancing). With courtesy of Julian.
To obtain the relevant data, we extracted the reserves at the time of trade from Dune Analytics based on the Uniswap sync function when the transaction occurs. As an initial guide, we have started with Uniswap V2’s AMM model. This returned a total of 20,123 transactions. The number of transactions per type of asset pair can be found below:
| Asset Pair | Number of Arbitrages |
|---|---|
| Major Alt | 11,138 |
| Major Stable | 1,712 |
| Major Meme | 3,515 |
| Alt Stable | 3,750 |
| Stable Stable | 2 |
| Meme Stable | 3 |
| Alt Alt | 3 |
Table 3. Number of CEX DEX Arbitrages on Uniswap V2, segmented by type of asset pairs traded.
In general, the formula held true, presenting the upper bound of revenue that can be potentially earned. As seen in Figure 8, we extracted the relevant transactions with ‘ETH’ and ‘USDC’ to plot the difference between the theoretical and empirical profits.
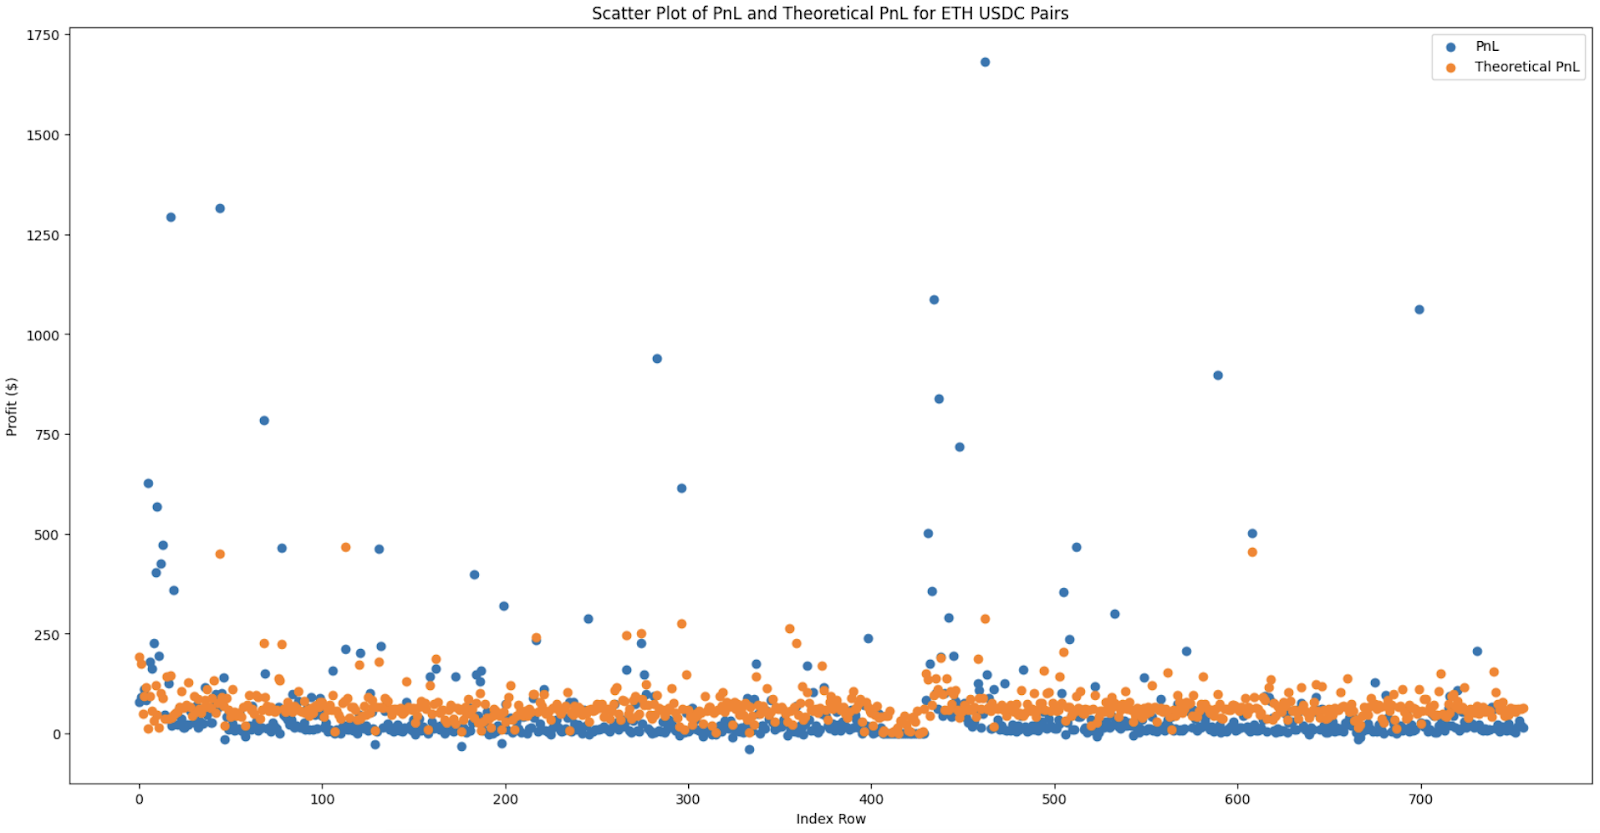
Figure 9. Scatterplot of the theoretical profit (orange) vs empirical profit (blue) for all ETH-USDC and USDC-ETH transactions. The x axis simply represents the row number within the dataframe for plotting the data.
The numbers represent the difference between the theoretical revenue and empirical revenue earned by the arbitrageurs. In particular, based on the different types of asset pairs, we note that the major-meme pairs had the largest variation and difference across the percentiles. It is important to note that the theoretical upper bound of the profits did not hold based on the reserves pool for some of the asset pairs, as these could be due to risky / directional trading. In contrast, major-stable pairs such as ETH USDC and stable-stable pairs largely conformed to the model. This confirms the intuitive understanding the the volatility of the asset pair are more likely to influence the behavior of searchers in arbitraging the pool - exercise greater caution in the amount being swapped to manage the risks from large swings in prices.
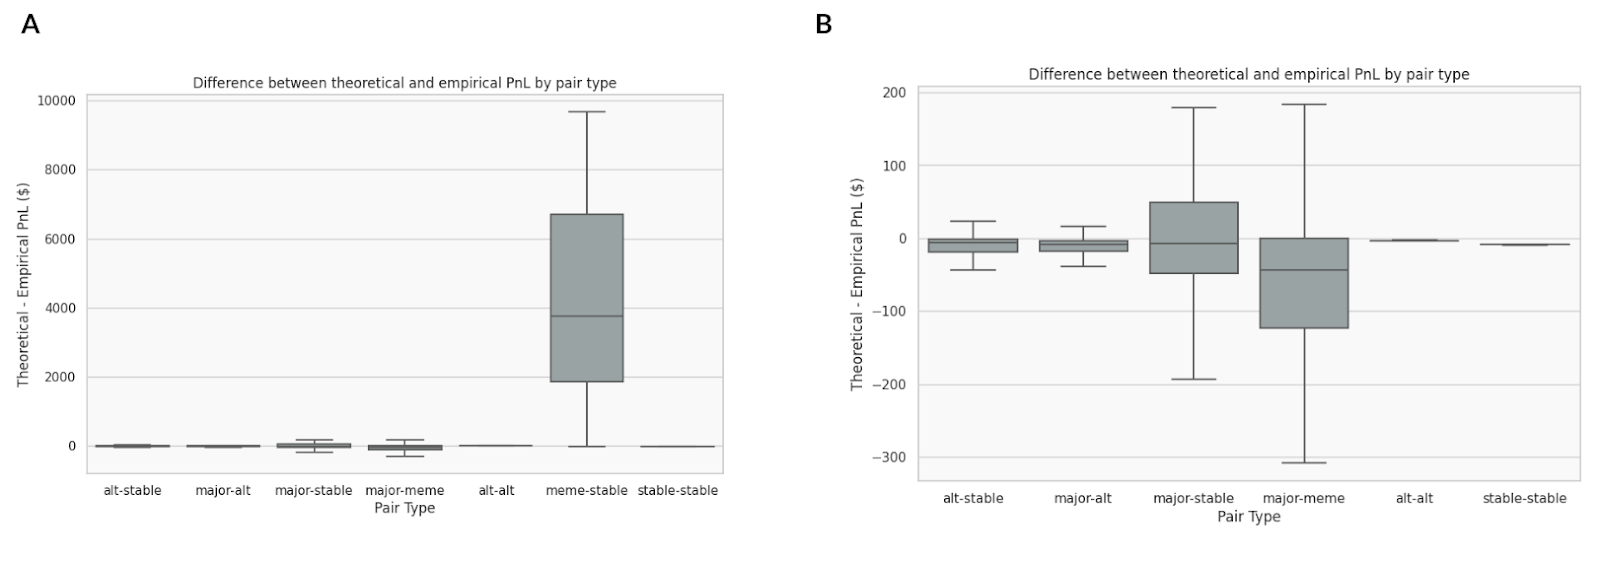
Figure 10. Boxplot distribution of the difference between theoretical and empirical revenues for the different types of asset pair. Difference = Theoretical Revenue (based on the formula) - Empirical Revenue. A. Distribution for all pair types. B. Distribution for all pair types except for meme-stable pairs.
We then grouped the trades into different buckets based on their order sizes to determine the differences between theoretical and empirical profits once again.
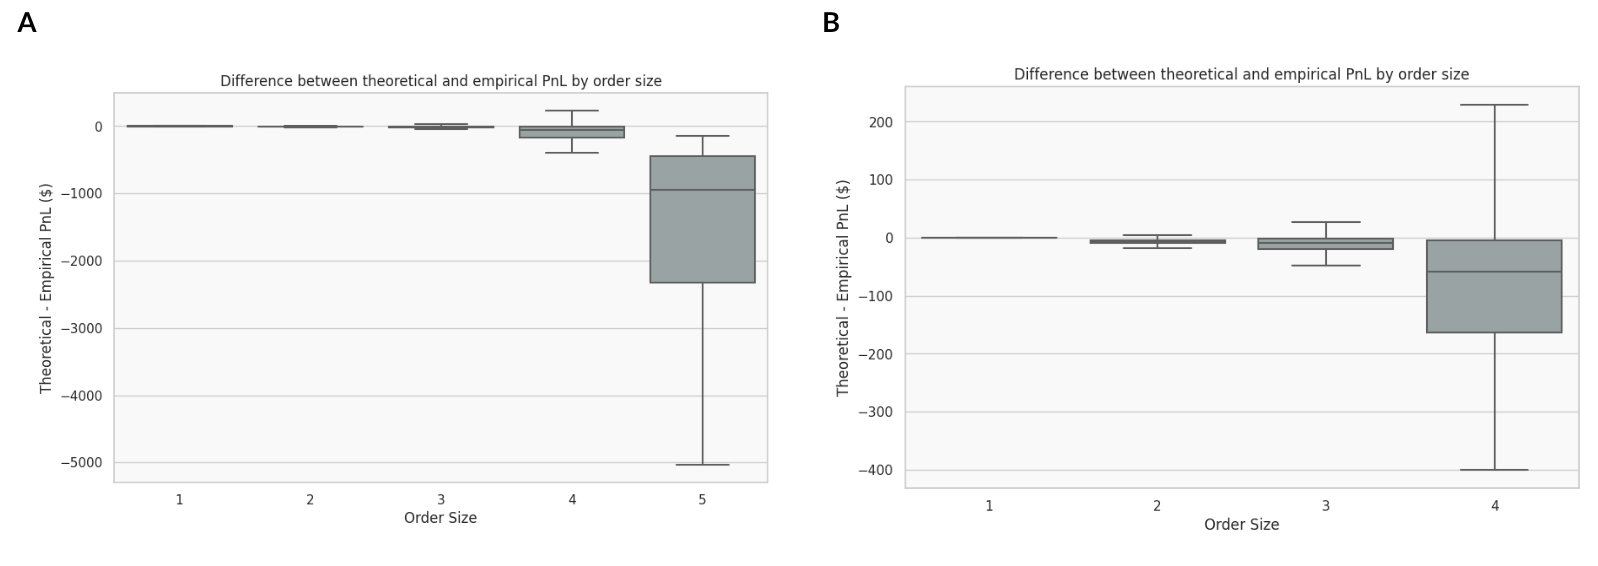
Figure 11. Boxplot distribution of the difference between theoretical and empirical revenues for the different order sizes. Difference = Theoretical Revenue (based on the formula) - Empirical Revenue. A. Distribution for all order sizes. B. Distribution for all order sizes except for order size >$1M.
Interestingly, the larger the transaction, the less likely the model held true. However, this could be due to the larger percentage of CEX <> DEX arbitrages that had alts and memes within the pair, which deviated from the model.
Moving forward, the theoretical model can be improved by adding fees to the calculations which has been recently revisited by Milionis et al (2023).
Conclusion
In this post, we investigated the prevalence of CEX <> DEX arbitrages and shed light on the patterns and insights into these opportunities. By examining the interactions between searchers and builders, estimating the costs and potential revenues, and contrasting it with the theoretical profits using the reserves in the pool, we’ve delved deeper into the dynamics of this market.
Moving forward, we hope that the community can further contribute to this study by exploring other factors such as bidding data and markout analysis over a longer period of time to provide a more comprehensive picture and a robust understanding of the value flow between the Ethereum blockchain and centralized exchanges.
