Summary and TL;DR
The ProbeLab team (probelab.io ) is carrying out a study on the performance of Gossipsub in Ethereum’s P2P network. Following from our previous post on the Ethereum Node Message Propagation Bandwidth Consumption, in this post we investigate Gossipsub’s message propagation latency, i.e., how long it takes to have a message delivered to all nodes in the network. The target of the study is to identify the protocol components that consume the biggest share of network bandwidth. The study has been co-authored by @cortze and @yiannisbot.
For the purposes of this study, we have built a tool called Hermes, which acts as a GossipSub listener and tracer (GitHub - probe-lab/hermes: A Gossipsub listener and tracer.). Hermes subscribes to all relevant pubsub topics and traces all protocol interactions.
Study Description: Message propagation and arrival times are sensitive metrics for blockchain networks. We assume that the message is going to arrive to each peer “as fast as possible”, but in some cases, just because the core of the network achieved fast message delivery time, doesn’t mean that message propagation to the entire network was done in time.
In the particular case of Ethereum, with such strict message delivery deadlines, ensuring the messages arrive within a 4-second window is essential to reduce the probability of forks.
In this study, we will approximate the average message propagation latency throughout the whole network.
TL;DR: Despite a relatively short dataset of 3 days, we could observe with high confidence that:
- 98% of messages arrive prior to the 4-second mark.
- Lodestar seems to be the slowest client in terms of message arrival time, although this could also be related to when the arrivals are traced in the particular implementation.
- Nodes located in or near the core of the network (NA or EU) do have certain advantages when it comes to receiving messages sooner. Although the traced locations do not show any worrying behaviour, it is worth pointing out that extra geographical centralization could exacerbate the differences even further.
Results
The results in this report have been gathered from EF’s Xatu public datasets. We’ve fetched 3 days’ worth of data from the beacon_api_eth_v2_beacon_block table (from the 14th to the 16th of June).
Arrival CDF times within the slot
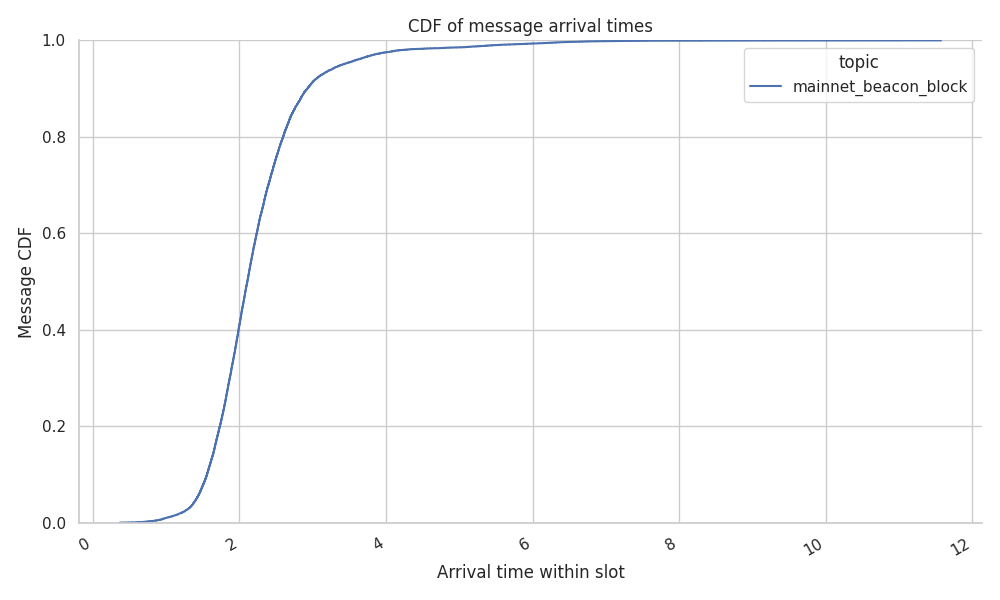
The study starts by calculating the arrival time of all the blocks within the slot that they belong to. The calculation is done based on the slot number and the time since genesis, given that each slot lasts 12 seconds:
time_within_slot = arrival_time - (genesis_time + (slot * 12))
This measurement is crucial, as any block arrival beyond the 4 second mark is likely to generate a fork in some part of the network (as it can start receiving attestations of a non-proposed block).
In this first graph, we observe that 98% of the blocks arrived within the 4-second mark, leaving only the remaining 2% of blocks exceeding it.
The data was originated from the sentry nodes that are under the control of the Ethereum Foundation. These nodes include all the main client implementations in each of the locations, as shown in the following table:
| Continent | Country | Client |
|---|---|---|
| EU | FI | lighthouse |
| lodestar | ||
| nimbus | ||
| prysm | ||
| teku | ||
| NA | US | lighthouse |
| lodestar | ||
| nimbus | ||
| prysm | ||
| teku | ||
| OC | AU | lighthouse |
| lodestar | ||
| nimbus | ||
| prysm | ||
| teku |
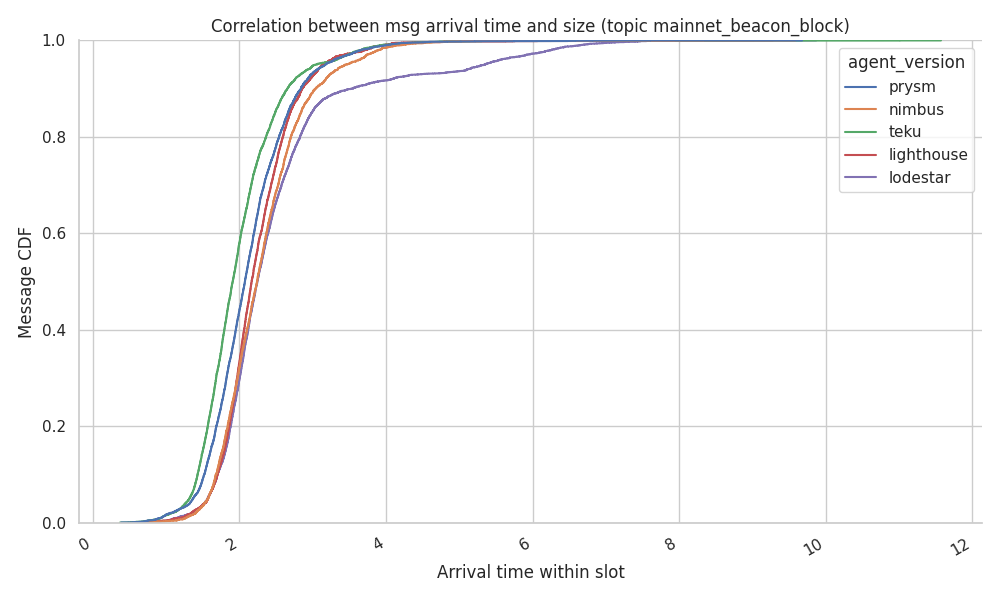
When comparing the arrival times over the different sentry nodes (figure below), we do see slight differences between them. The exception of Lodestar catches our attention, as it has a less uniform tail in its distribution. However, the rest of the clients follow a similar trend, with 99% of messages arriving within the first 4 seconds.
Since this data has been collected from the standard event streamer Beacon API, it is hard to explain the differences within each of the client implementations, as not only the libp2p codebase is written in different languages, but the message arrivals could also be timestamped at different moments of the message validation logic.
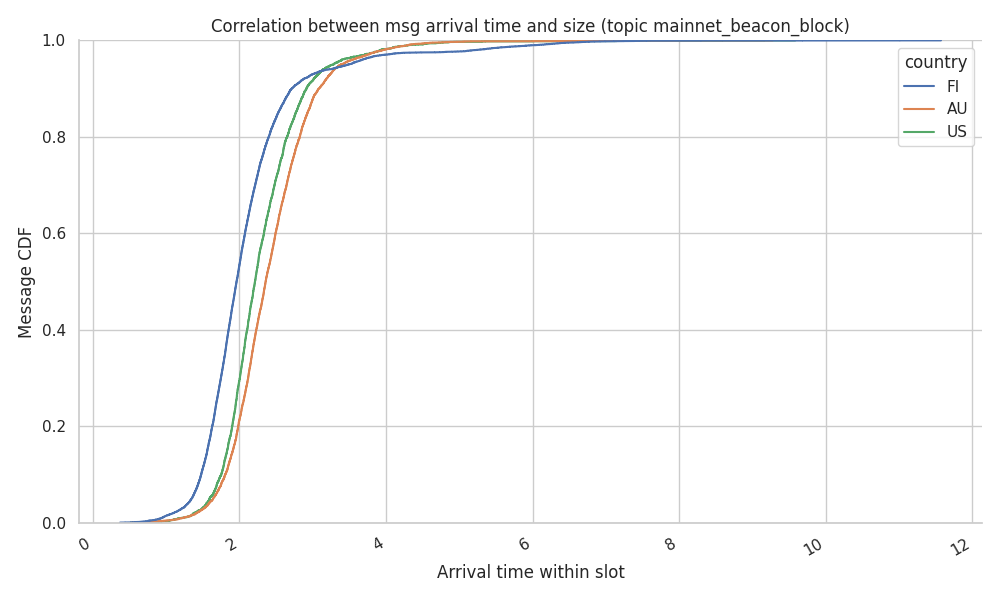
We were expecting to see different arrival times from different geographic locations, as the network geographical distribution seems to be concentrated within European and North American countries (link to the distribution). The following graphs show that although there are indeed differences between countries or continents, they are minimal, with all the CDF distributions showing 98-99% of the block arrivals completing within the 4-second mark.

Arrival times
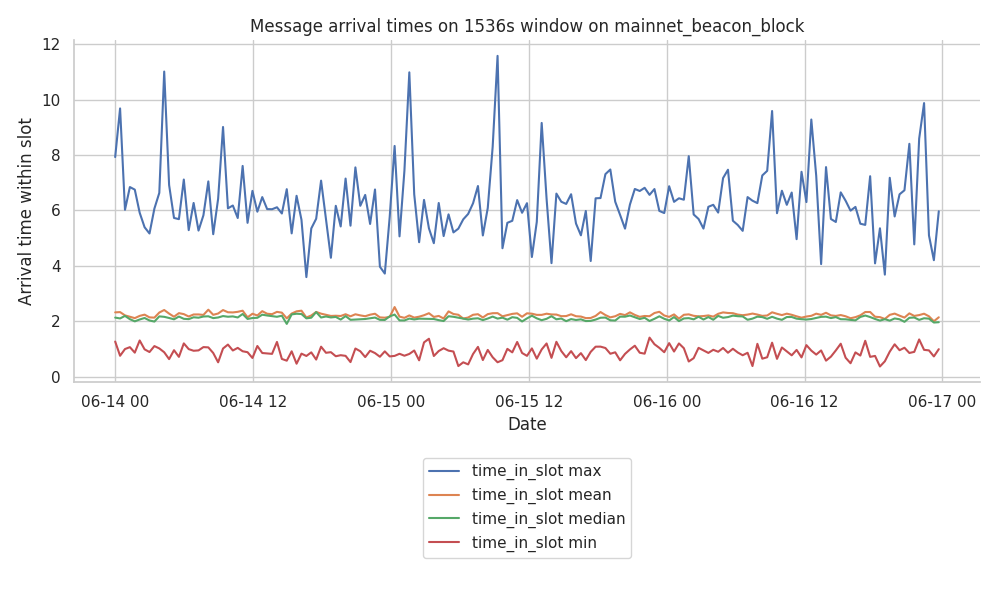
The previous CDFs show that almost all the block arrivals happen within the expected time range. However, the plots do not reveal outliers, as CDFs are not sensitive to sudden network perturbations.
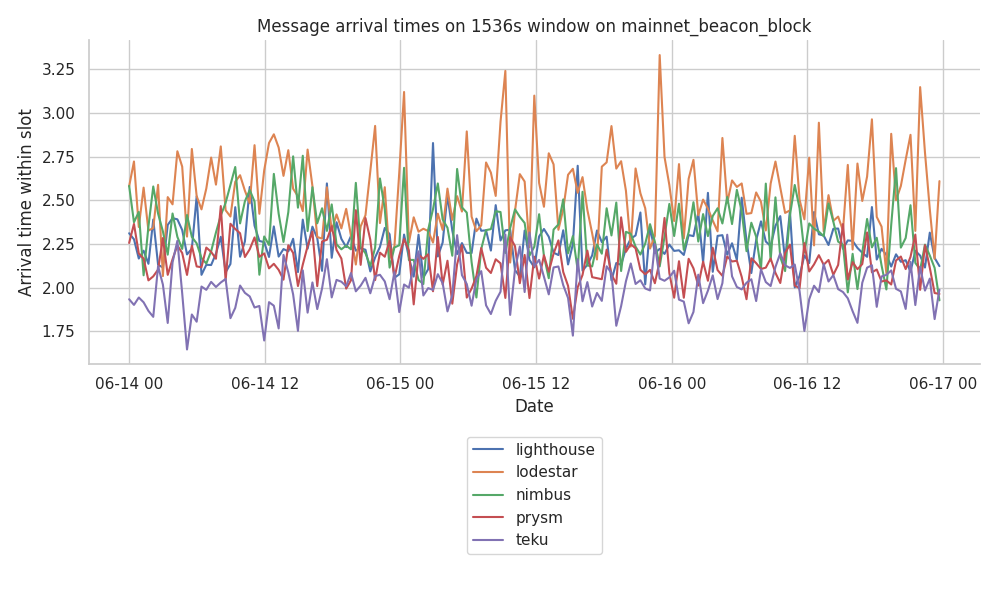
Thus, the following graphs show the maximum, median, mean, and minimum block arrival times on time windows of 4 epochs (1536 seconds).
We do not find large variations in the minimum, mean and the median distributions over the 3 day period. However, we do see that the maximum arrival time does vary quite significantly. We can observe that arrival times vary from 4 seconds to almost 12 seconds, almost exceeding the entire slot duration.
Interestingly, there are differences when comparing the mean arrival times of the different client implementations. Lodestar seems to be the latest one receiving the messages in the mesh and presents quite a high variance, while Teku seems to be the one receiving the messages first, followed by Prysm.
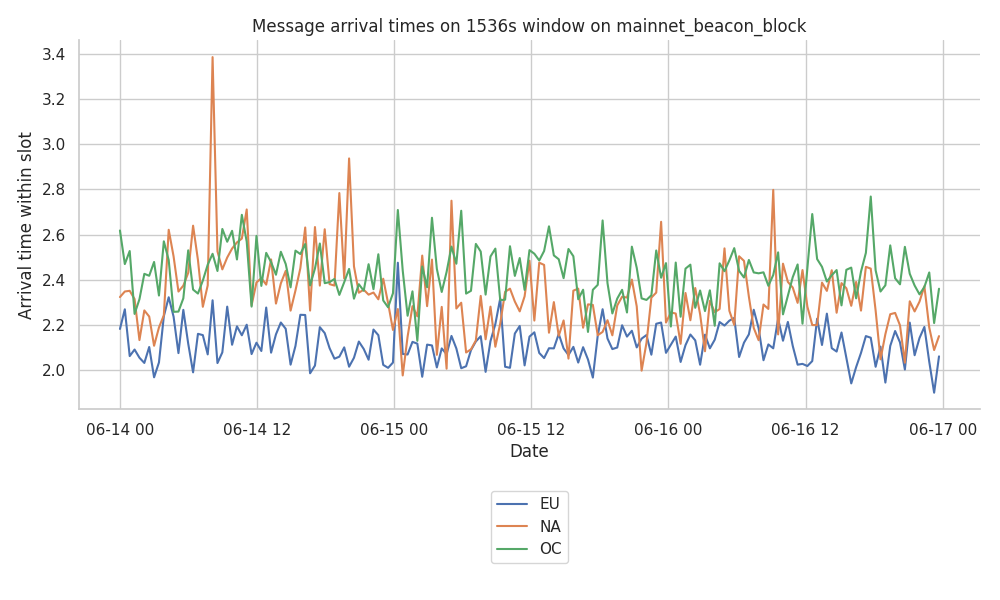
A similar pattern is also observed for the arrival time distribution by continent. As we could anticipate, European nodes receive slightly sooner messages than the North American and the Oceania ones. Although the difference is not significant, 0.6 seconds still keeps the arrival within the safety margins. However, this still showcases that there are some latency incentives to locate nodes in regions with lower latency, or in other words, around the core of the network (which, however, will, in turn, lead to more geographic centralization).
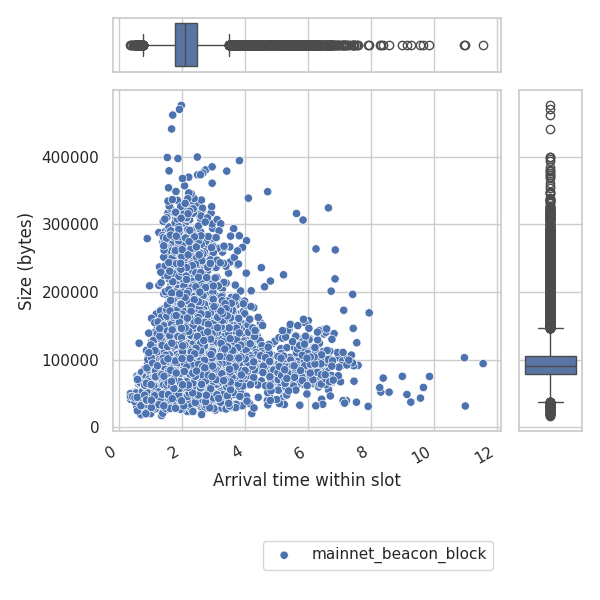
Correlation between arrival times and size of the messages
When attempting to correlate our findings to ones described in the previous ethresear.ch blog post that investigated this issue in particular, we haven’t been able to see any major correlation between size and the arrival time of the blocks. Although the block size distribution achieved in three days isn’t fully representative, the following graph shows that most blocks stay within the 50KB to 150KB range with a similar arrival time of 1 to 3 seconds.
Conclusions and Takeaways
Despite a relatively short dataset of 3.5hrs, we could observe with high confidende that:
- 98% of messages arrive prior to the 4-second mark.
- Lodestar seems to be the slowest client in terms of message arrival time, although this could also be related to when the arrivals are traced in the particular implementation.
- Nodes located in or near the core of the network (NA or EU) do have certain advantages when it comes to receiving messages sooner. Although the traced locations do not show any worrying behaviour, it is worth pointing out that extra geographical centralization could exacerbate the differences even further.
For more details and weekly network health reports on Ethereum’s discv5 DHT network head over to probelab.io.