Authors: BM. Robaglia, U. Natale and M. Moser.
Acknowledgements
This research has been supported by Chorus One.
Goal of this Research
The goal of this research is not only to propose a framework for pricing preconfirmations but also to initiate a constructive discussion within the Ethereum community. Given the evolving nature of preconfirmation mechanisms, there is currently no established approach to pricing, and various trade-offs must be considered. By sharing our methodology, results, and insights, we aim to contribute to an informed decision-making process, enabling node operators, builders, and researchers to collectively shape best practices for this emerging market.
TL;DR
This article provides a first perspective on preconfirmation pricing from a node operator’s perspective, defining inclusion preconfirmations as signed commitments by Ethereum block proposers to include a specific transaction in the next block they propose.
Why Does Preconfirmation Pricing Matter?
- Revenue Opportunity: Properly priced preconfirmations can increase revenue for node operators and stakers.
- Risk of Losses: A naive pricing approach can result in revenue losses, making informed strategies crucial.
- Alternative Strategy: If pricing is not well understood, node operators may be better off not issuing preconfirmations or delegating pricing to a third party.
Methodology & Model Design - Transaction Selection: We categorise transactions based on their positioning in the block, showing that mid-block transactions are the most suitable for modeling preconfirmation pricing. - Prediction Approach: Instead of directly pricing preconfirmations (which lacks historical data and a structured framework), we predict a priority fee per gas (PF/GU) threshold, ensuring that preconfirmations are granted only when they compensate for inclusion risk. - Justification for this Approach: 1. Managing PF Volatility: Helps builders and proposers stabilise priority fee fluctuations. 2. Lack of Historical Data: Direct pricing is infeasible due to missing data for backtesting and unclear slashing policies. Models & Evaluation - We implement and test three different models for preconfirmation pricing: 1. Quantile Heuristic: Uses the GETH Suggest Price function as a threshold. 2. Linear Regression: Predicts PF/GU using a set of block and transaction features. 3. Random Forest: Captures non-linear relationships and complex dependencies in the data. - We highlight the most influential model features for predicting preconfirmations. - Dataset: Over 5 million historical transactions were used for training and evaluation. Results & Reproducibility - We present a detailed performance evaluation for each model. - To ensure transparency and further analysis, we provide: - An interactive dashboard with visualisations. - Full open-source code for reproducibility: GitHub Repository.
About Chorus One
Chorus One is one of the biggest institutional staking providers globally operating infrastructure for 60+ Proof-of-Stake networks including Ethereum, Cosmos, Solana, Avalanche, and Near amongst others. Since 2018, we have been at the forefront of the PoS industry and now offer easy enterprise-grade staking solutions, industry-leading research, and also invest in some of the most cutting-edge protocols through Chorus Ventures.
Parameter Assessment
In this section, we want to assess if the gas used is priced always in the same way within the block.
Our assumption is that, in terms of block value optimisation, if a transaction arrives when the block is 2/3 full, it is priced differently with respect to the same transaction arriving when the block is 1/3 full. This is because, when there is only 1/3 of gas available in a block, the block builder is incentivised to “append” transactions using less gas and paying more in priority fee (PF). It is important to note that this is a heuristic designed to approximate a potential dynamic within a preconfirmation framework. Since block data does not provide the exact time of transaction arrival, the patterns we observe and quantify may partially reflect the builder’s strategic behavior rather than purely timing effects. Nevertheless, in a preconfirmation framework, it is reasonable to assume a time-dependent strategy, where transactions arriving later are prioritised differently. Even in the case of preconfirmations happening in slot N-1, we have to account for usual block builder behaviour in terms of block construction since our main objective is to give preconfirmation of transaction without disrupting builder optimisation. In other words, we want to guarantee EV_\textrm{preconf} \ge EV_{MEV-Boost}\,. Our first objective is to statistically quantify dependencies of priority fees over gas used for transactions and their position in the slot.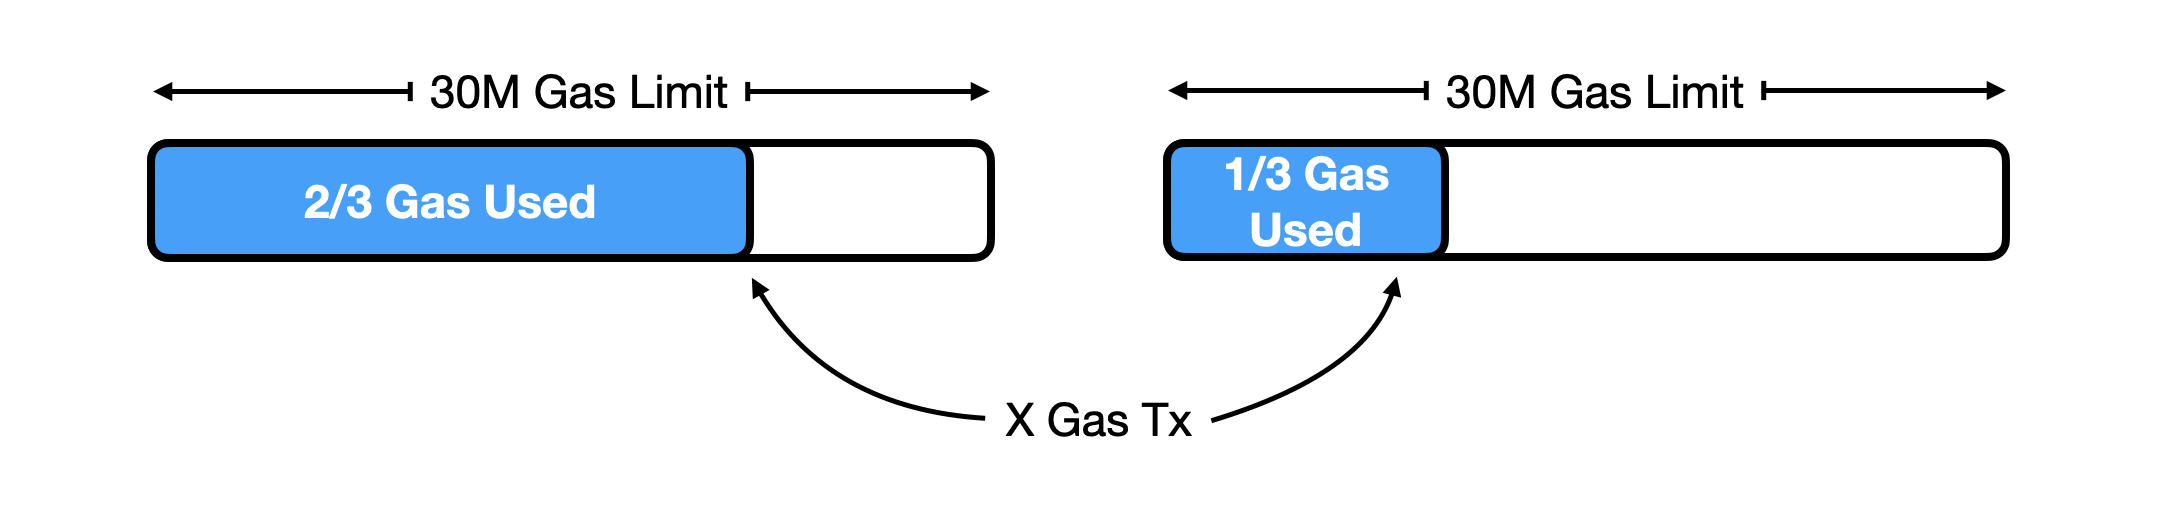
Gas dependency
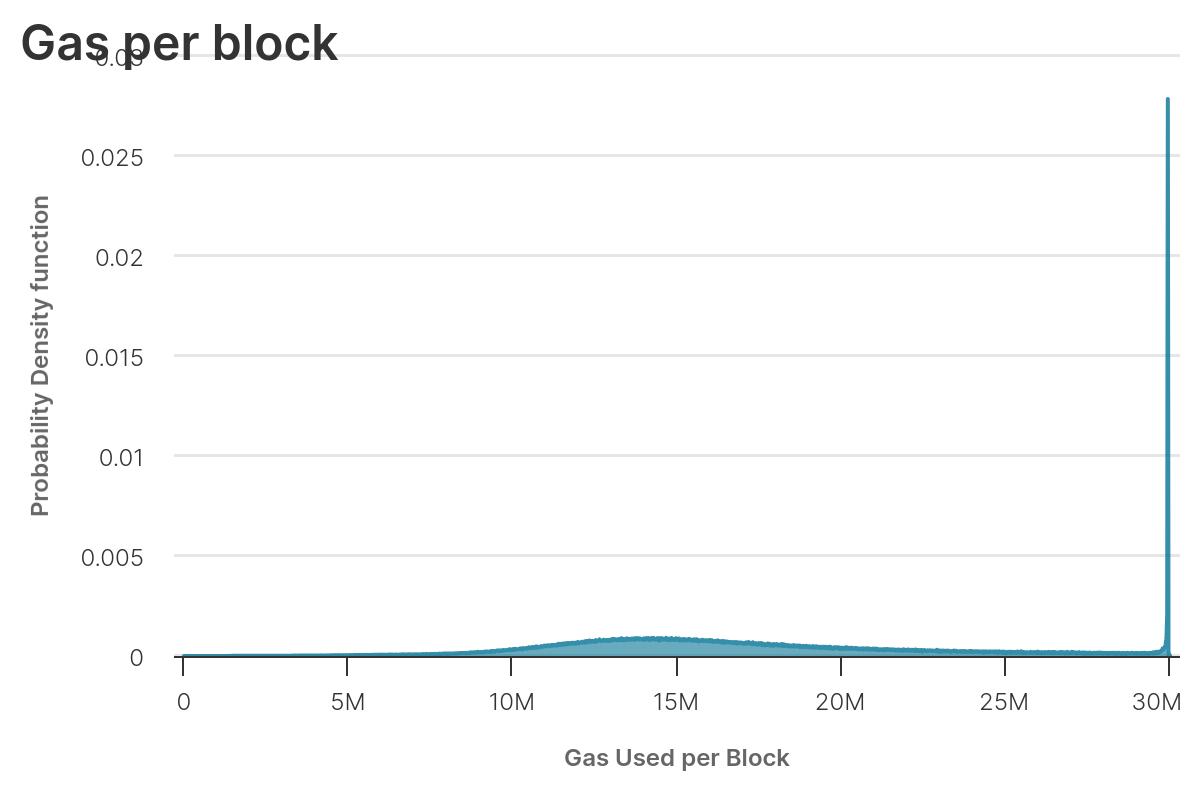
In order to acquire information about the gas per transaction as their position in the block, we can consider two sets of blocks:
- blocks with gas used between 14M and 16M
- blocks with gas used greater than 29M
In both cases, we can categorise transactions by their position in the block. Precisely, we define
- Tier1: transactions below the 10th position
- Tier2: transactions between 10th and 50th positions
- Tier3: transactions above the 50th position
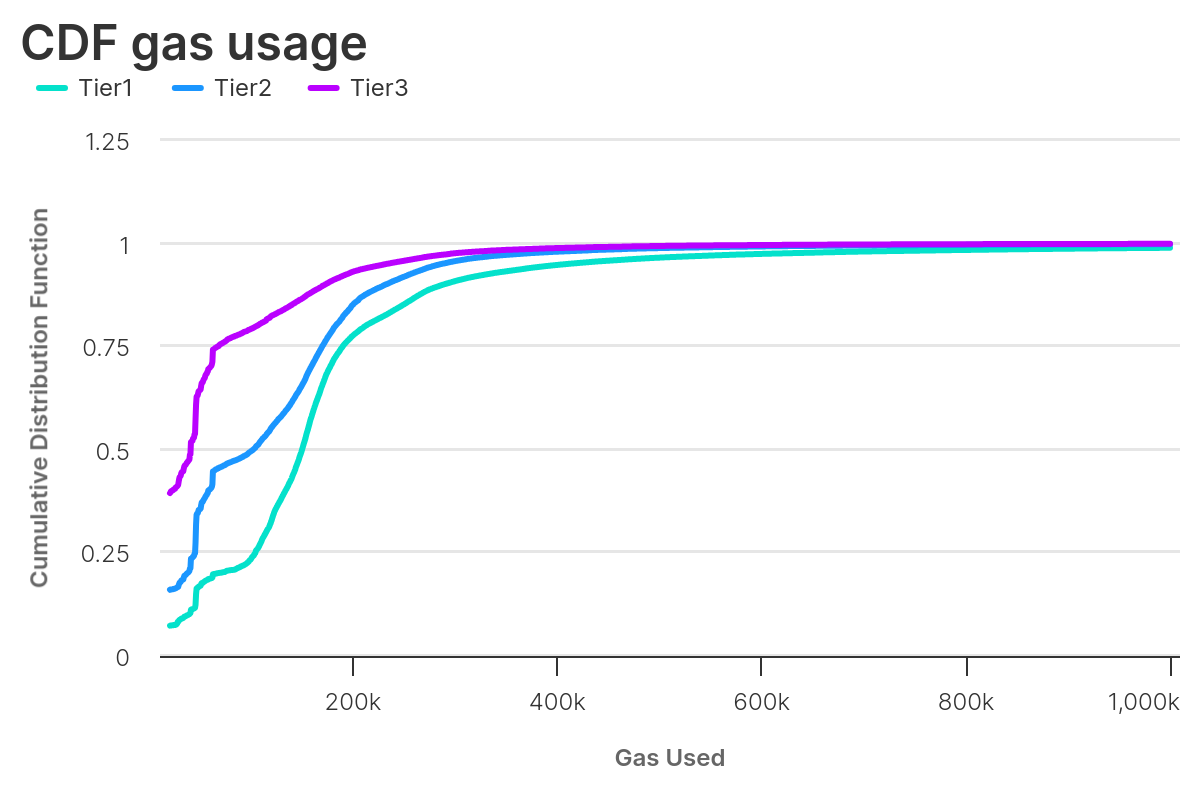
We can see how the transactions in the top 10 generally use more gas. The respective cumulative distribution functions (CDF) show that, the higher the position in the block, the higher the likelihood a transaction uses relatively less gas — consistent with our initial assumption.
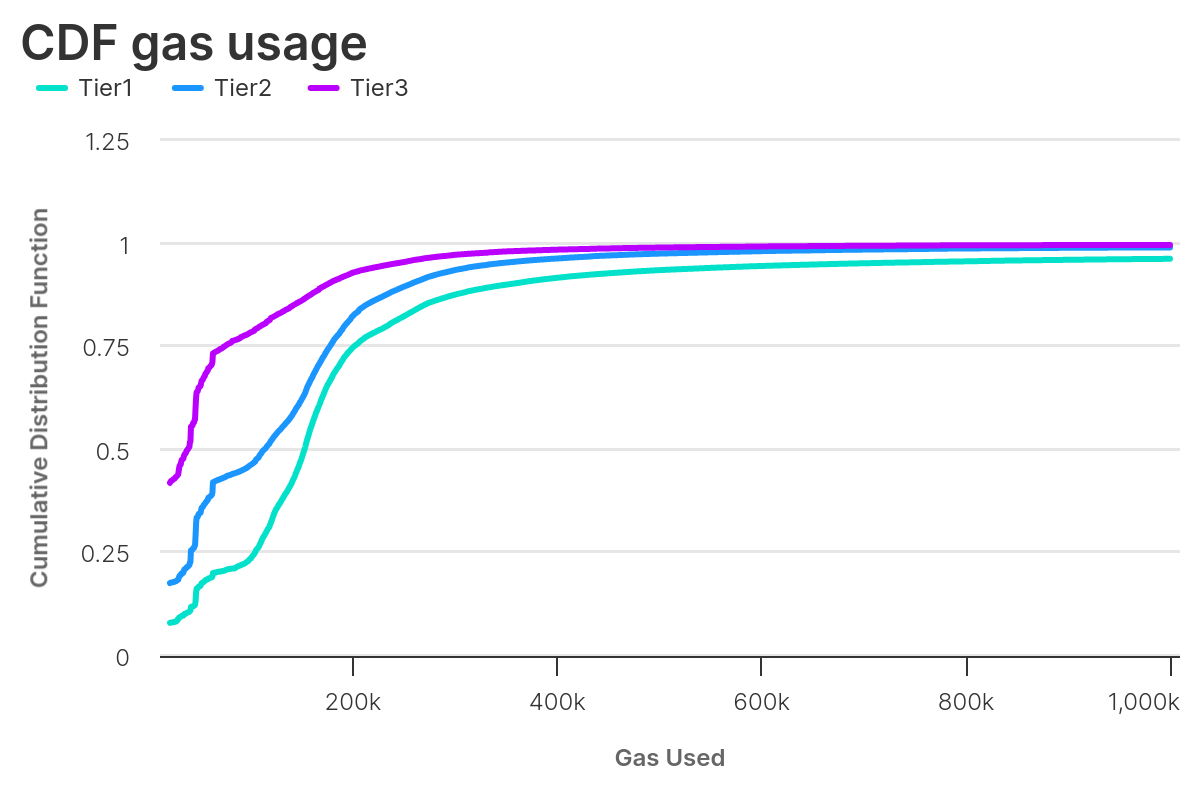
This pattern doesn’t change if we consider only blocks with gas used greater than 29M. The only exception is that, for such large blocks, there is still a 4% probability Tier1 transactions use gas greater than 1M.
If we breakdown by transaction topology type
0xa9059cbb: Transfer0x095ea7b3: Approve0x23b872dd: TransferFrom0x2e7ba0ef: Claim0x415565b0: TransformERC200xa22cb465: SetApprovalForAll0x2a6a935d: SetSkipNFT0x2e1a7d4d: Withdraw0x: ETH Transfers- Others
we can see that the cause of the Tier1 behaviour is due to the different gas consumption for Withdraw and Others topology.
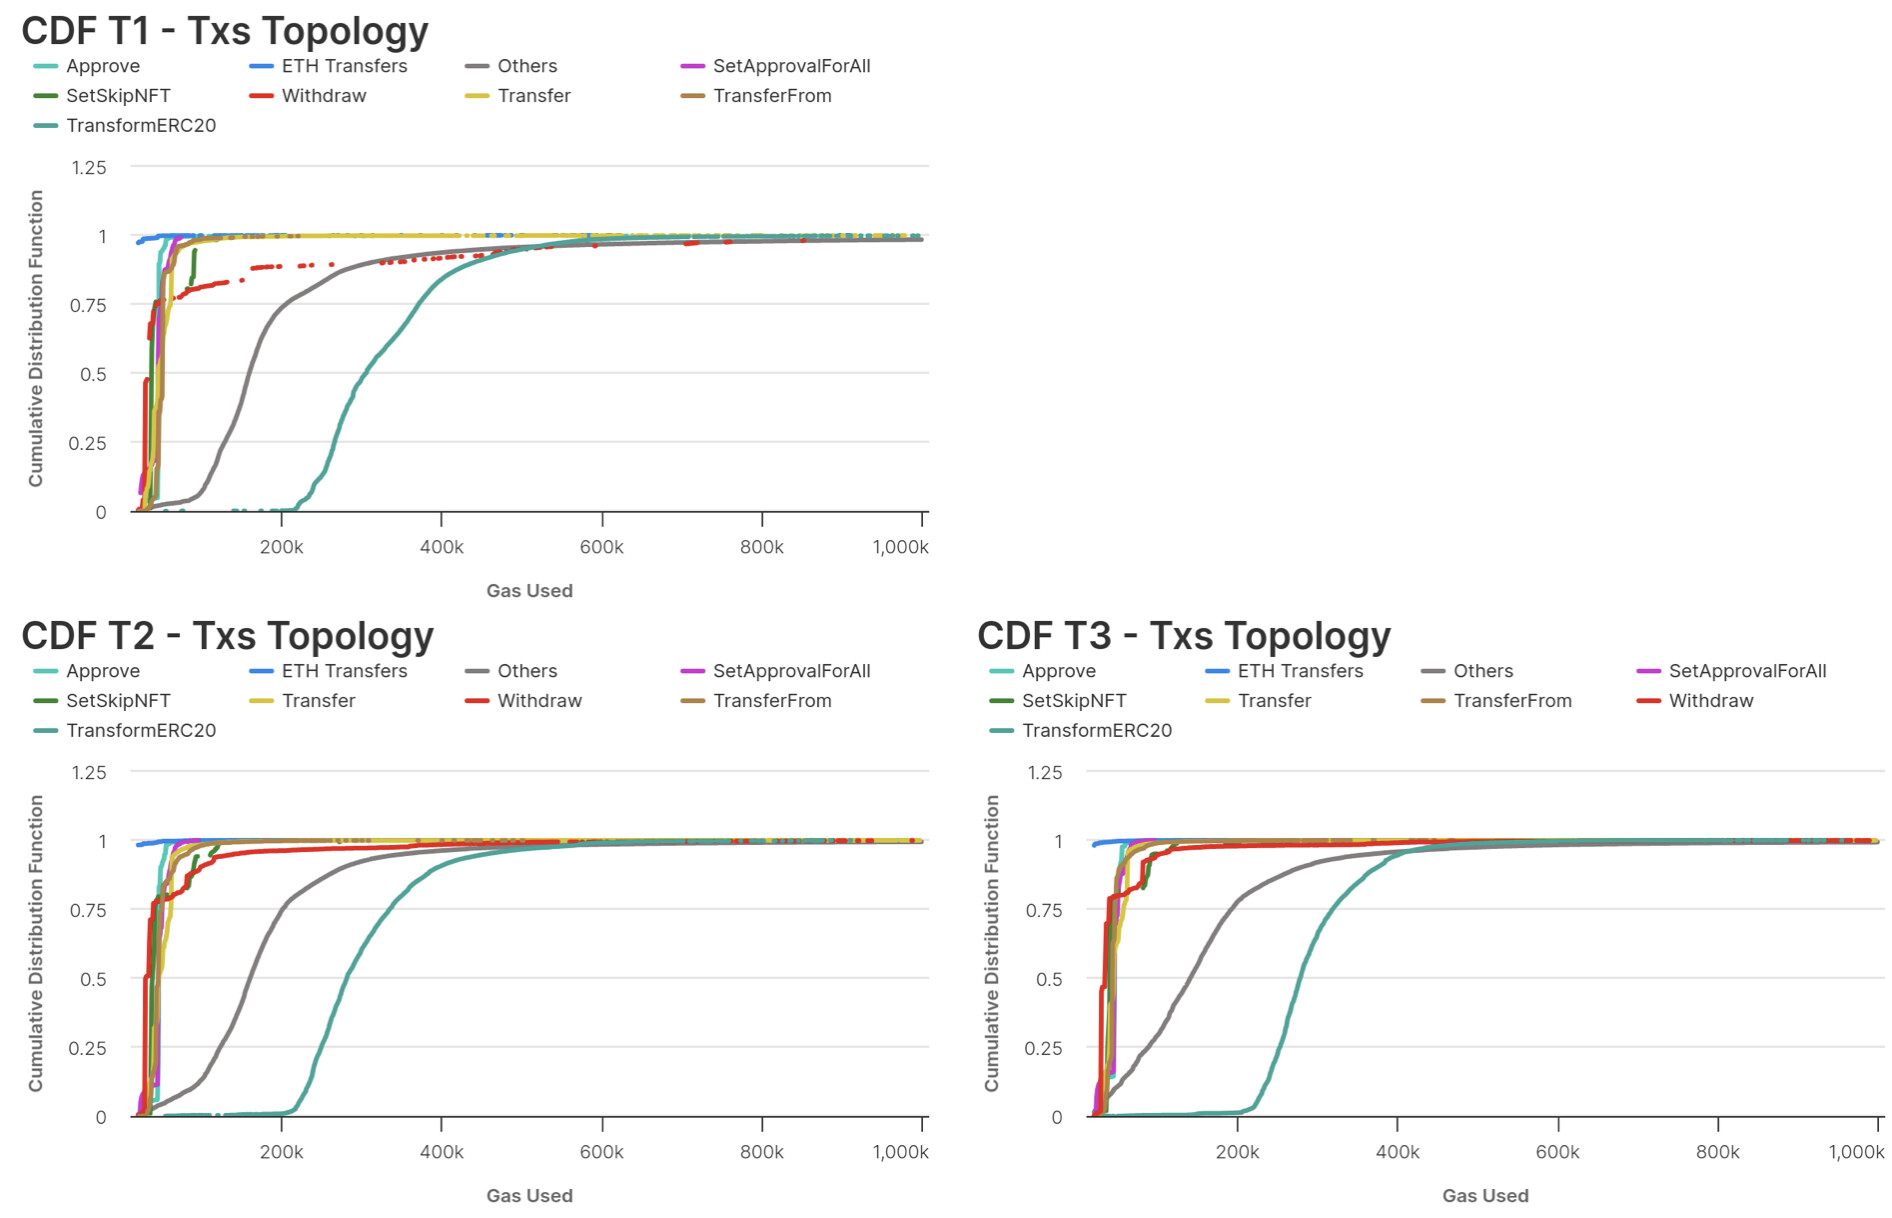
The Kolmogorov-Smirnov test, performed on the three tiers grouping by same topology, indicates that all datasets are not drawn from the same underlying distribution. In other words, gas used for each type of transaction depends on the tier considered. The only exception, with p-values equal to 0.37, is for ETH Transfers type of transactions between Tier2 and Tier3, where we can’t reject the null hypothesis.
Also by changing the tier definition, we are not able to find sets that are statistically consistent each other, cfr. query. This result is in agreement with the idea that, the more transactions enter the block, the higher is the share of gas used over the gas limit, the lower has to be the the gas of the next transaction.
At this point we are left with an arbitrary choice on the tiers definition. We decided to use the following one:
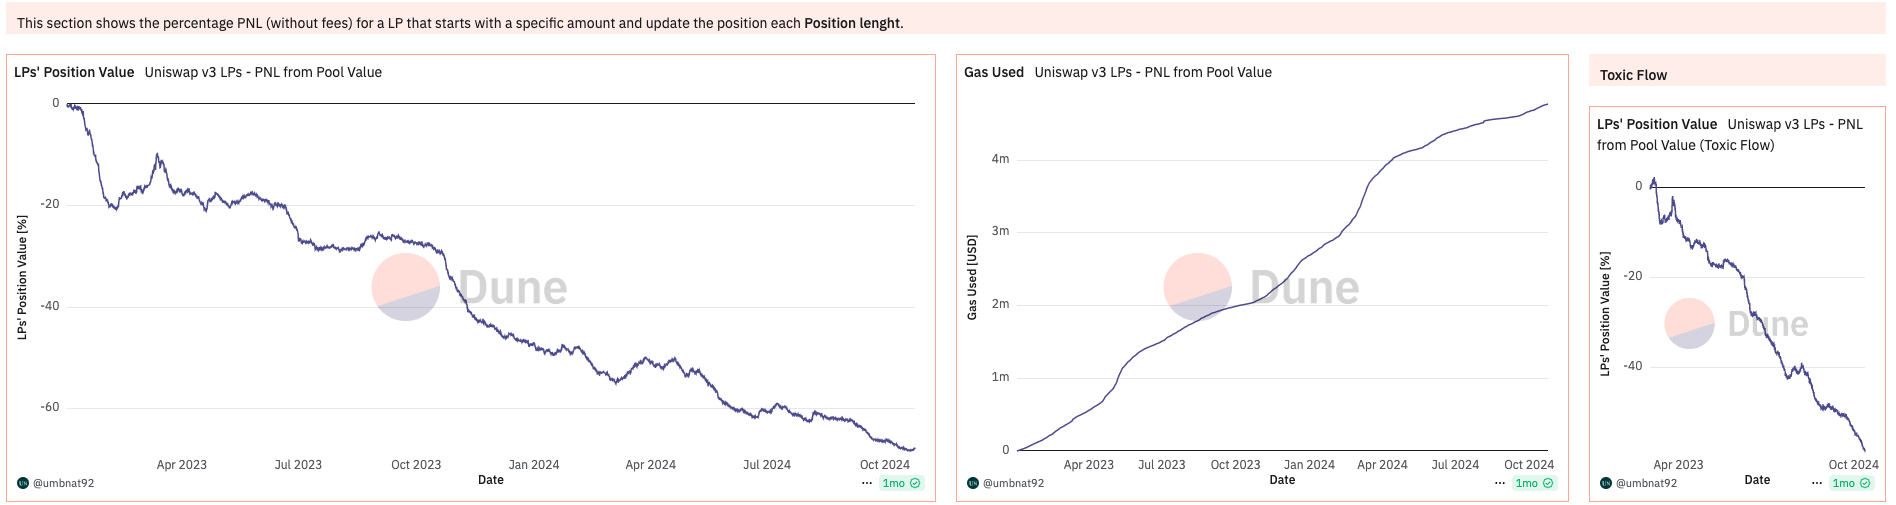
- Tier1: transactions below the 10th position. We used this definition since it can be shown that first 10 transactions in a block are the one responsible for majority of toxic-flow, cfr. Dune query. We have also shown how this group is the one differing the most from the other, signaling a different channel for transactions processing.
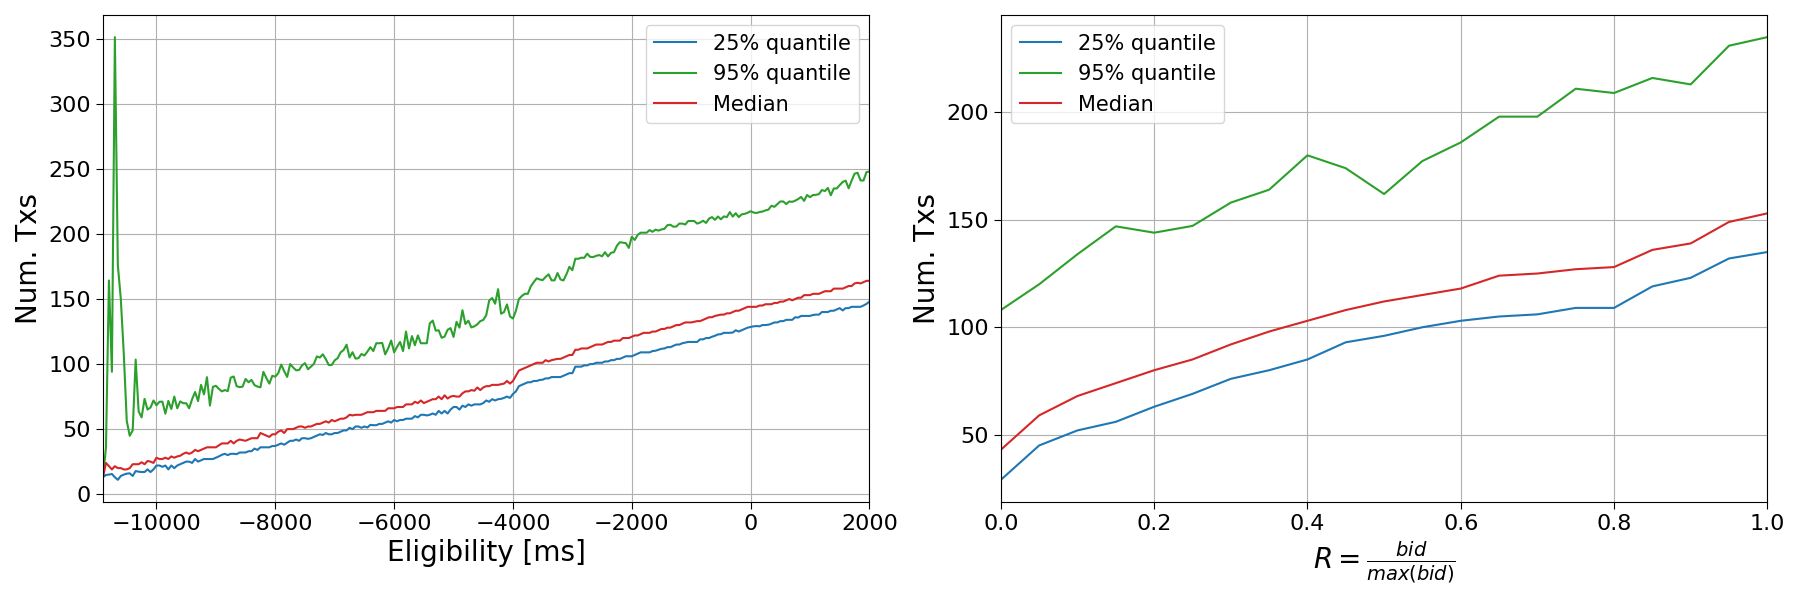
- Tier2: transactions between 10th and 150th positions. This choice is made because we previously shown that 2s before the start of the block, the builder already have more than 100 tx included in the bid shared via MEV-Boost, cfr. Natale et al. The 150 value is chosen to reflect the median number of transactions included in a block.
- Tier3: transactions above the 150th position.
Priority Fee per Unit of Gas
If we compute the CDF for this new definition of tiers, focusing on the PF per unit of gas, we can see how Tier1 transactions are paying the most in PF per unit of gas.
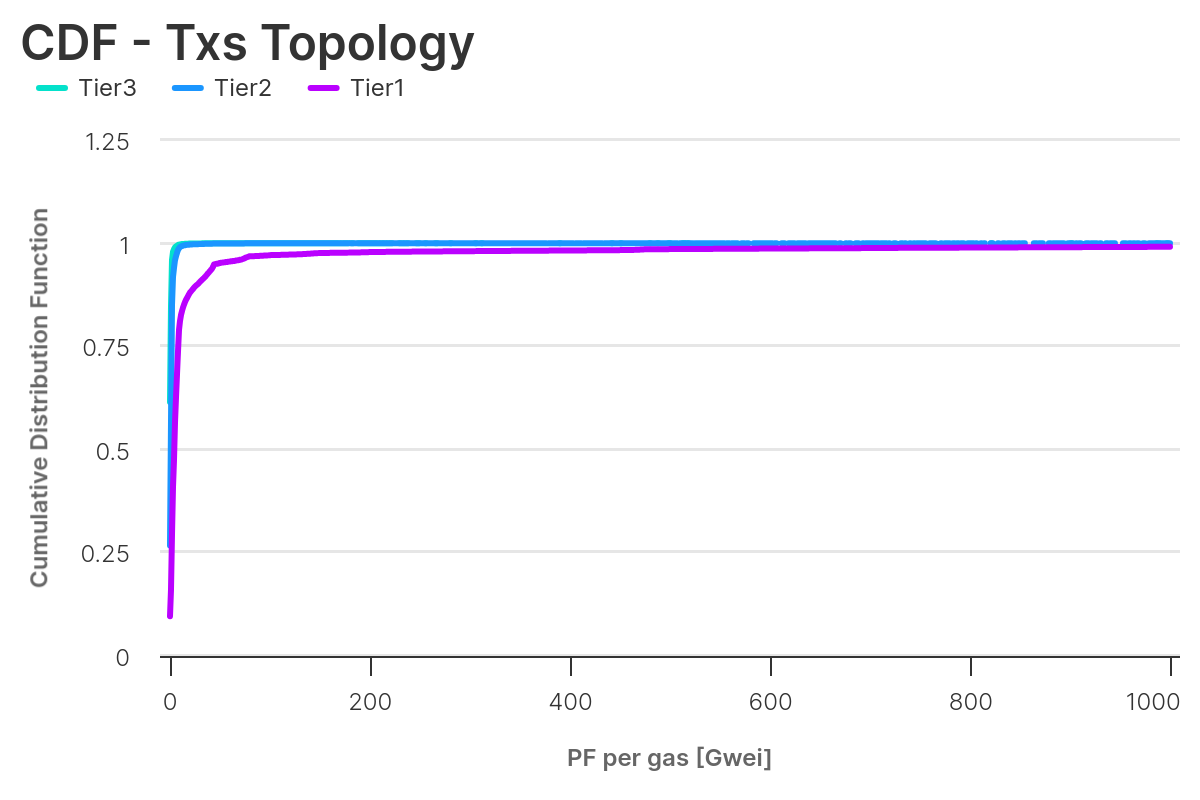
If we repeat the breakdown by transaction type, we can see how transactions in Tier1 clearly pay a premium in PF per unit of gas consumed. This implies that, by accounting for these transactions in the dataset we use to forecast preconfirmation price, we will likely bias the result. There is also a difference between Tier2 and Tier3, with Tier2 transactions paying slightly more per unit of gas consumed. It is worth noting that, as shown previously, Tier2 transactions usually consume more gas versus Tier3.
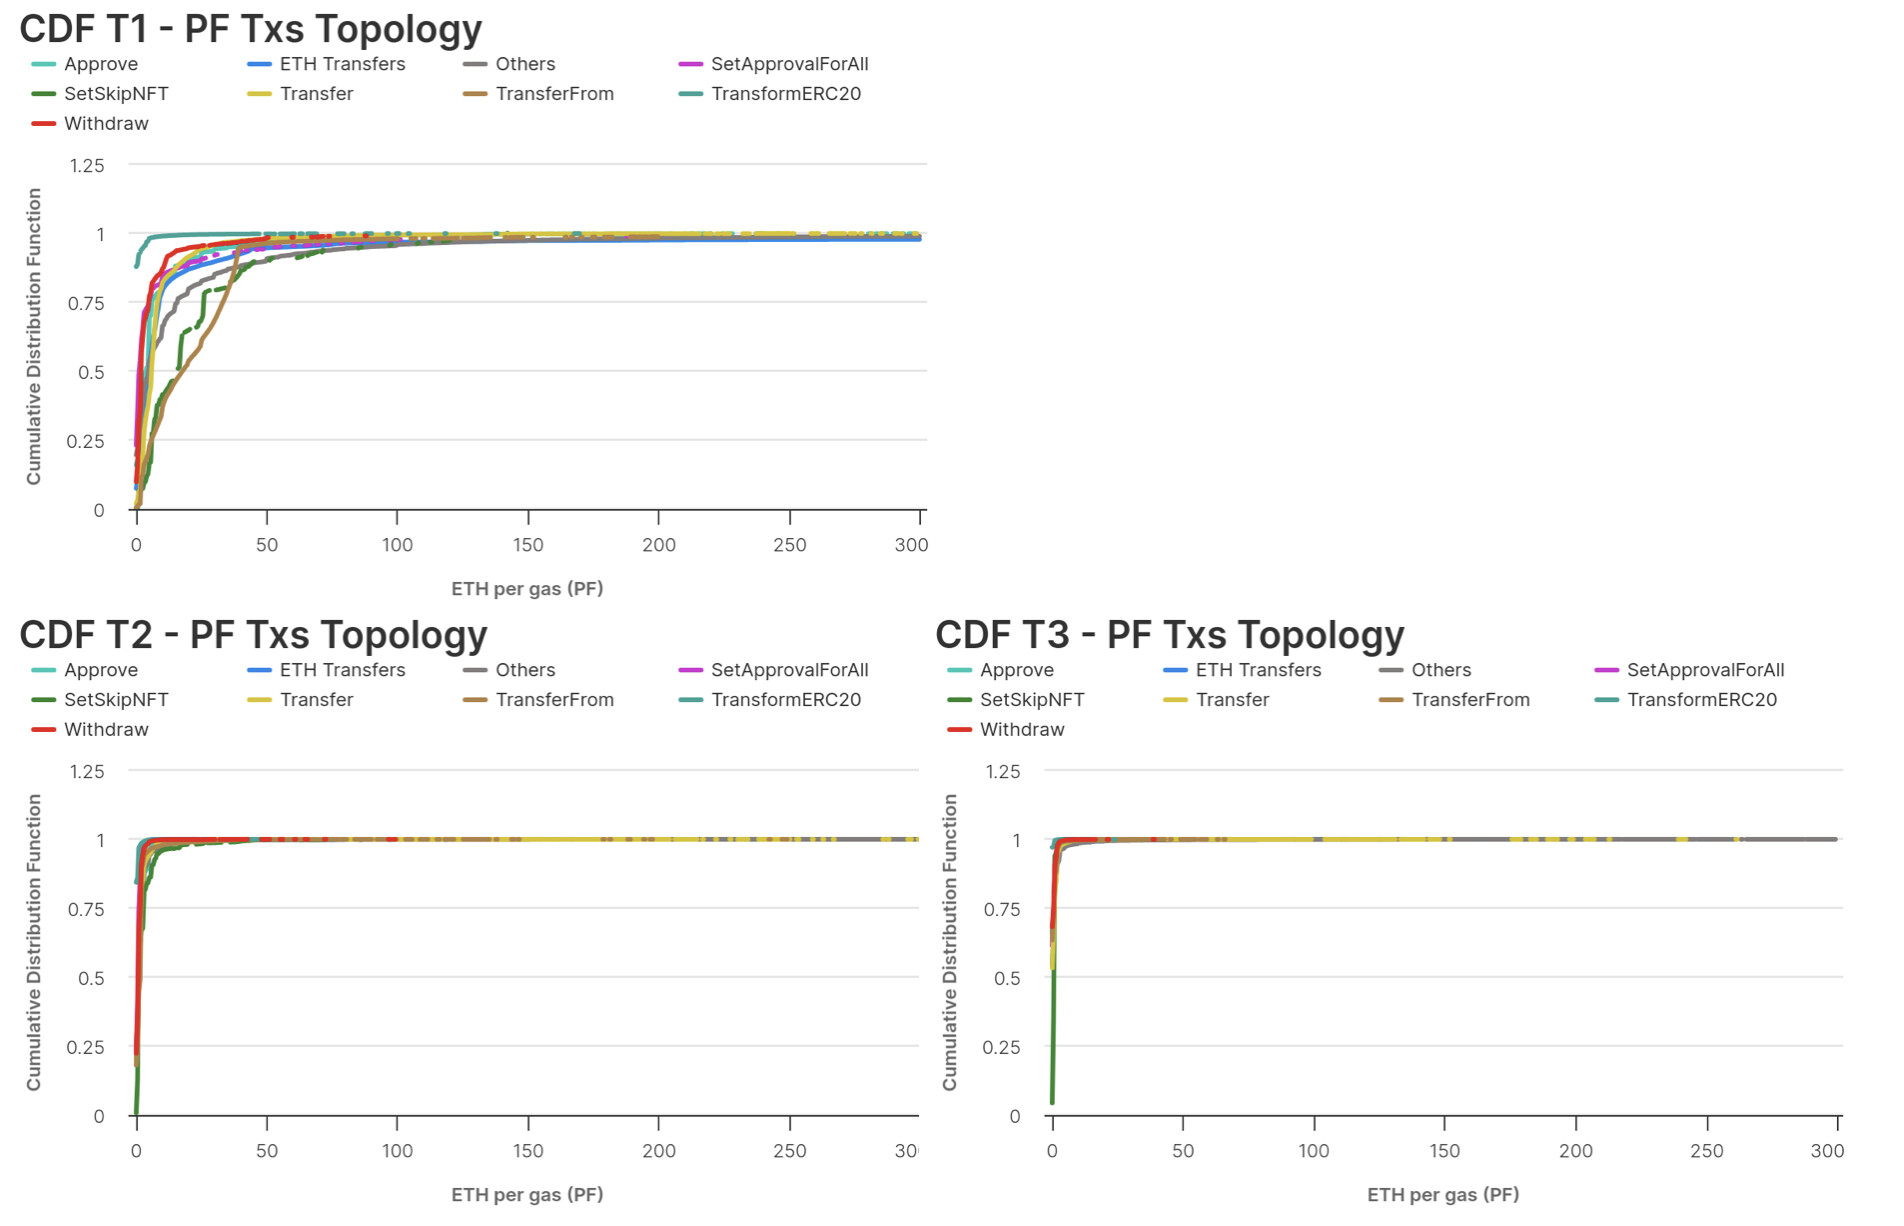
With this analysis, we show that Tier2 is the set we can use to train our model. Indeed, by excluding Tier1 transactions we can reduce the bias of transactions coming from either private order-flow and from MEV. Additionally, by excluding Tier3 transactions, we account for a premium in pricing transactions arriving late, and we also account for the distribution of PF for transactions usually entering in a block (i.e. the median number of transactions in a block is ~150).
Problem Formulation
In the previous section we quantified the dependency of gas used and priority fee from position in the block and transaction topology. In this section we are going to describe the model used to predict a threshold T for PF/GU (priority fee over gas used).
Our idea is to evaluate the viability of model prediction to dynamically determine if a transaction is pre-confirmed without altering the value of the block. Thus, in our model, a transaction tx is pre-confirmed if: \frac{PF_{tx}}{GU_{tx}} > T.
We denote \rho_{tx}(T) = \frac{PF_{tx}}{GU_{tx}}- T as the preconfirmation error. The goal is to accurately estimate T by minimizing pre-confirmation errors while maximizing the number of preconfirmed transactions.
Models
The main problem with preconfirmations is that it does not exist a dataset on which we can test if our model has good accuracy. In this framework then it is difficult to assess the quality of a predictive model.
We adopt as a benchmark model the GETH suggest price function (GETH), a quantile heuristic where a quantile of past PF/GU values as the threshold is used. We compare the GETH with:
- Linear Regression (LR): Predicts T using a linear model of historical transaction data.
- Random Forest (RF): Uses an ensemble of decision trees to capture non-linear patterns.
Metrics
- Mean Absolute Error (MAE): Measures the average deviation between predicted \hat{T} and actual T:
- Average Preconfirmed Error: Captures losses from incorrect pre-confirmations:
- Percentage of Eligible Transactions: Tracks the share of transactions that meet the pre-confirmation condition.
Dataset
For the simulations, we use data between blocks 21,303,934 and 21,332,578 totalling 5,259,656 transactions.
We build the following features to compute our estimators:
Block related features
block_gas_used_lag_1: the total amount of gas used in the previous blocktx_count_lag_1: the number of transactions in the previous block
Aggregated features per block_number and tx_topology:
mean_priority_fee_per_gas: Average PF/GUmin_priority_fee_per_gas: minimum PF/GUmax_priority_fee_per_gas: maximum PF/GUskew_priority_fee_per_gas: Skew of the PF/GU distributionq{quantile}_priority_fee_per_gasQuantile{quantile}of the PF/GU
We also consider lags of these features to account for the dynamics of the markets.
Simulation Results
The learning algorithms have been trained using the scikit-learn library.
- The training has been done for all transactions between blocks 21,303,934 and 21,318,256.
- Features:
- Linear Regression:
block_gas_used_lag_1,tx_topology - Random Forest:
block_gas_used_lag_1,tx_count_lag_1,mean_priority_fee_per_gas,min_priority_fee_per_gas,max_priority_fee_per_gas,skew_priority_fee_per_gas - We also add lags of the target to the features.
- Linear Regression:
The following tables display results for transactions between blocks 21,318,257 and 21,332,578.
| GETH SuggestPrice | MAE (Gwei) | Preconfirmation Error (Gwei) | % Preconf Txs |
|---|---|---|---|
| q10 | 0.49 | 1.859 | 81.657 |
| q20 | 0.539 | 1.613 | 77.233 |
| q30 | 0.495 | 1.372 | 70.724 |
| q40 | 0.42 | 1.184 | 62.451 |
| q50 | 0.402 | 1.049 | 48.528 |
| q60 | 0.465 | 0.945 | 38.022 |
| q70 | 0.57 | 0.846 | 29.29 |
| q80 | 0.885 | 0.741 | 18.14 |
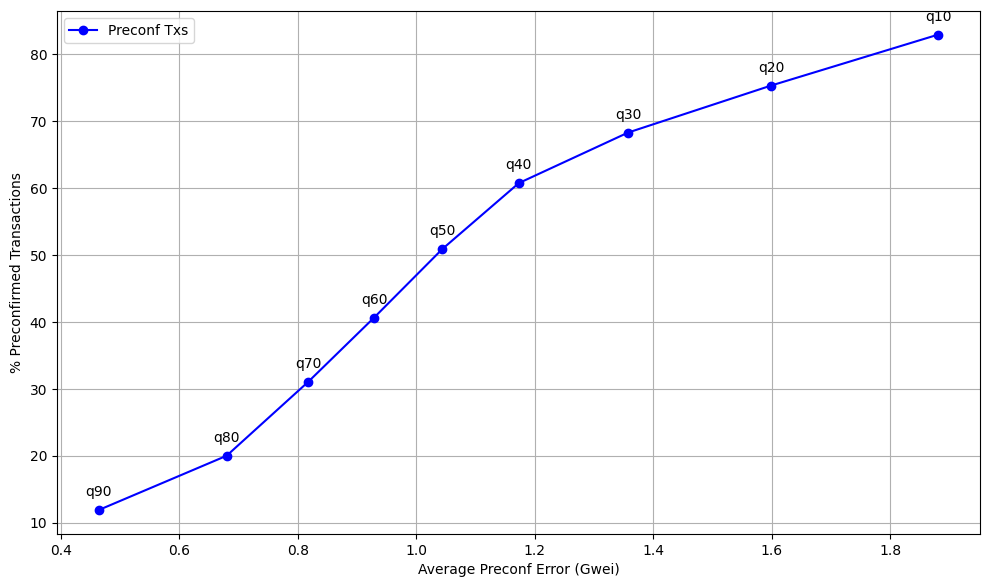
| q90 | 1.763 | 0.584 | 10.536 |
Table 1: Simulation results for different quantile heuristics (32 lags).
| Quantile Target | MAE (Gwei) | Preconfirmation Error (Gwei) | % Preconf Txs |
|---|---|---|---|
| q10 | 0.55 | 1.994 | 82.604 |
| q20 | 0.567 | 1.717 | 73.996 |
| q30 | 0.536 | 1.468 | 67.632 |
| q40 | 0.449 | 1.273 | 59.693 |
| q50 | 0.422 | 1.137 | 42.563 |
| q60 | 0.531 | 1.036 | 29.829 |
| q70 | 0.717 | 0.942 | 23.259 |
| q80 | 1.207 | 0.815 | 16.599 |
| q90 | 2.197 | 0.599 | 11.027 |
Table 2 Simulation results for the Linear Regression model for different quantile targets (5 lags).
| Quantile Target | MAE (Gwei) | Preconfirmation Error (Gwei) | % Preconf Txs |
|---|---|---|---|
| q10 | 0.452 | 2.192 | 85.263 |
| q20 | 0.485 | 1.869 | 80.996 |
| q30 | 0.426 | 1.561 | 70.171 |
| q40 | 0.32 | 1.342 | 65.135 |
| q50 | 0.212 | 1.202 | 53.805 |
| q60 | 0.235 | 1.109 | 38.486 |
| q70 | 0.419 | 1.011 | 27.953 |
| q80 | 0.82 | 0.85 | 18.99 |
| q90 | 1.675 | 0.603 | 10.822 |
Table 3 Simulation results for the Random Forest Regression model for different quantile targets (5 lags).
| Quantile | MAE (Gwei) | Preconfirmation Error (Gwei) | % Preconf Txs |
|---|---|---|---|
| q10 | 0 | 1.814 | 82.755 |
| q20 | 0 | 1.551 | 71.858 |
| q30 | 0 | 1.308 | 61.741 |
| q40 | 0 | 1.128 | 51.558 |
| q50 | 0 | 0.995 | 41.14 |
| q60 | 0 | 0.883 | 32.005 |
| q70 | 0 | 0.774 | 23.338 |
| q80 | 0 | 0.648 | 15.882 |
| q90 | 0 | 0.453 | 9.152 |
Table 4: Simulation results for the "oracle estimator" — the ideal case that assumes access to the future quantile distribution, representing an upper bound for performance.
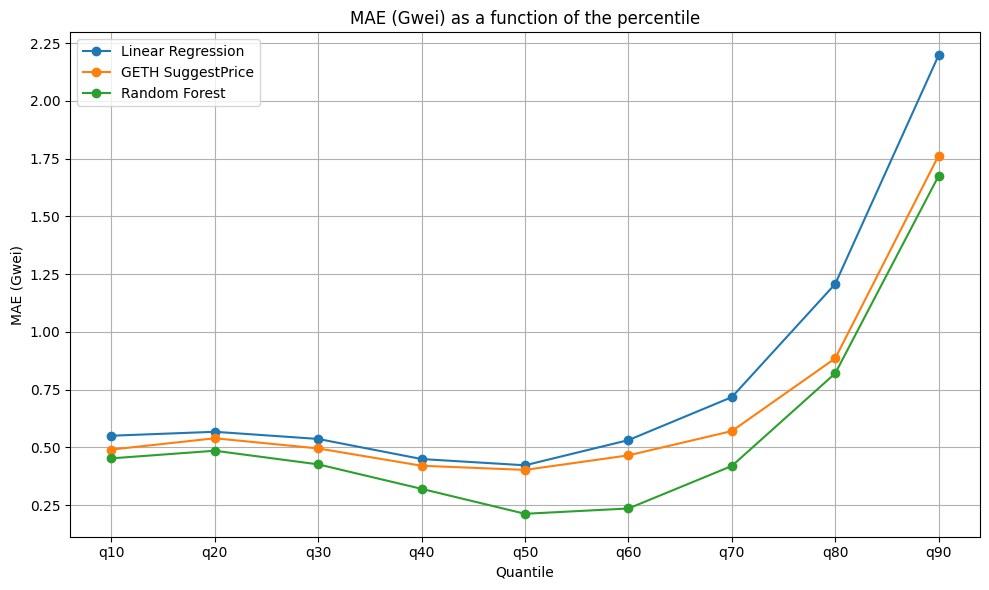
First, for all estimators, we observe that the smaller the quantile used as a threshold, the greater the proportion of preconfirmed transactions, but also the higher the preconfirmation error. This outcome is expected: as the threshold decreases, more transactions qualify for preconfirmation, but this comes at the cost of reduced precision, leading to larger errors.
Second, the Random Forest Regression model demonstrates superior performance compared to the Linear Regression model. It achieves lower MAE, indicating more accurate predictions, while maintaining a competitive proportion of preconfirmed transactions (e.g., 50.913% for q50). Across all quantiles, the Random Forest model consistently outperforms Linear Regression in both accuracy and the percentage of preconfirmed transactions.
Third, we observe however that the gap between the RF model and the other benchmarks decreases as the quantile increases. This is because higher quantiles are more volatile, being influenced significantly by the levels of MEV present in the market.
Additional Results
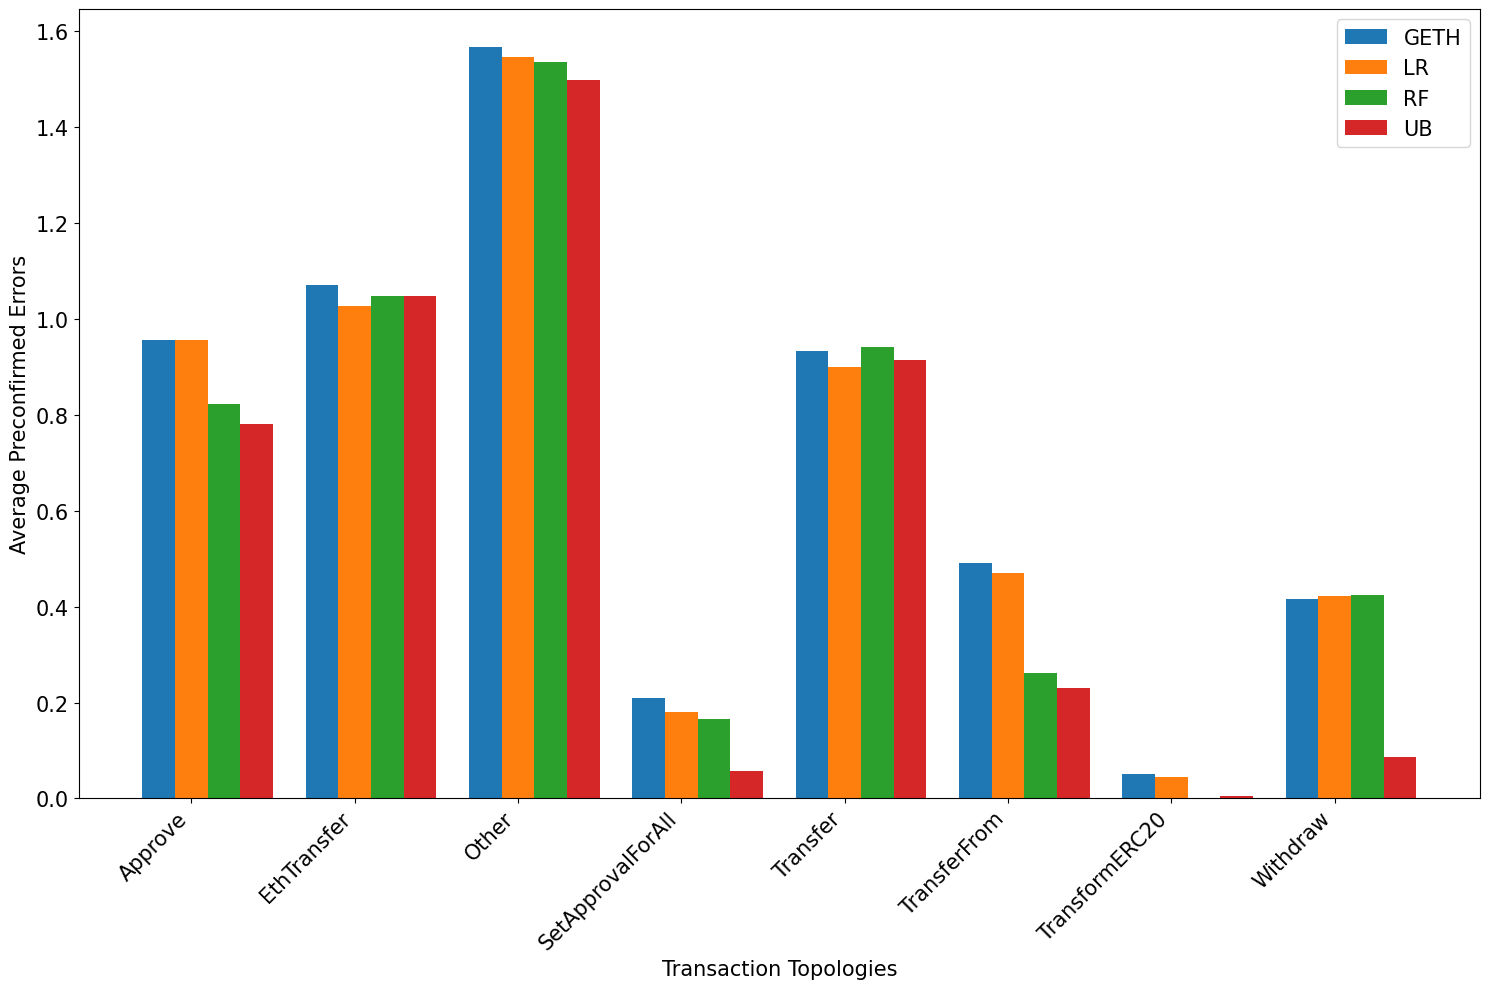
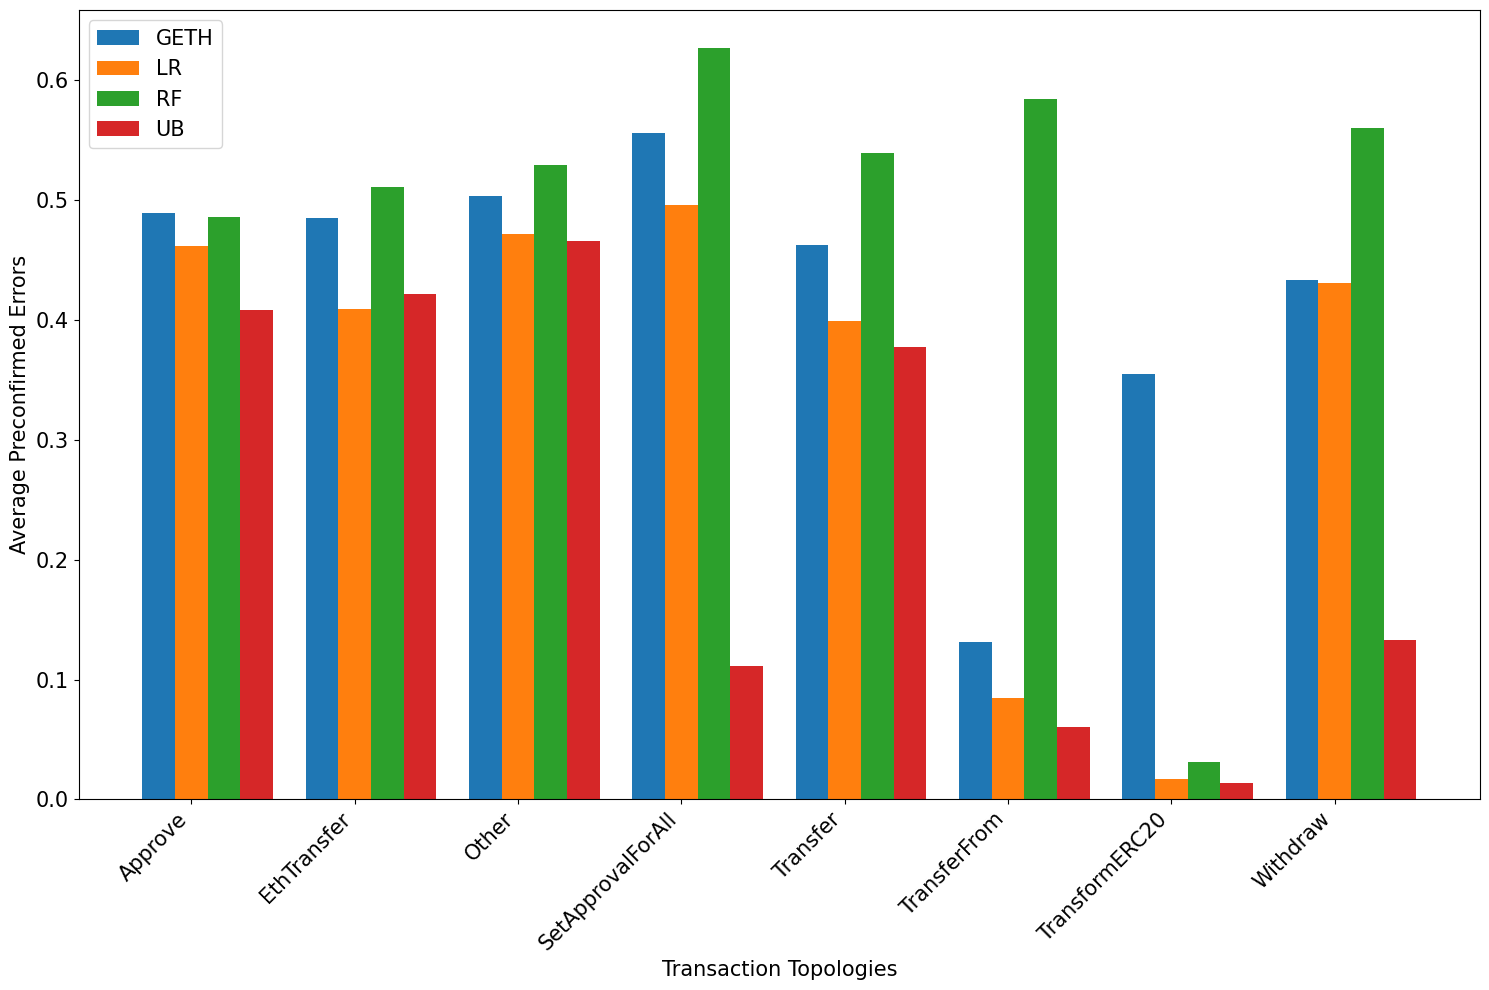
Metrics per tx topology
Analysis of the training of the learning algorithms
Analysis of the training metrics
| Quantile | R2 LR | MAE LR Train | MAE LR Test | R2 RF | MAE RF Train | MAE RF Test |
|---|---|---|---|---|---|---|
| q10 | 0.117 | 0.631 | 0.55 | 0.415 | 0.362 | 0.452 |
| q20 | 0.103 | 0.669 | 0.567 | 0.49 | 0.446 | 0.485 |
| q30 | 0.097 | 0.644 | 0.536 | 0.648 | 0.383 | 0.426 |
| q40 | 0.098 | 0.607 | 0.449 | 0.738 | 0.281 | 0.32 |
| q50 | 0.105 | 0.603 | 0.422 | 0.818 | 0.223 | 0.212 |
| q60 | 0.116 | 0.644 | 0.531 | 0.8 | 0.274 | 0.235 |
| q70 | 0.126 | 0.728 | 0.717 | 0.793 | 0.336 | 0.419 |
| q80 | 0.147 | 0.96 | 1.207 | 0.814 | 0.483 | 0.82 |
| q90 | 0.209 | 1.559 | 2.197 | 0.808 | 1.221 | 1.675 |
Table 5: training metrics for the learning algorithms according to the quantile target
We observe that the coefficient of determination values for the LR model remain consistently low, ranging from 0.117 at q10 to 0.209 at q90, indicating its limited ability to explain the variance in the data. In contrast, the RF model achieves significantly higher R2 values, ranging from 0.415 at q10 to 0.814 at q80, demonstrating its superior capacity to capture the underlying patterns.
Regarding the MAEs, we first notice that they are consistently higher on the test set for both the LR and RF models which is expected since the models were not trained on the test data. However, the relatively small difference between the training and test MAEs suggests that both models generalise well and do not suffer from significant overfitting.
In addition, we see that the RF model consistently outperforms the LR model achieving lower MAE across all quantiles on both the training and testing set. This superior performance can be attributed to the RF model’s ability to capture complex, non-linear dependencies in the data contrary to the LR model.
Feature importance of the RF model
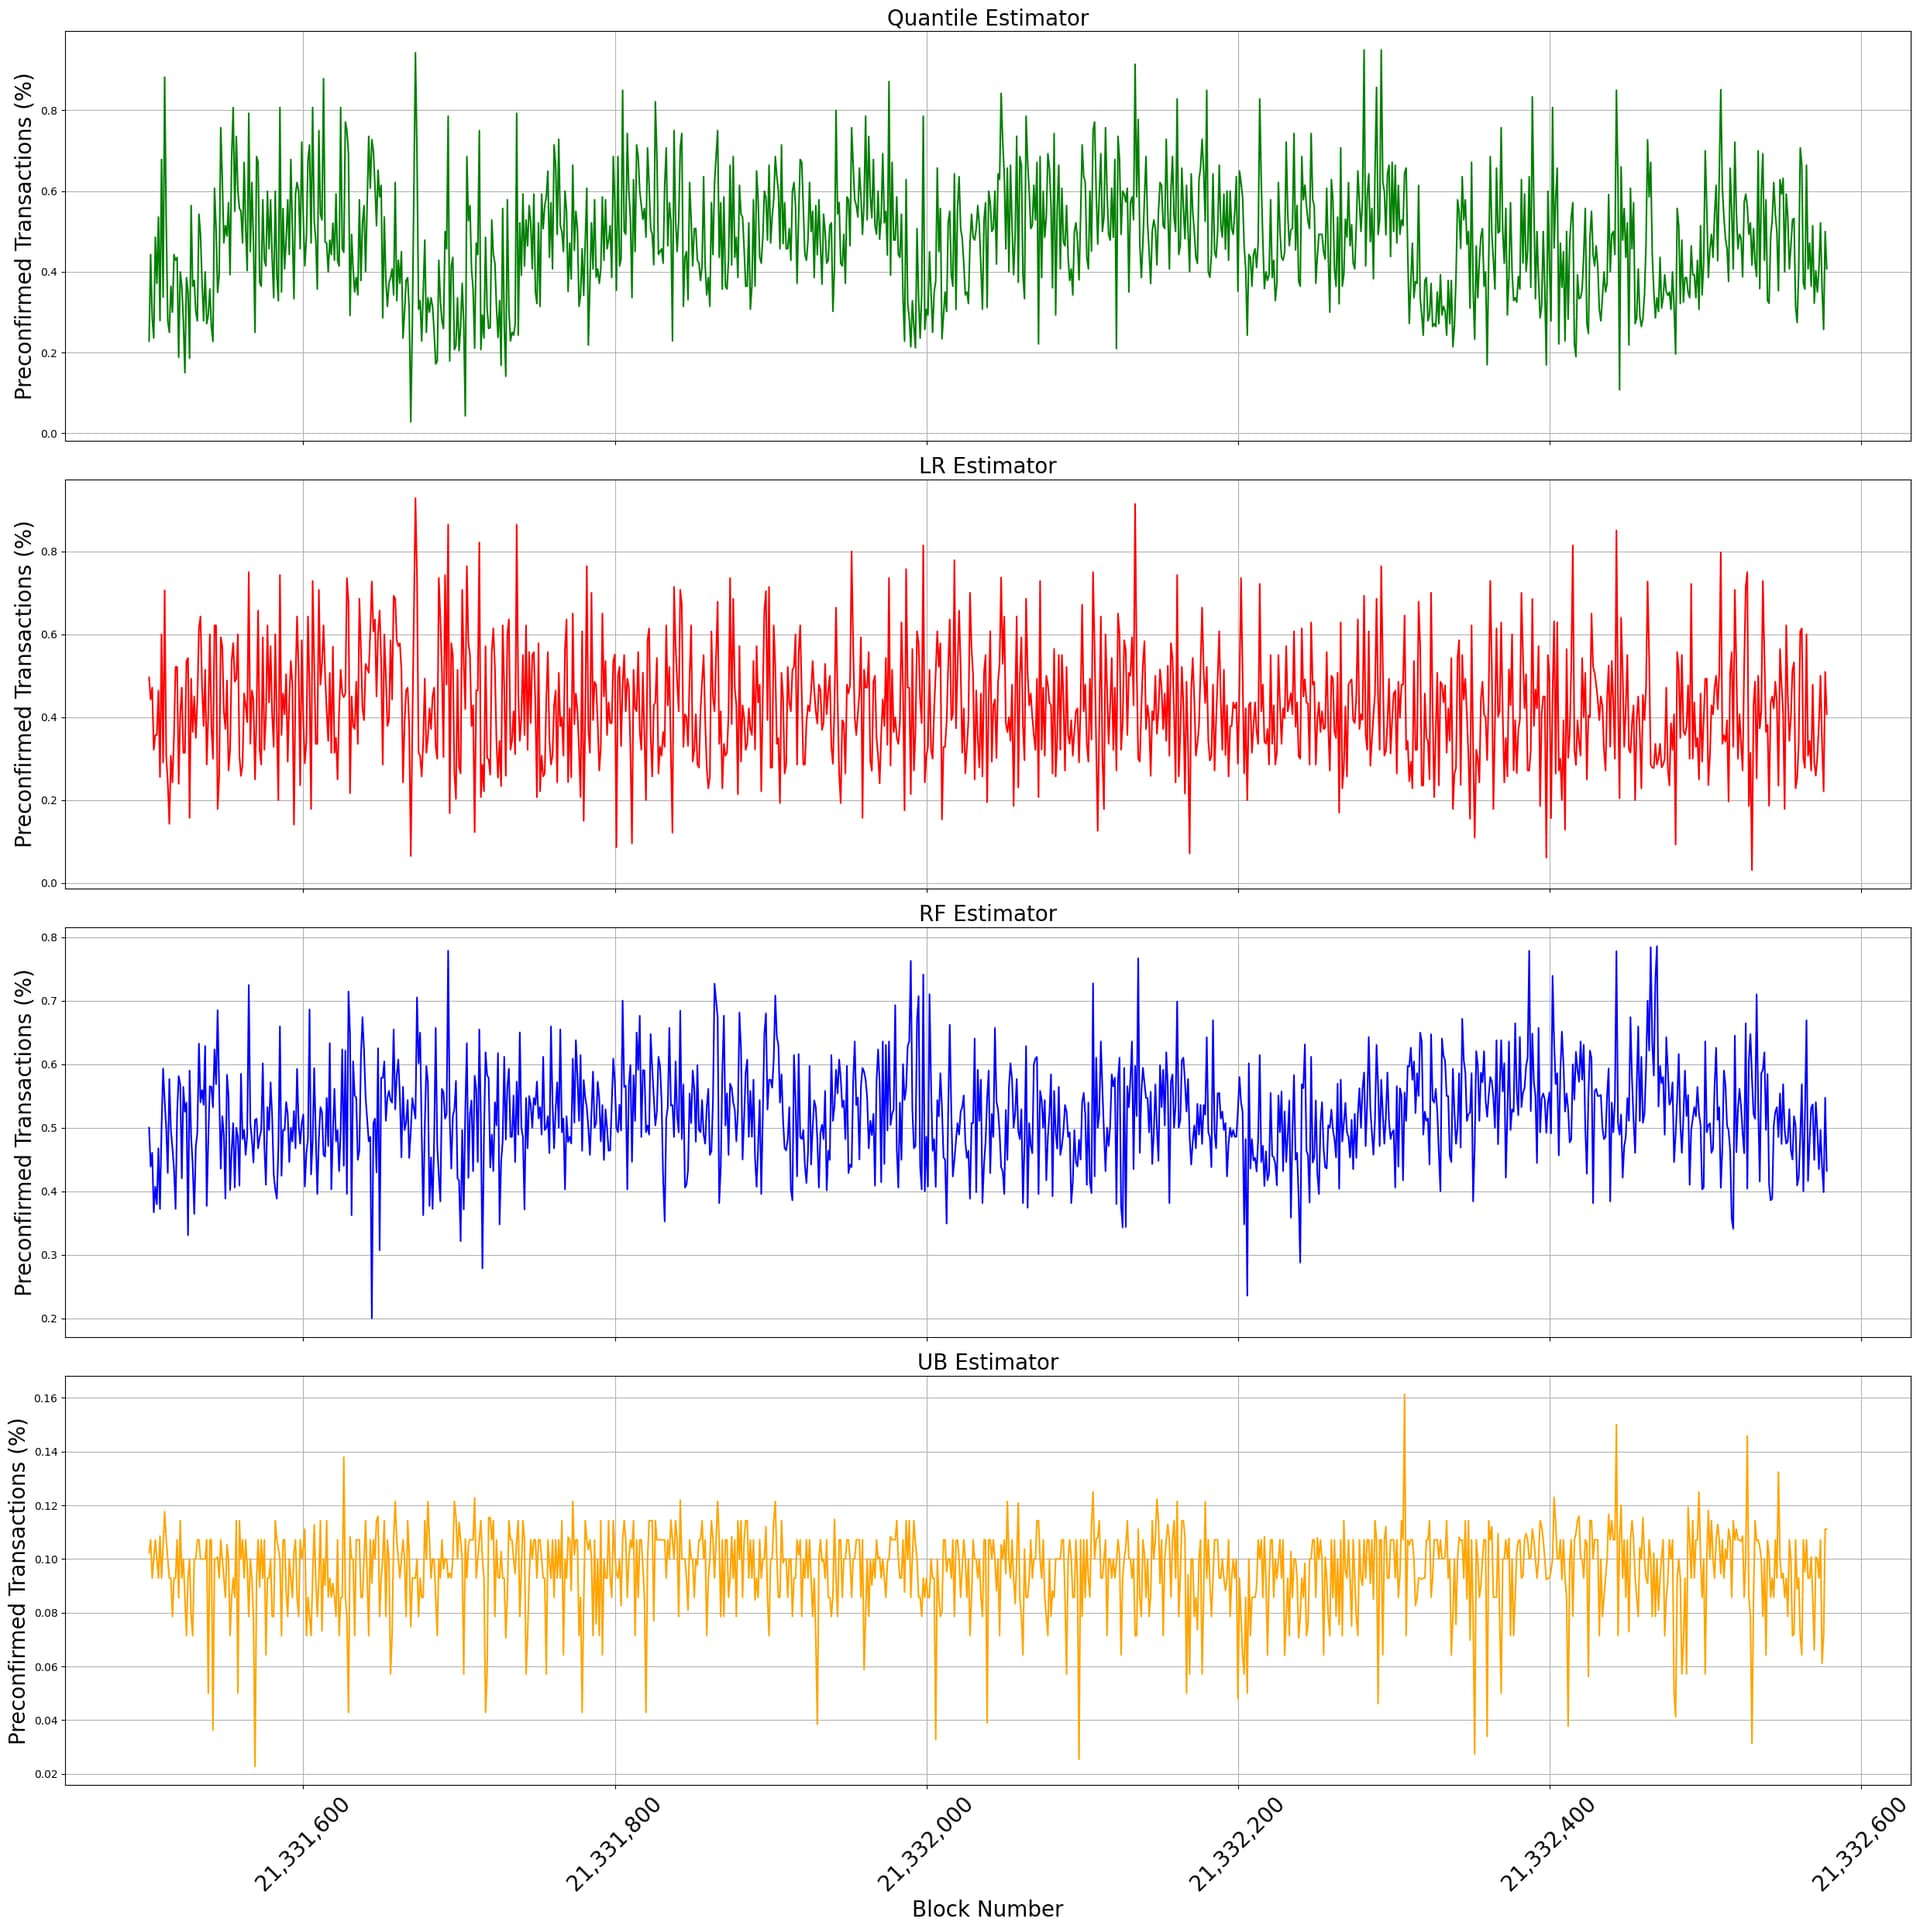
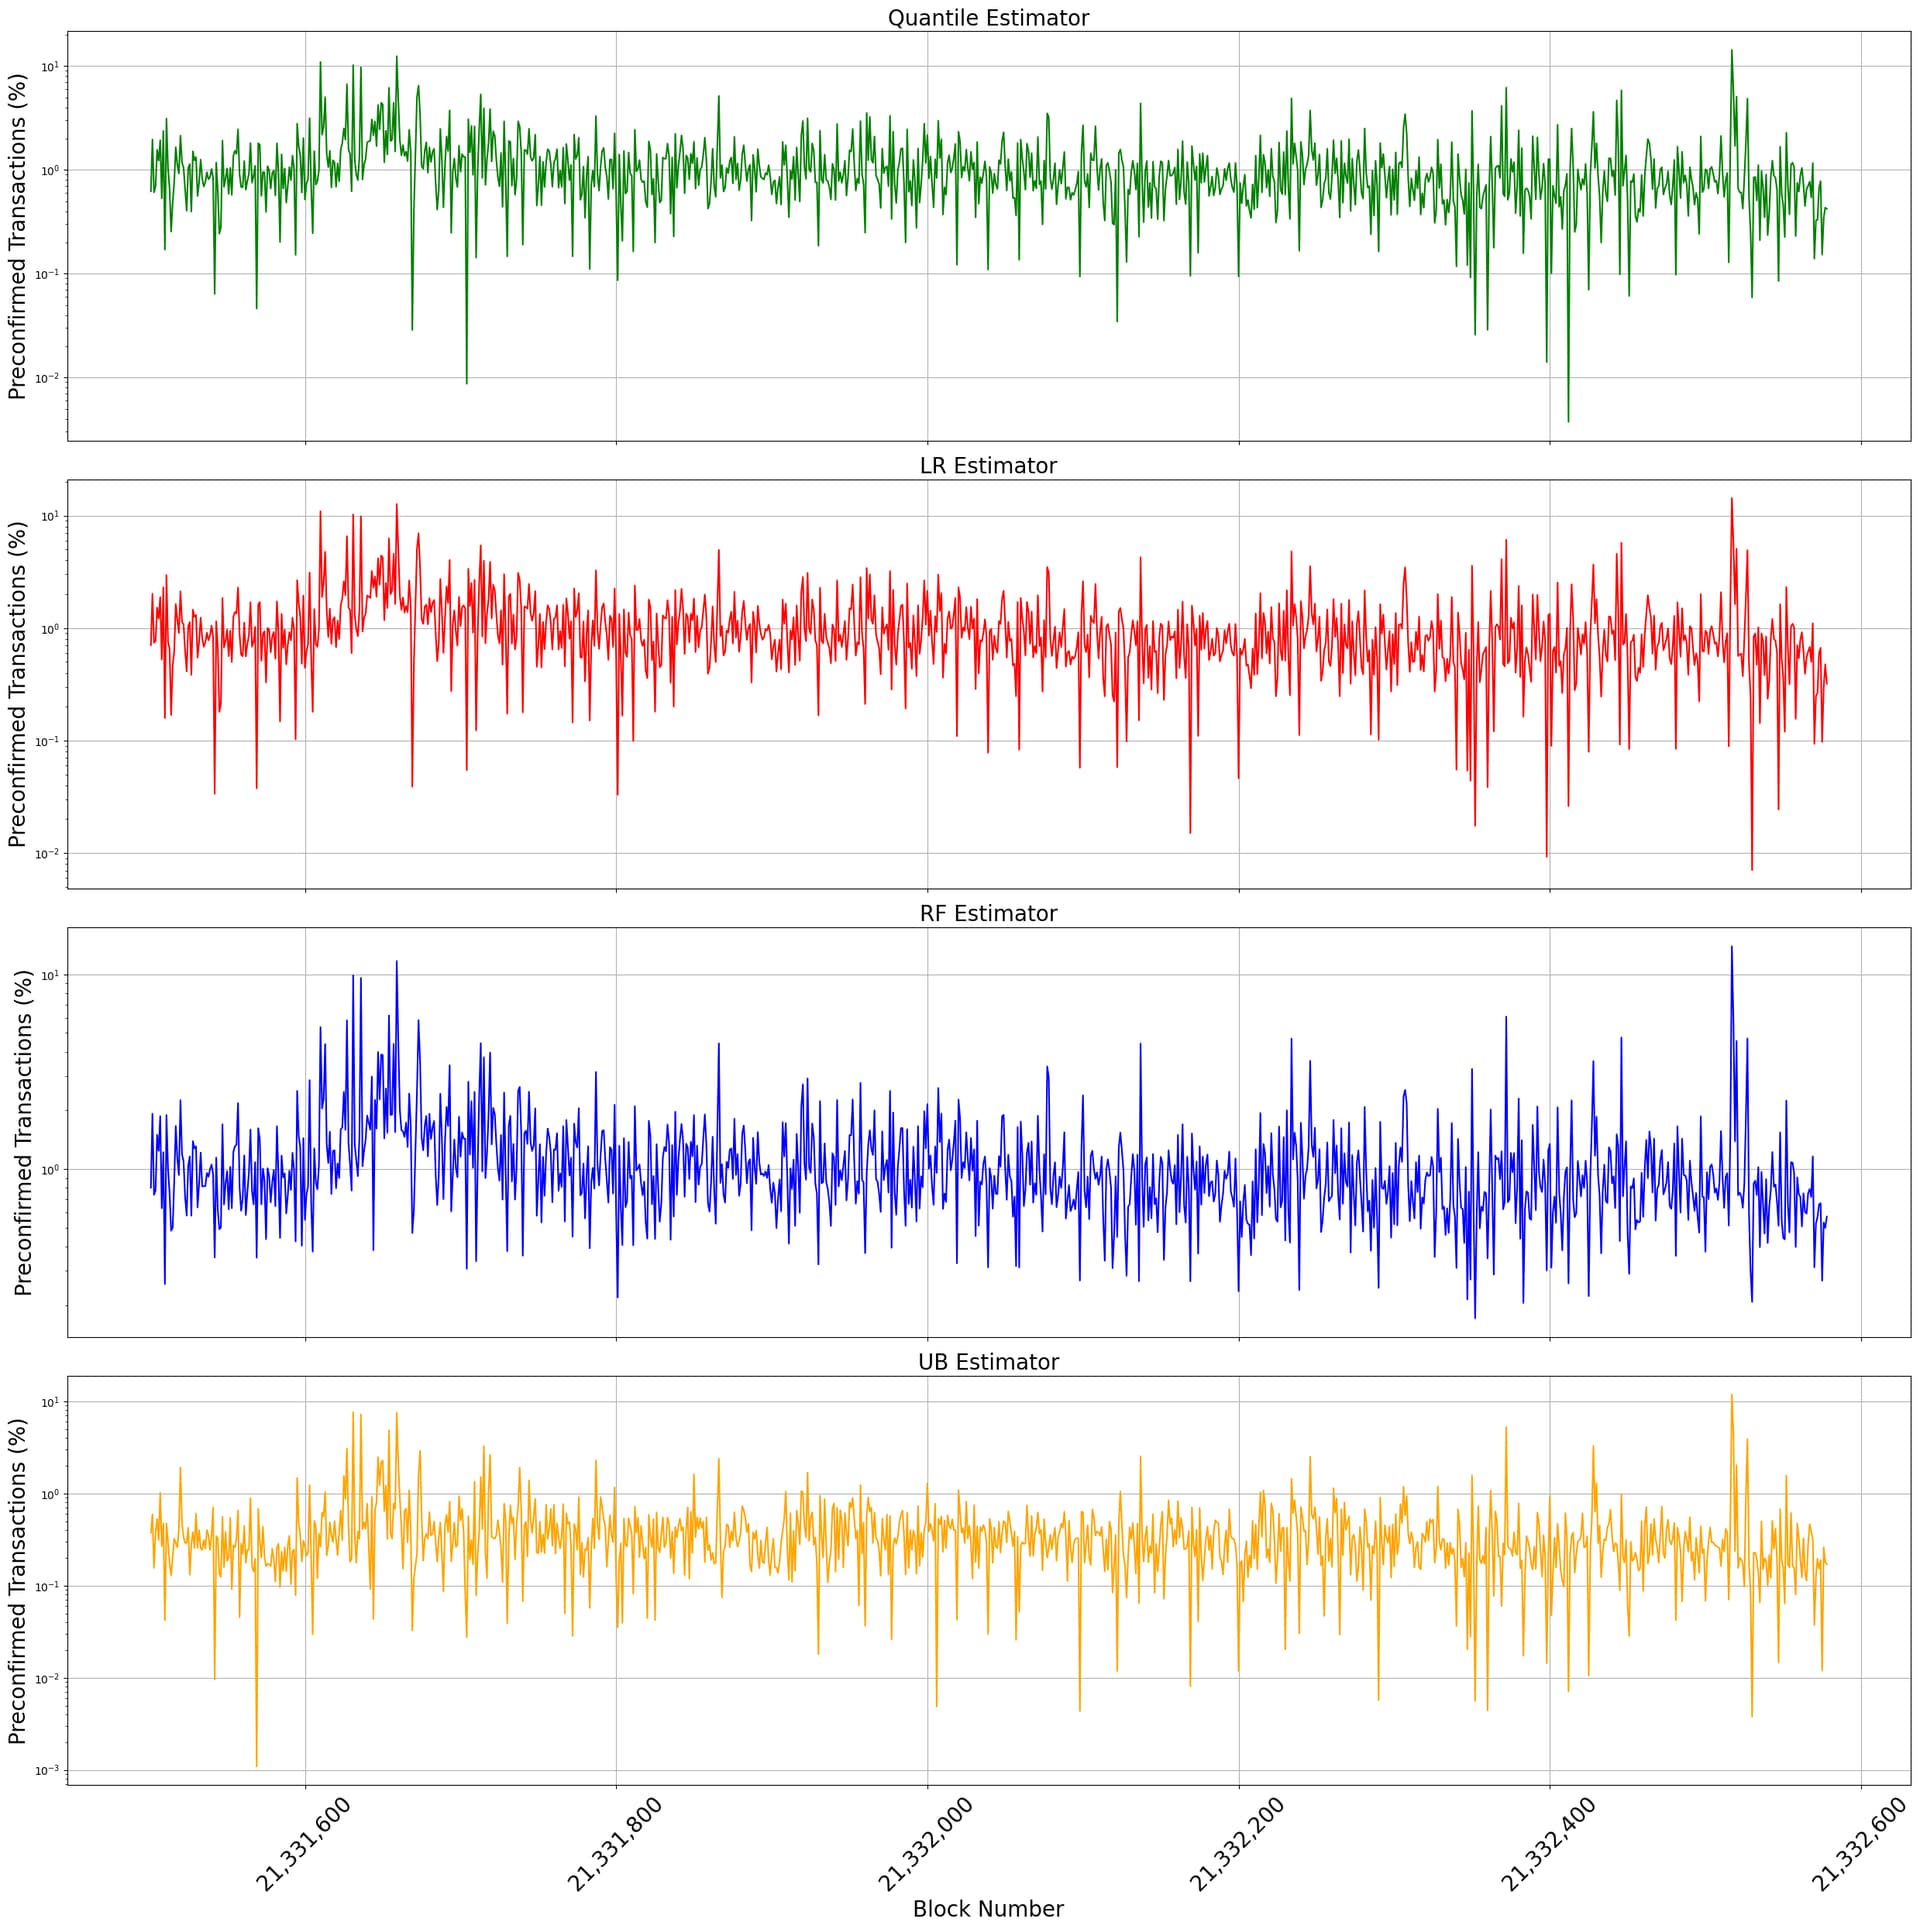
Metrics vs block number
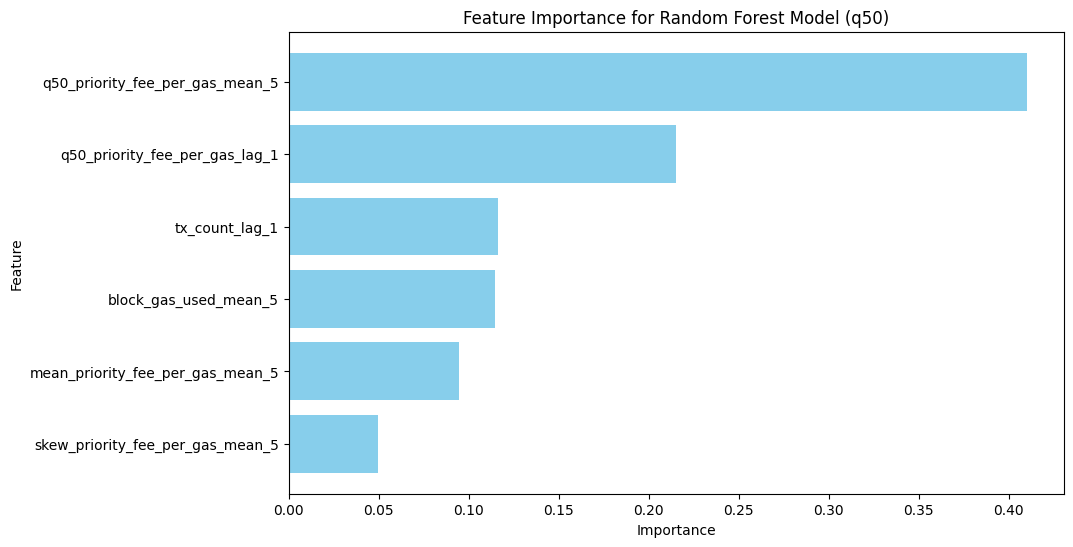
The most important features are statistical characteristics of the priority fee, with mean_priority_fee_per_gas dominating, followed by skew_priority_fee_per_gas and min_priority_fee_per_gas, highlighting the role of distribution characteristics. Lagged values of q50_priority_fee_per_gas and block-level metrics like block_gas_used_lag_1 are moderately important, while transaction topology and counts contribute minimally to the model’s predictions.
Conclusion
In this study, we explore the problem of pricing inclusion preconfirmations from a node operator’s perspective, focusing on the prediction of a priority fee threshold. Given the absence of historical preconfirmation data and a well-defined framework, we approach the problem by analysing historical transaction data and modeling the relationship between the priority fee and gas usage.
We find that the distribution of priority fees per unit of gas used depends on a transaction’s position within the block. Transactions at the top of the block tend to pay a premium in priority fees, as they are likely sourced from private order-flow or involve MEV extraction. Similarly, we exclude transactions at the bottom of the block, as they may also contain some MEV activity and, importantly, allow us to account for the premium associated with transactions arriving late in the block. Using this dataset, we develop and evaluate three approaches for predicting the priority fee threshold: heuristic-based methods, linear regression, and machine learning models, specifically a random forest.
Our results demonstrate that while quantile heuristics and linear regression provide a simple baseline, machine learning models consistently outperform both in predictive accuracy in terms of mean average error. The random forest model, in particular, captures complex relationships within the data, leading to more reliable pricing of preconfirmations.
As preconfirmation mechanisms become operational and real-world data becomes available, future work will focus on developing a revenue model that quantifies profitability under different market conditions. A more comprehensive framework, incorporating slashing conditions and economic incentives, will allow us to refine our pricing strategy and evaluate the long-term sustainability of preconfirmation markets.