TL;DR
Sonar is a free tool from ProbeLab that probes a single Ethereum node on demand. Give it an ENR and it finds the node over discv5, dials every address the record advertises, runs the libp2p or devp2p handshake, and for consensus-layer nodes exchanges Status and MetaData. Each result is compared with the node’s own ENR and with what our discv5 crawler has recorded about it. Other node identifier formats are also accepted, such as libp2p peerID or enode URL. Sonar is in beta. We would like feedback from client teams and node operators on what else a probe should check.
Why probe a node from the outside
A node can look healthy in its own logs and still be hard for the rest of the network to reach. Common cases:
- the ENR advertises an IP or port that is not reachable (NAT, a firewall rule, a public IP that changed)
- only some transports work, for example TCP answers but QUIC does not
- the ENR and the node’s Status/MetaData disagree (fork digest, attestation or sync-committee subnets, custody group count)
- a beacon API or metrics port is open to the internet
The node only sees its own side of these problems. Sonar connects to it as an unknown peer would and shows what happened at each step.
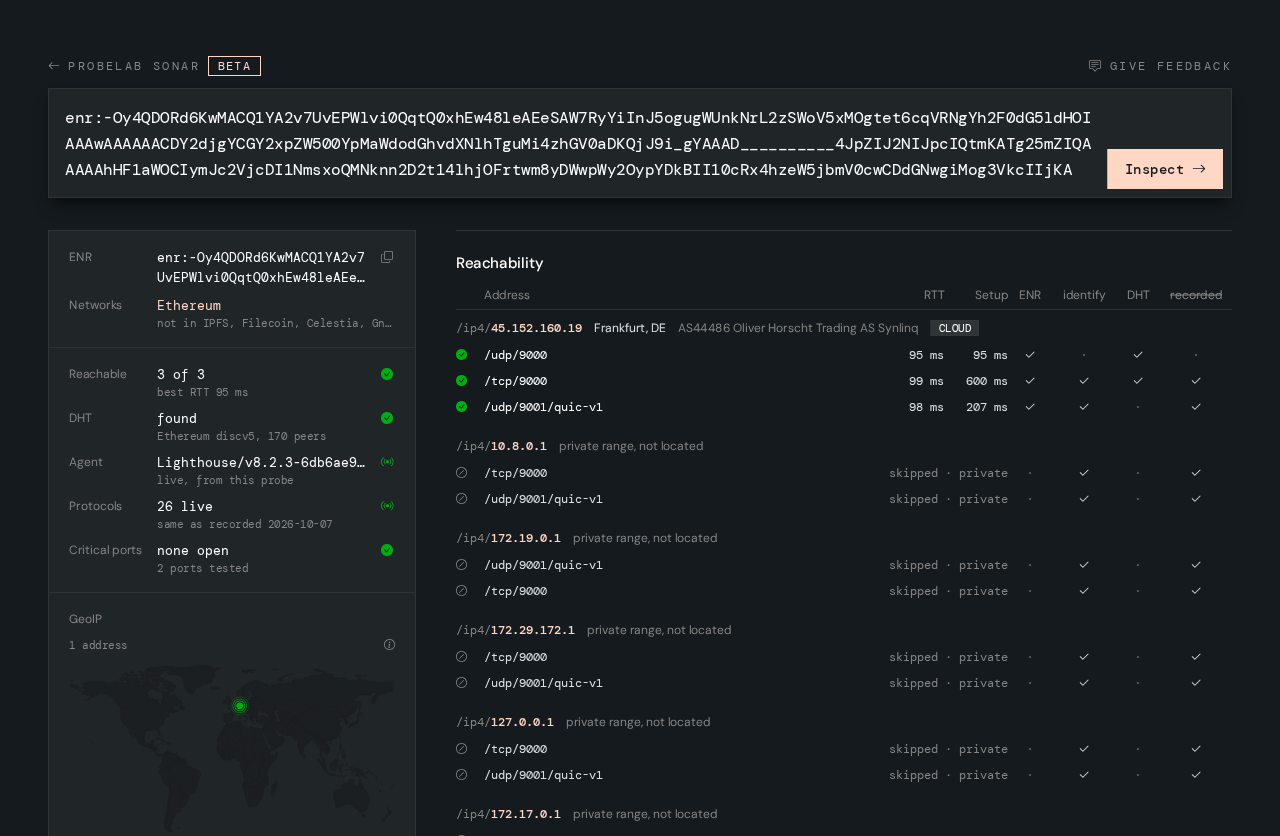
How a probe works
- Decode the ENR. Sonar shows every field: node ID, IPv4/IPv6 addresses and ports, the
eth2fork digest and next fork,attnets,syncnets, custody group count, and theethfield that marks an execution-layer node. - Look the node up over discv5. The lookup returns the latest version of the record, so an old ENR is refreshed before any dial.
- Dial every advertised address, one at a time. IPv4 and IPv6, TCP and QUIC are dialed and reported separately.
- Identify the node. Consensus-layer nodes go through libp2p identify (agent version, protocols, listen addresses). Execution-layer nodes go through the devp2p hello over RLPx (client name and capabilities).
- Run the eth2 exchange (consensus-layer nodes only). Sonar requests Status and MetaData, collects the gossipsub topics the node subscribes to, and records any GOODBYE and its reason code.
- Read the node’s discv5 routing table, bucket by bucket.
- Check the API and metrics ports of the client the node runs.
A probe takes from a few seconds to about half a minute, depending on how many addresses the node advertises and how quickly it answers. Results stream into the page as each step finishes.
What the result shows
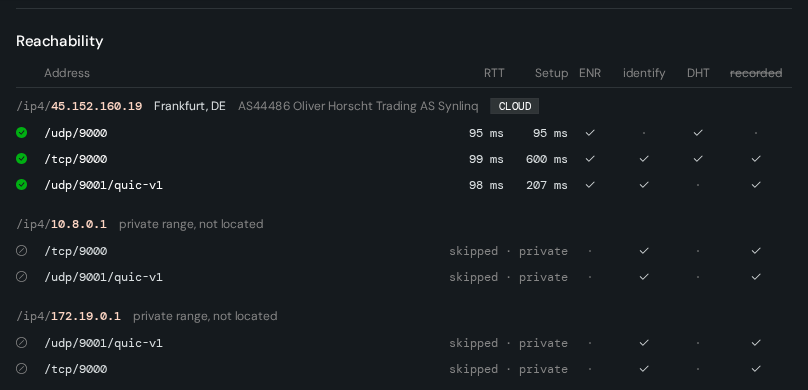
Reachability
One row per address: whether it connected, the connection setup time, the RTT, and the full error when a dial fails. The columns on the right show where each address came from: the ENR, libp2p identify, the discv5 lookup, or our crawl history. In the example the node answers on discv5 (UDP 9000), TCP 9000 and QUIC 9001. Identify also reported six private addresses, which Sonar lists but does not dial.
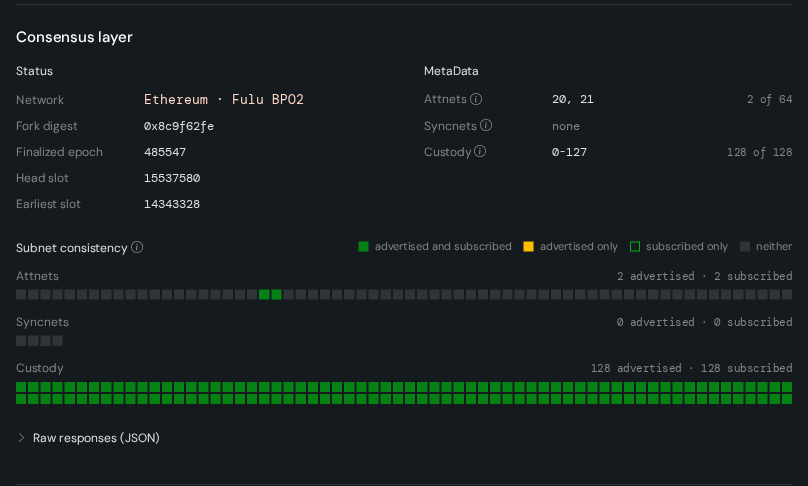
Consensus layer
This card appears only for consensus-layer nodes, the ones whose ENR carries an eth2 field. Any other discv5 participant, such as an execution-layer node or a node from another network that shares the DHT, still gets the reachability, routing table and port checks, but there is no eth2 exchange to run. For a consensus node, the card shows the values from Status and MetaData, next to the same fields in the ENR. The subnet grids compare what the ENR advertises with what the node reports it is subscribed to, for attestation subnets, sync-committee subnets and custody groups. Any mismatch is flagged. If the node sent a GOODBYE, the card shows the code and its meaning (for example 129, too many peers). A node that is full still tells us its GOODBYE reason, and some clients (Teku, for example) send their gossip topics before hanging up.
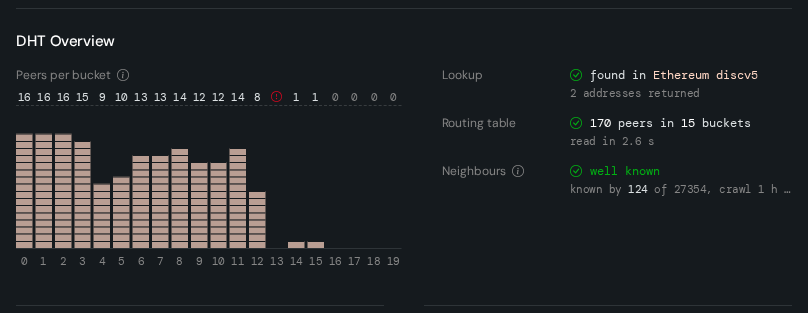
Routing table
How many peers sit in each bucket of the node’s discv5 routing table, how long the read took, and how many other nodes in our last crawl have this node in their own tables. Hovering a cell lists the peers in that bucket by ENR, and each one links to its own Sonar result, so you can walk from a node to its neighbours.
The bucket counts show how well the node itself is connected to the network: a table with most buckets filled means it can find peers and serve lookups, while a nearly empty one points to a node that is isolated or still starting. The “known by” count shows the other direction, how discoverable the node is: discv5 lookups only return nodes that sit in other nodes’ tables, so a node known by few peers is hard for new peers to find and gets fewer inbound connections, even when its own table looks healthy.
Port exposure
Admin ports usually have no authentication. Exposed to the internet, they let anyone read the node’s state, overload it with expensive queries or, on Prysm’s gRPC port, reach the interface a validator client uses. Metrics ports reveal the client version, which points attackers to known bugs, and can tie the node’s IP to the validators it runs. An exposed port causes no errors, so operators rarely notice it.
Sonar checks the API and metrics ports of the client the node runs, on the node’s public IP. Each port is rated by what it exposes: node control (high), node read (medium) or metrics (low). For a Lighthouse node that is the beacon API (5052) and metrics (5054); for Prysm it adds gRPC (4000), and so on per client. An open beacon API port is confirmed by calling /eth/v1/node/identity and comparing the peer ID with the probed node.

History
ProbeLab crawls the Ethereum discv5 network every two hours. Sonar lists the addresses and agent versions those crawls recorded for the node, so you can see when an address or a client version changed.
Next steps
Single vantage point. Probes run from one region of our infrastructure, so a result describes reachability from there. Nodes that rate-limit unknown peers can answer differently to their regular peers; geth, for example, throttles repeated inbound connections from one IP, so two quick probes of the same execution node can disagree. Future work could include probing from several regions and spread lookups across them, so a result can tell a node that is down apart from one that is unreachable from one place.
One-off probes. Each lookup runs once today. The next step is continuous monitoring: probing a node on a schedule and reporting when it becomes unreachable, when a transport stops answering, or when a new port opens. All this can be accompanied by daily/weekly/monthly reports, as well as the corresponding alerts. If that would help with nodes you run or depend on, tell us which checks matter and how often they should run.
We would like input from client teams and researchers on which behaviours are worth checking from outside a node: specific GOODBYE codes, req/resp methods, or Fulu custody and column fields. Replies on either of the two directions above are just as welcome.
Check Sonar at: Sonar: Inspect a PeerID, ENR or MultiAddress | ProbeLab Analytics and get in touch.