this post is partly funded by EF Academic Grant FY23-1030 (Sandra, Kerrie and Patrick) with special thanks to Anders Madsen for his contribution to the interactive version of the BN model, and constructive feedback and discussion with Barnabé, Ben, Mike, Mikhail, Roberto.
EIP-7251 proposes increasing the MAX_EFFECTIVE_BALANCE constant from 32 ETH to 2,048 ETH, but the minimum effective balance required to join as a validator remains unchanged at 32 ETH.
The expectation is that “Proposer selection is already weighted by the ratio of their effective balance to MAX_EFFECTIVE_BALANCE. Due to the lower probabilities, this change will slightly increase the time it takes to calculate the next proposer index.”
We undertook some additional analysis of proposer selection which is summarised in this blog post.
Proposer selection process
Proposer selection is a two-stage process:
- Being selected as the candidate from the list of shuffled validator indices.
- Passing the proposer eligibility check
The swap-or-not-shuffle technique [1] is used to shuffle the validator indices in preparation for the selection of a block proposer.
This is done in compute_shuffled_index.
The computation to determine the proposer for the next block is done in compute_proposer_index (shown below):
def compute_proposer_index(state: BeaconState, indices: Sequence[ValidatorIndex], seed:
    Bytes32) -> ValidatorIndex:
    """
    Return from ‘‘indices’’ a random index sampled by effective balance.
    """
    assert len(indices) > 0
    MAX_RANDOM_BYTE = 2**8 - 1
    i = uint64(0)
    total = uint64(len(indices))
    while True:
       candidate_index = indices[compute_shuffled_index(i % total, total, seed)]
       random_byte = hash(seed + uint_to_bytes(uint64(i // 32)))[i % 32]
       effective_balance = state.validators[candidate_index].effective_balance
       if effective_balance * MAX_RANDOM_BYTE >= MAX_EFFECTIVE_BALANCE * random_byte:
           return candidate_index
       i += 1
Therefore, we iterate through the shuffled indices, starting with the first entry and then check whether it passes the selection criteria. If it doesn’t, then the next validator index in the array goes through the same check.
As we can see from the code, the validator’s effective balance (EB) is multiplied by 255 (i.e.
MAX\_RANDOM\_BYTE = 2^8 - 1 = 255) and then compared to the product of the generated random\_byte (r) and MAX\_EFFECTIVE\_BALANCE = 2,048 ETH.
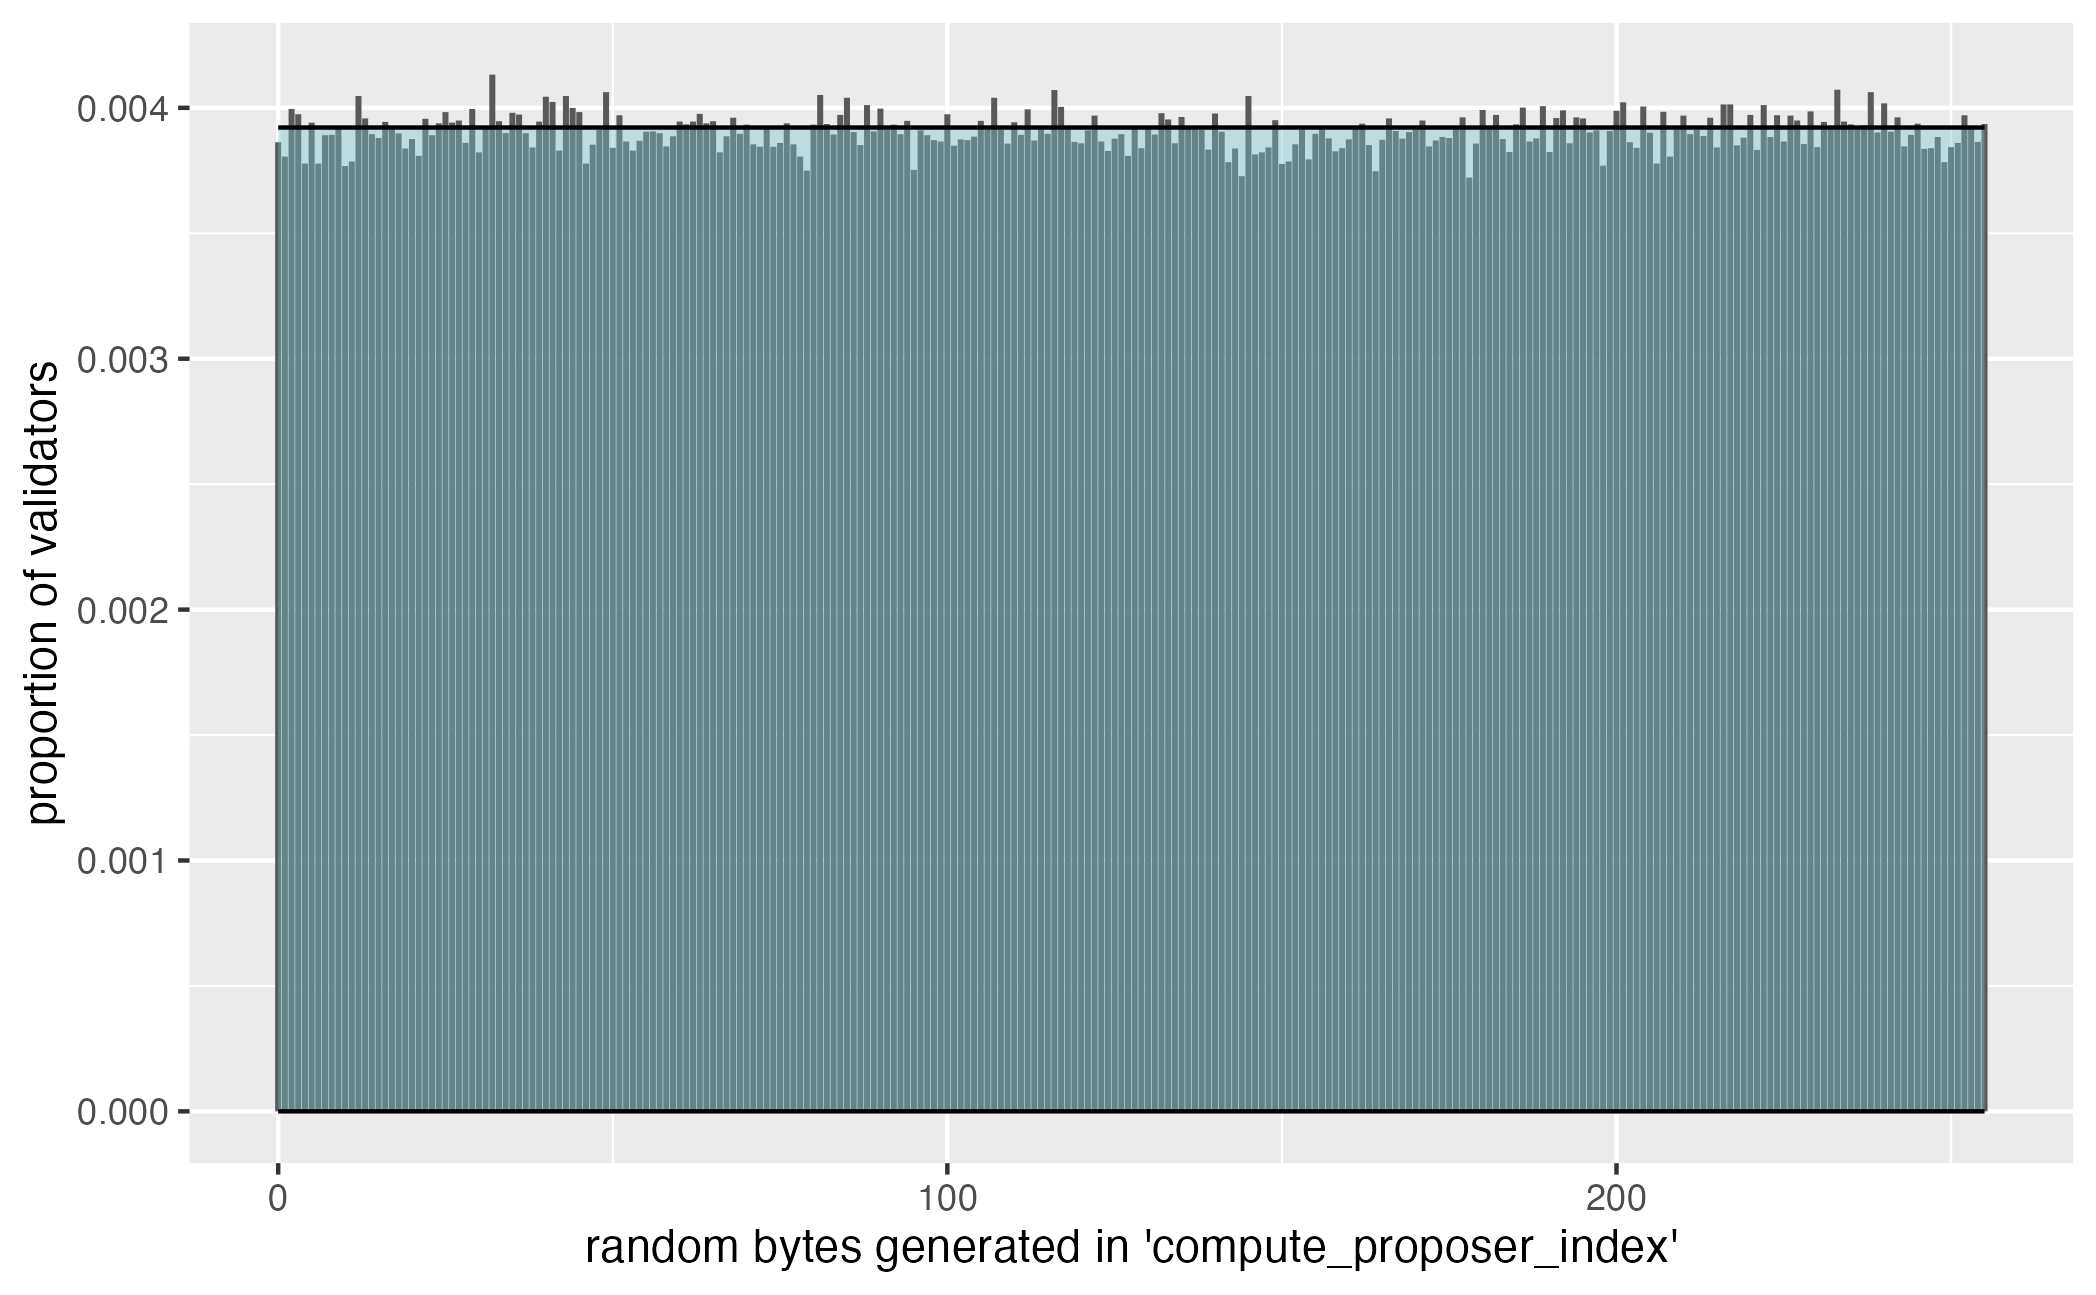
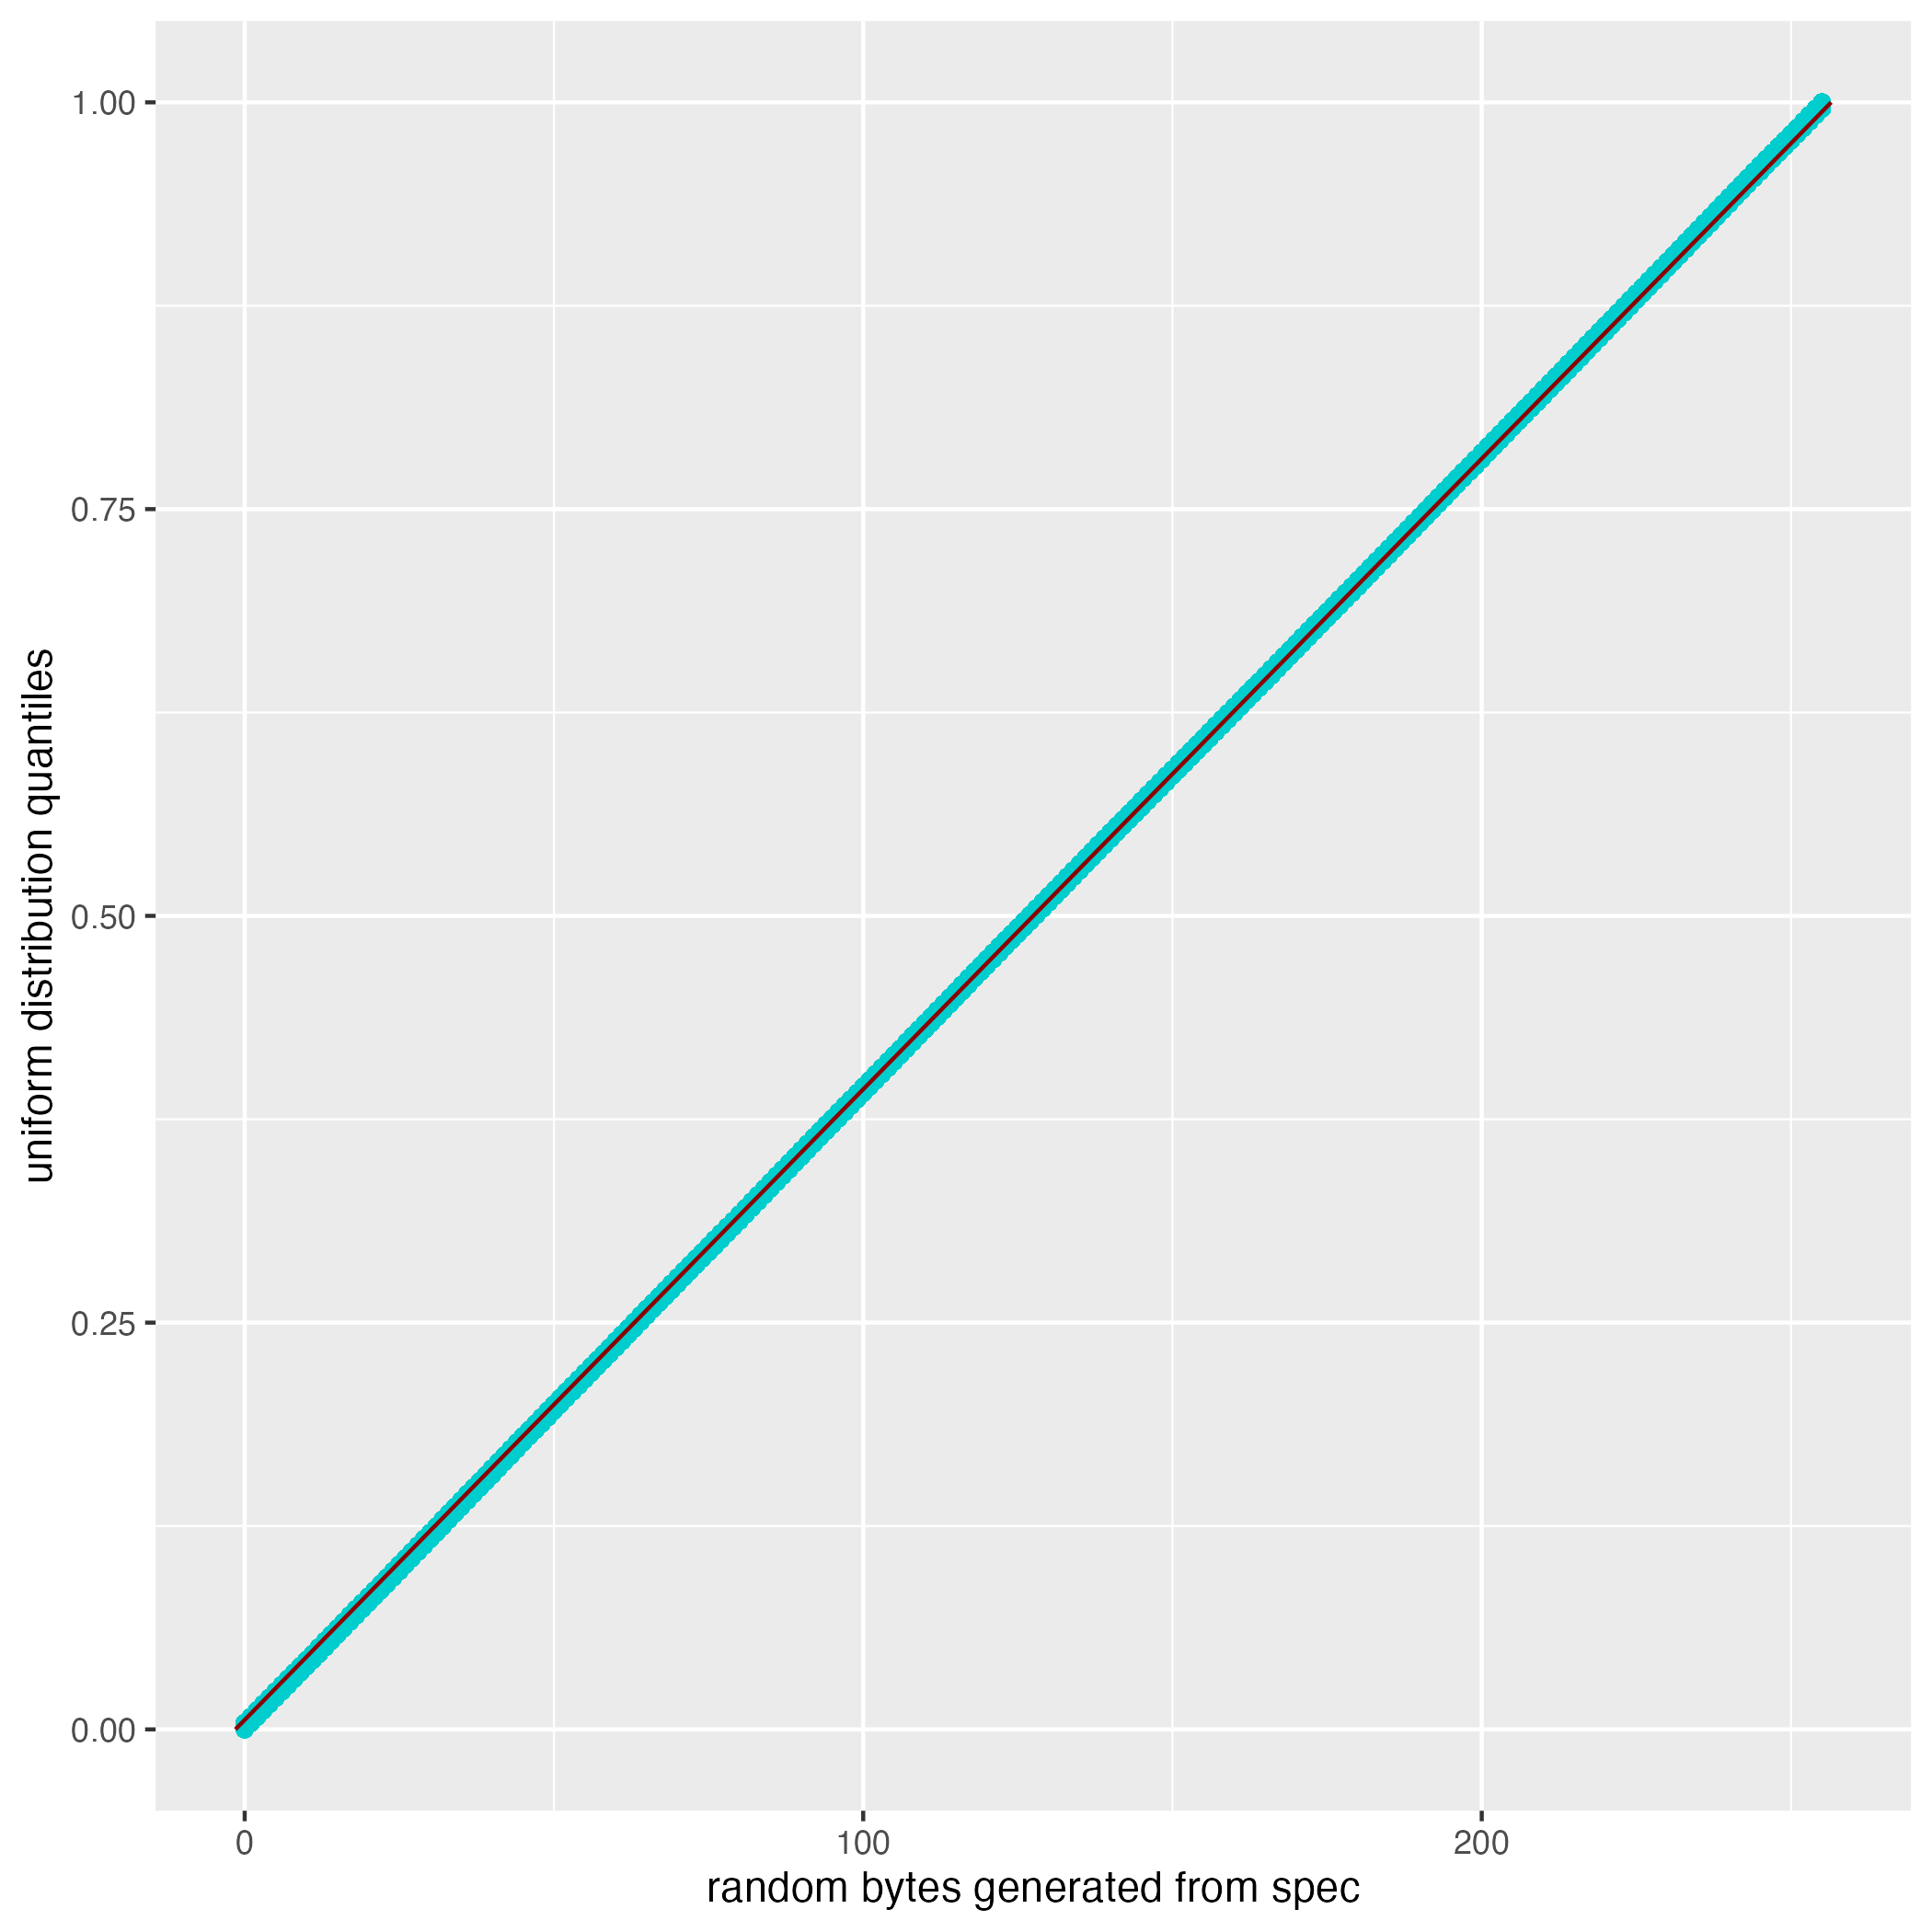
Figure 1 (a) is an exposition of random byte values generated for 716,800 validators from the random_byte assignment statement below. Superimposed on the histogram of these random byte integers is a uniform distribution. As expected, the random bytes appear to visually resemble values drawn from a uniform distribution: r \sim U(0,255). We confirm this in the Q–Q plot in Figure 1 (b). Hence we can assume in subsequent calculations that the random bytes, r, have a uniform distribution, r \sim U(0,255).
random_byte = hash(seed + uint_to_bytes(uint64(i // 32)))[i % 32].
(a) (b)
Figure 1: (a) Distribution of 716,800 random bytes generated from the spec (b) Quantile-quantile plot of the generated random bytes against a uniform distribution - U(0,255)
The probability of a validator being the proposer if their index was selected from the list is calculated as follows (where \therefore means therefore):
P(proposer \texttt{ } check \texttt{ }passed) = P(EB * 255 \geqslant MaxEB * r), where r \sim U(0,255), r = random\_byte, EB = validator\_effective\_balance
\therefore P(proposer \texttt{ } check \texttt{ }passed) = P\left( r \leqslant \frac{255*EB}{MaxEB}\right)
\therefore \textit{if } EB = MaxEB \implies P(proposer \texttt{ } check \texttt{ }passed) = 1
In other words, if the effective balance of the candidate validator equalled the maximum effective balance, then the validator becomes the proposer with probability 1.
When the maximum effective balance is increased to 2,048 ETH, the probability of passing the proposer eligibility test will vary depending on the extent of validator consolidation.
As before, a fully consolidated validator with an EB of 2, 048 ETH (64 * 32 ETH) will become a proposer with a probability of 1 if the
validator’s index was randomly selected as the next candidate.
However, if the randomly selected candidate validator has an EB of:
32 ETH:
P(proposer \texttt{ } check \texttt{ }passed) = P\left(r \leqslant \frac{255*32}{2048} \right)
\therefore P(proposer \texttt{ } check \texttt{ }passed) = P(r \leqslant 3.98) = \left(\frac{3.98-0}{255}\right) = 0.016
\therefore P(proposer \texttt{ } check \texttt{ }passed) \equiv \left(\frac{32}{2048}\right) = 0.016
64 ETH (2 * 32 ETH)
\therefore P(proposer \texttt{ } check \texttt{ } passed) = \left(\frac{64}{2048}\right) = 0.031
160 ETH (5 * 32 ETH)
\therefore P(proposer \texttt{ } check \texttt{ } passed) = \left(\frac{160}{2048}\right) = 0.078
320 ETH (10 * 32 ETH)
\therefore P(proposer \texttt{ } check \texttt{ }passed) = \left(\frac{320}{2048}\right) = 0.156
960 ETH (30 * 32 ETH)
\therefore P(proposer \texttt{ } check \texttt{ }passed) = \left(\frac{960}{2048}\right) = 0.469
Figure 2 below depicts the increase in passing the proposer eligibility test as the validator’s effective balance increases.
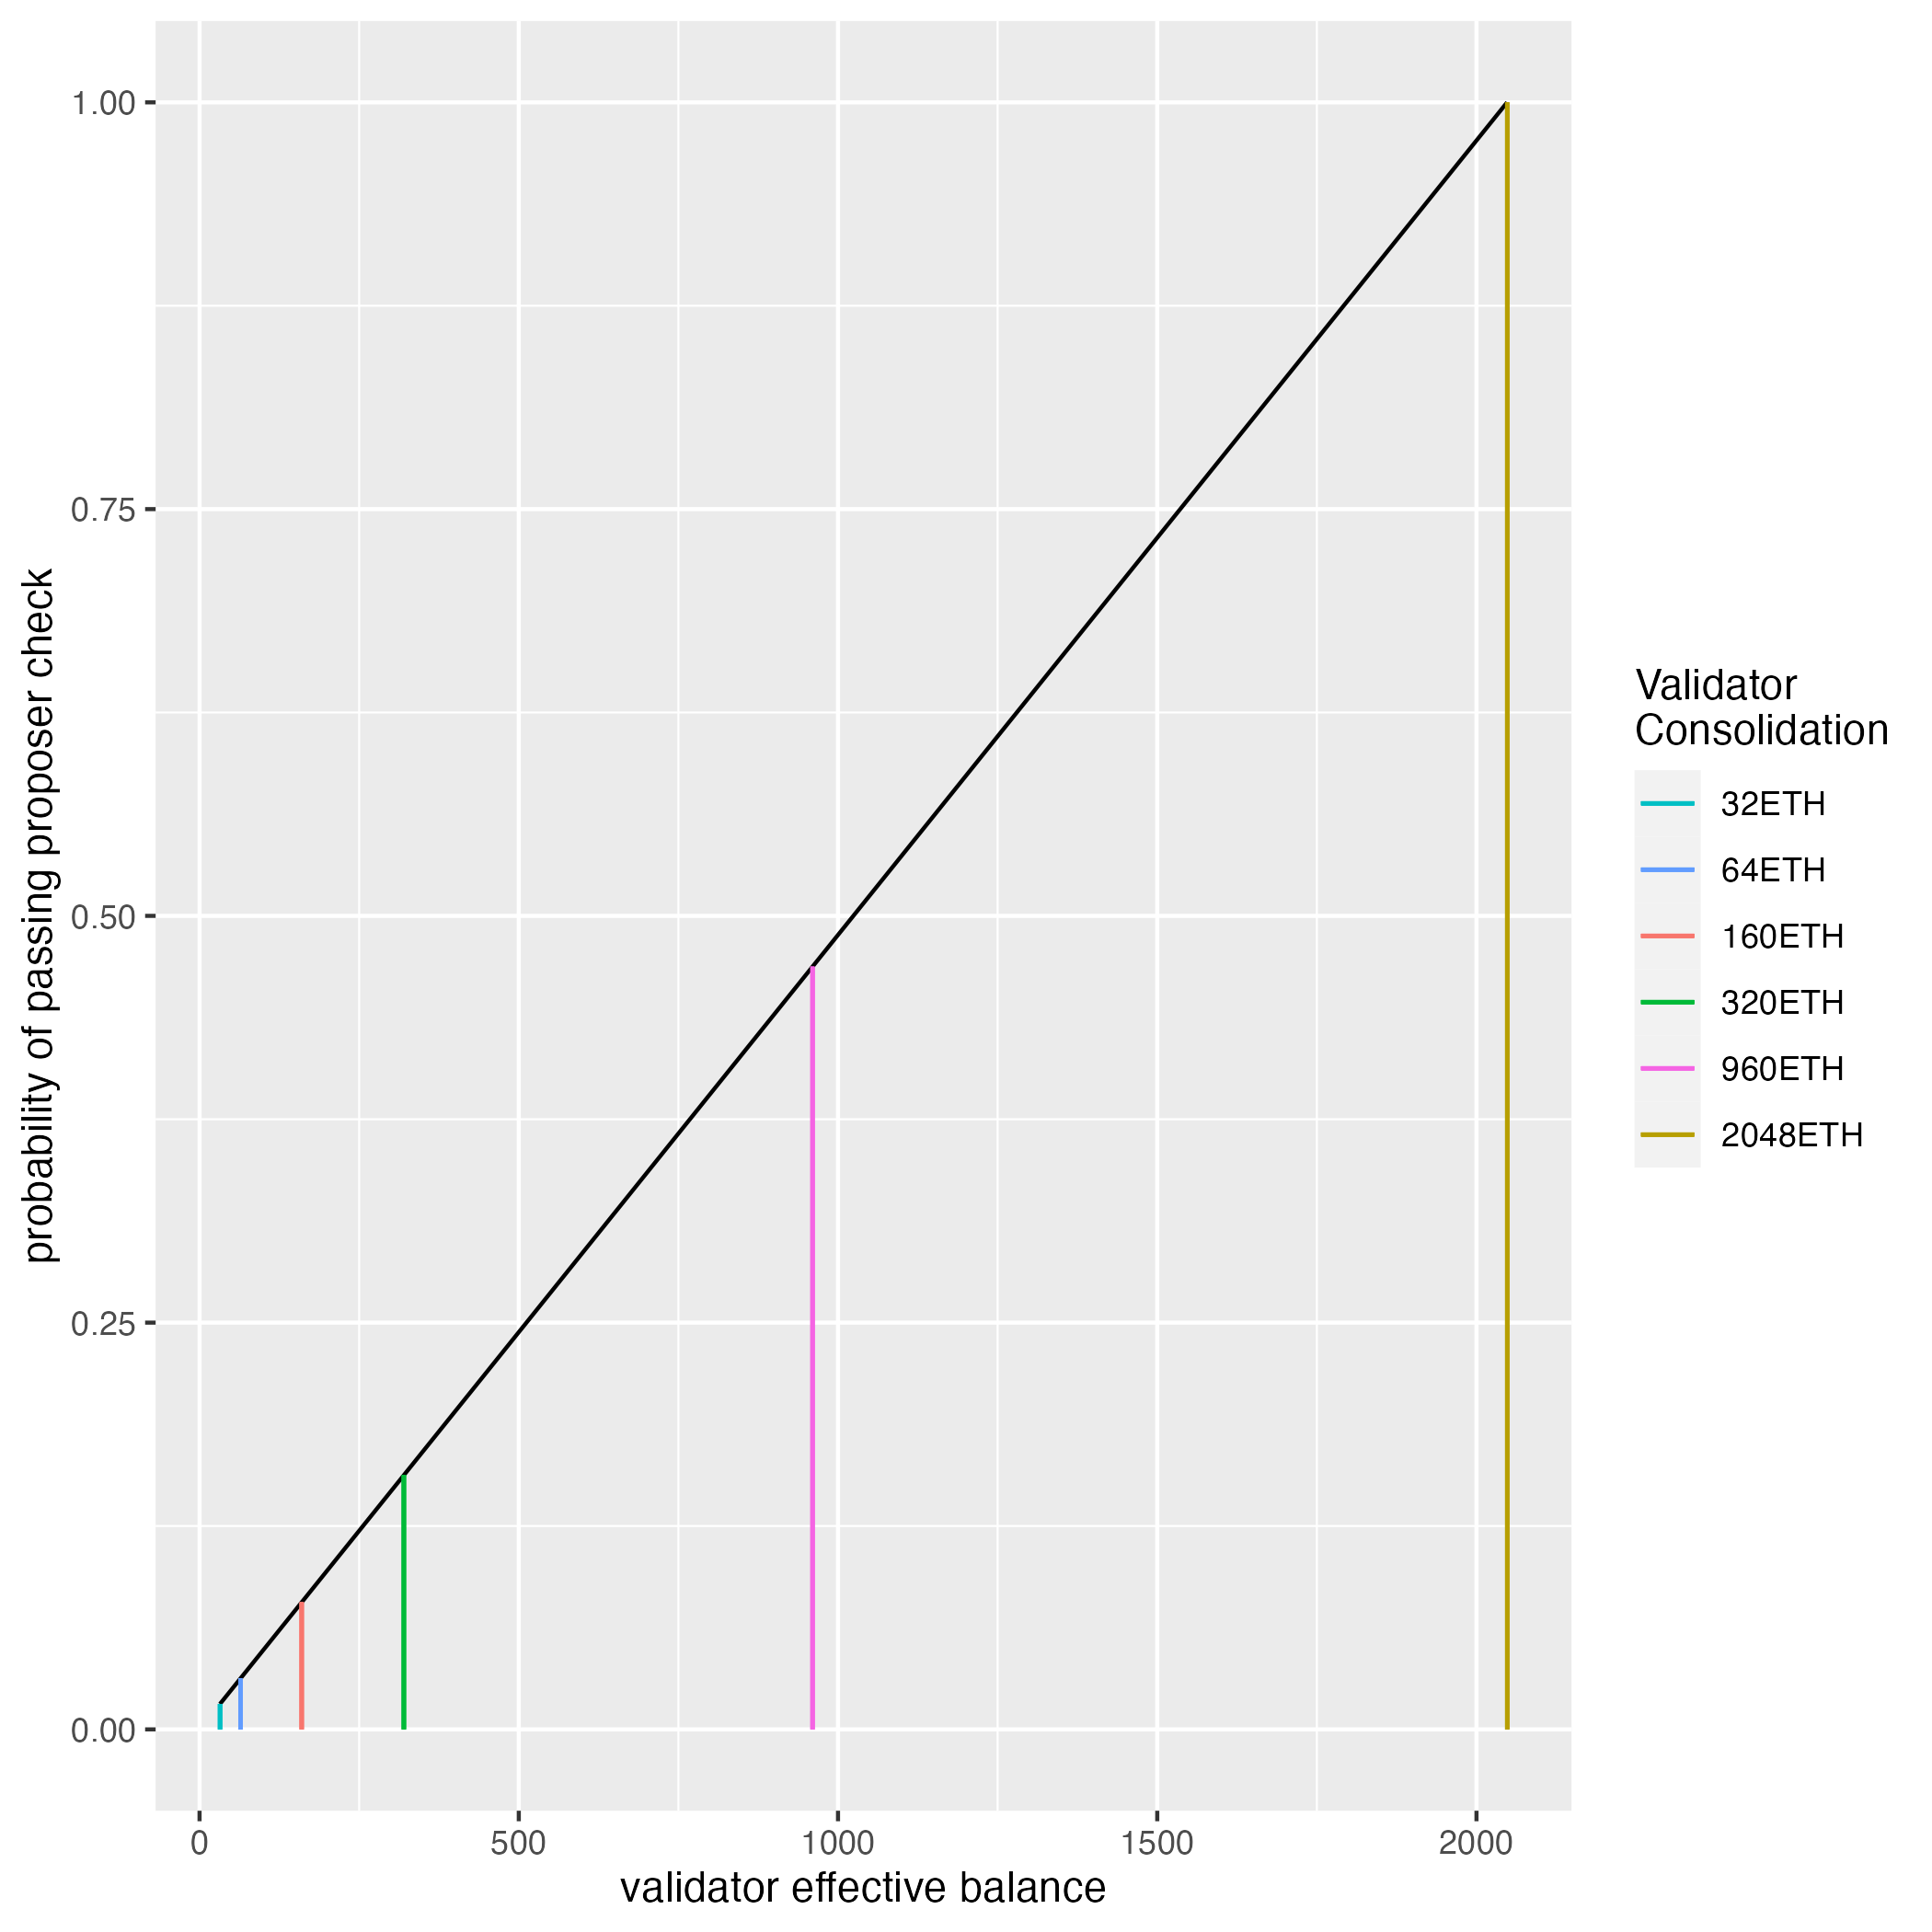
Figure 2: Probability of passing the proposer eligibility check for a candidate validator with an EB ranging from 32 to 2,048 ETH
In other words, if a validator’s index is selected as the next candidate, the probability of passing the selection check to propose the next block varies from 0.016 for an unconsolidated validator (32ETH) to 1 for a fully consolidated validator (2,048ETH).
Assuming a validator set size of 716,800, then
the probability of any validator, regardless of their effective balance, being first in the list of shuffled validator indices (i.e. the candidate to be assessed as the next block proposer) is:
P(candidate) = \frac{1}{(Active \texttt{ } validator \texttt{ } set \texttt{ } size)} = \frac{1}{ 716,800} = 1.395*10^{-6}.
Currently (i.e. prior to EIP-7521), providing a validator maintains its effective balance at 32 ETH, once its index is selected as the next candidate to be checked, it would pass the proposer selection test with certainty (i.e. probability of 1, or 100\%).
Putting it another way:
Given EB=32 ETH, then the probability of being selected as the 1^{st} candidate and becoming the next proposer is calculated as follows:
P(candidate \texttt{ } \& \texttt{ }proposer check passed)
= P(candidate) * P(proposer check passed / candidate)
= P(candidate) * P(proposer check passed) (since these two events are independent)
= \left(\frac{1}{716800}\right) * 1 \approx 1.395 * 10^{-6}
After MaxEB = 2,048 ETH, this changes to:
P(candidate \& proposer check passed) =
\left(\frac{1}{716800}\right) * \left(\frac{32}{2048}\right)
\approx 2.18*10^{-8}
For the current MaxEB of 32 ETH, we know that if the validator is selected as the 1^{st} candidate in the shuffled index, then they will definitely be the proposer for the next block.
When we consider the increased MaxEB proposal, then it may be quite likely that a validator is selected as the next candidate validator for the proposer eligibility test at subsequent rounds (e.g. 2^{nd}, 3^{rd}, ..., n^{th}), because a selected candidate will be less likely to pass the proposer check.
Therefore we calculate the probability that a 32 ETH validator, v, is selected at round i given that all the previous rounds (1,2, ... (i-1)) were unsuccessful,
i.e. we sum over all the possible rounds that this validator may have been selected.
For example, if validator v is selected at round 3, there would have been a rejection of another validator at round 1 and round 2. Stating this more generally:
P(validator \texttt{ } v \texttt{ } selected \texttt{ } as \texttt{ } next \texttt{ } proposer) = \sum_{i=1}^{716,800} p_i * \left( \prod_{j=1}^i (1-p_{j-1}) \right), \texttt{ } where
p_i = P(round \texttt{ }i \texttt{ } proposer) = P(round \texttt{ } i \texttt{ } candidate) * P(passing \texttt{ } proposer \texttt{ } eligibility), and
\texttt{ } p_0 = 0
This probability is also 1.395 * 10^{-6}.
In summary, with an increased MaxEB, a solo staker would be selected as the next proposer with a probability of 2.18*10^{-8}, from the current 1.395 * 10^{-6} probability if they are the first candidate in the shuffled index. However, their probability over all the possible outcomes will be the same as is currently the case, if all the other validators have the same EB and hence the same probability of passing the proposer check.
It gets a bit more complex when the minimal solo staker is competing against validators that are more likely to pass the proposer eligibility check, e.g. after implementation of EIP-7521.
The probability calculations above assumes a validator set with no consolidation, i.e. the validator set size remained unchanged with the introduction of EIP-7521. In practice this is highly unlikely. Therefore, we consider an example scenario.
Example Scenario: Active validator set has validators with varying EBs (i.e. stakers may choose different strategies for validator consolidation)
To the best of our knowledge, the analyses to date have mainly been for a homogeneous validator set, i.e. all validators have the same effective balance, either unconsolidated (32 ETH) or fully consolidated (2,048 ETH). This includes the analysis we conducted above.
Hence, a more interesting scenario would be an active validator set with a variety of effective balances.
Therefore, let us assume that we have an active validator set with 716,800 validators prior to EIP-7251. The stakers in this validator set choose to combine some of their validators to a greater or lesser extent, and may in fact leave several of their validators unconsolidated, i.e. at 32 ETH.
We visualise this hypothetical consolidation of the validator set in Figure 3 below.
We group the stakers into five categories:
- Small-scale solo stakers (32 - a few hundred ETH)
- Large-scale individual solo stakers (1000+ ETH)
- Large-scale institutional solo stakers (ie. companies staking their own ETH)
- Centralised staking pools
- Semi-decentralised staking pools (e.g. Rocketpool, Lido… )
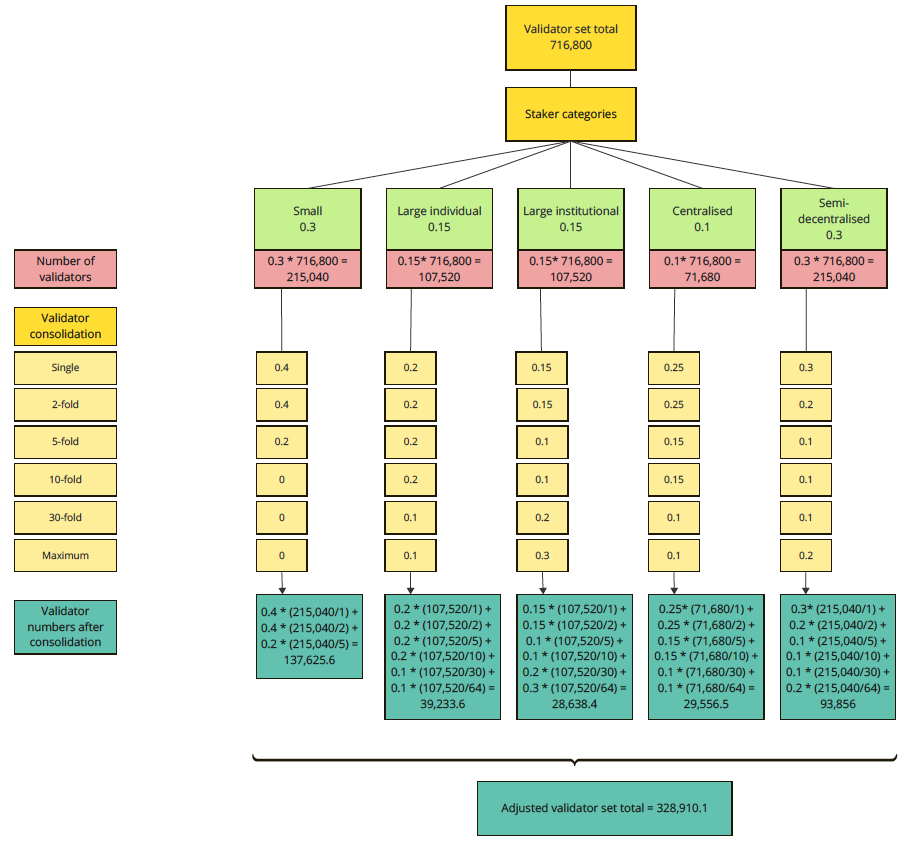
Figure 3: Visual representation of the example scenario for validator consolidation
We put a potential distribution over the various validator consolidations in our scenario for illustrative purposes. The distributions can be adjusted as required.
The Validator numbers after consolidation row (green) shows the reduced validator numbers for each category, using the consolidations shown in each column (yellow).
Based on the chosen configuration, the total validator set size reduces to 329,810 (last value in the diagram).
Bayesian network for proposer selection
We built a simple Bayesian network (BN) to illustrate the dependencies between the different nodes in the BN model for the example scenario described above (Figures 4 and 5).
A Bayesian network (BN) is an acyclic directed graph of nodes and edges. The nodes represent the key factors of the system or problem being modelled, and the edges between the nodes indicate dependencies. Uncertainty and the stength of the dependencies between connected nodes are explicitly captured in the node probability tables that are attached to each node in the model. An object-oriented version of a BN (OOBN) may be used to make BNs less cluttered and more readible, by grouping related nodes and processes in OOBN submodels. [2]
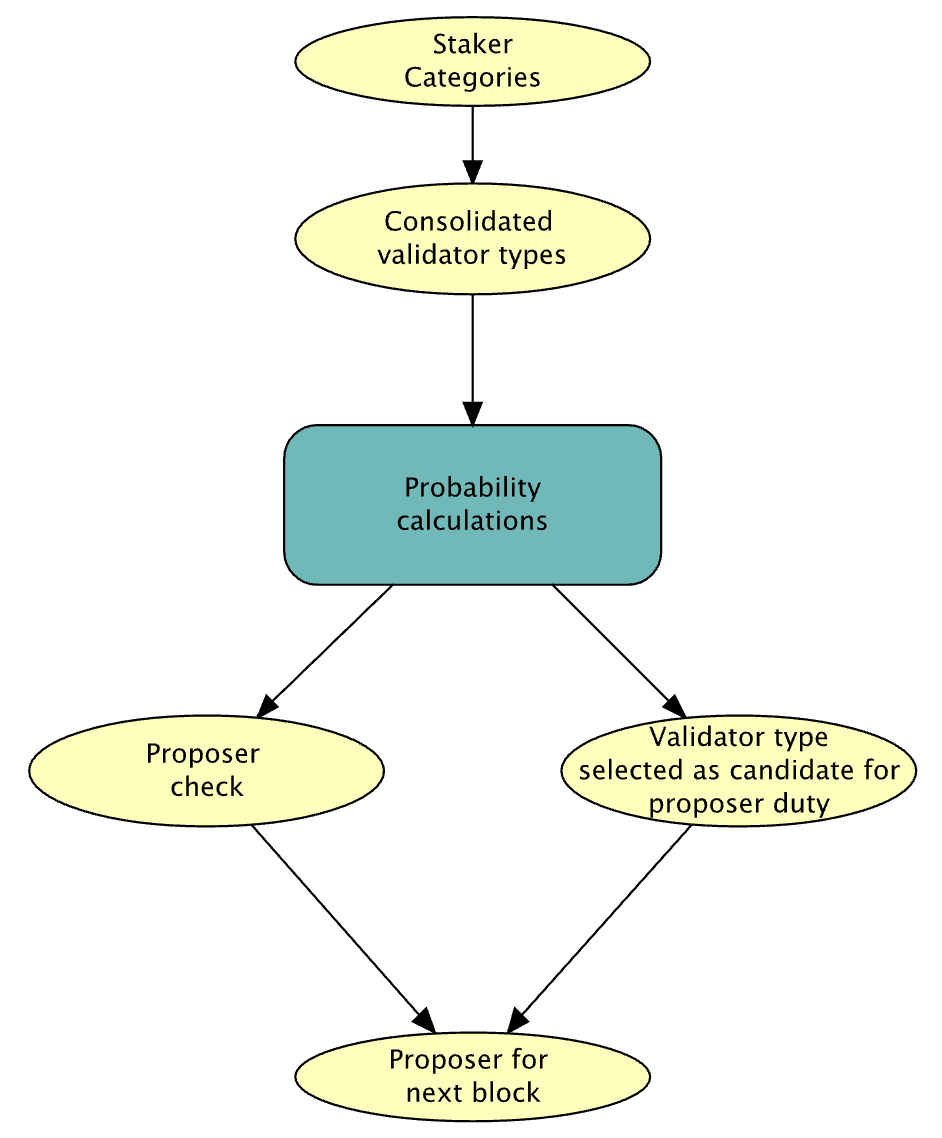
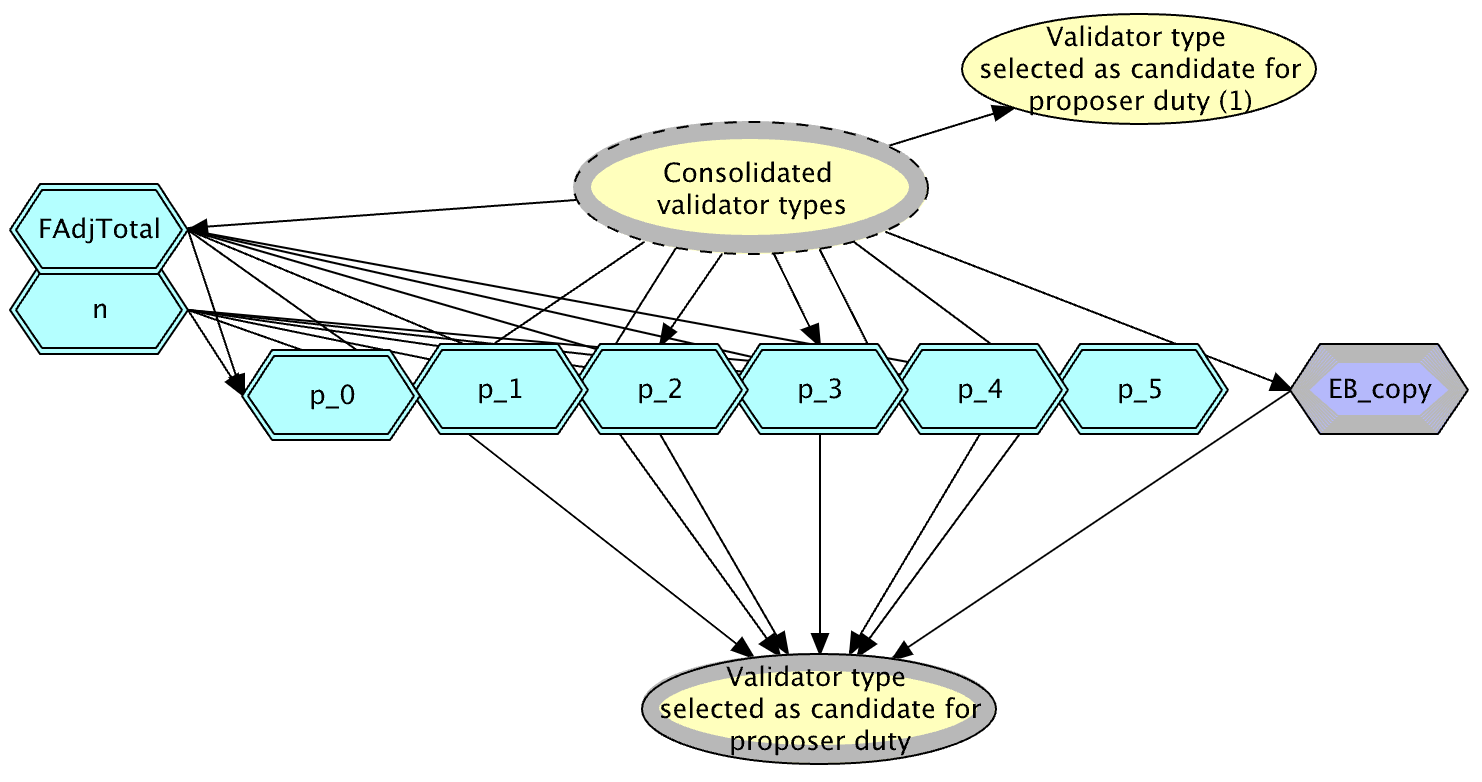
Figure 4: OOBN for proposer selection Figure 5: OOBN subnet for probability calculations
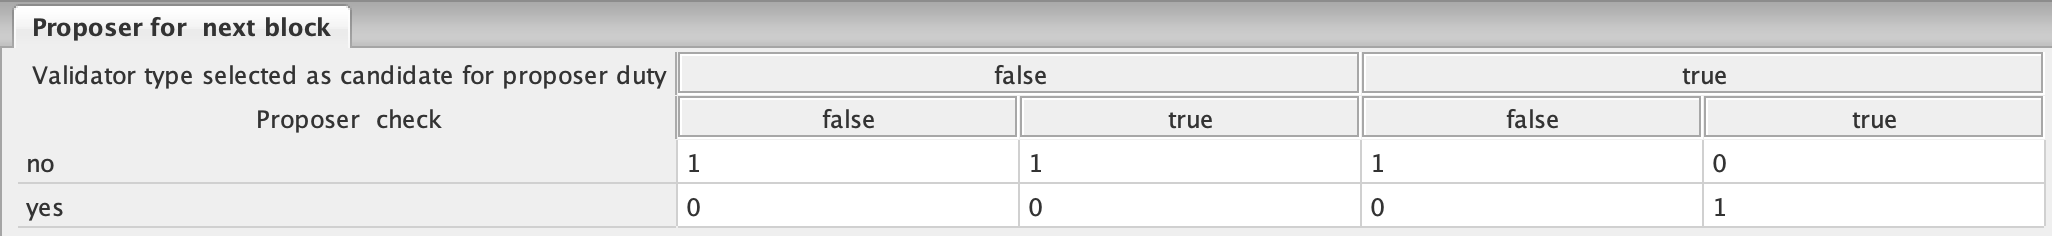
We calculate the probability that a validator is selected and passes the check for proposer eligibility, as the product of the probability of being the candidate index and the probability of passing the proposer check, since these two events are independent, i.e.
P(A \cap B) = P(A/B)P(B) = P(A)P(B).
The probabilities shown in Figure 2 above are used in the node probability table for BN node Proposer check, which captures the probability that a validator will pass the proposer eligibility check for the various consolidated validator sizes.
Using the logic from the equation above and the previous calculations for the probability that a validator passes the eligibility check, we can now determine:
- the probability for a validator from each consolidation group (e.g. single, 2-fold, etc) to be selected as a candidate validator from the shuffled validator indices, and
- the probability that this candidate type will pass the eligibility check for being a proposer.
These probabilities are shown in Table 1 below in the last two columns, and are used to populate the probability node tables for BN nodes Validator type selected as candidate for proposer duty and Proposer for next block, respectively.
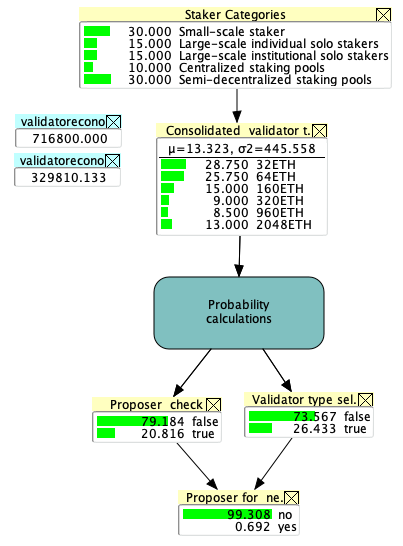
For the example scenario described above and assuming a validator set size of 716,800, we can use the BN model to gain some insights into the probabilities of different ‘types’ of validators. By ‘type’ we mean the extent to which the validator has been consolidated.
Running this model generates the marginal probabilities shown in Figure 6(a). The proportion of validator categories in the reduced validator set are visible in BN node Consolidated validator types and are in the second column of Table 1.
We see that based on the configuration of the various types of validators, the active validator set reduced to 329,810.
Table 1: Probability that validator type is selected as a candidate proposer
| Type of validator consolidation |
Proportion of validators consolidating |
Number of validators in consolidated validator set |
P(validator type selected as candidate) |
P(selected validator type is next proposer) |
|---|---|---|---|---|
| Single | 28.75% | \frac{0.2875 * 716,800}{1} = 206,080 |
\frac{206,080}{329,810} = 0.6248 | 0.6248 * 0.016 = 0.0100 |
| Partial (2-fold) | 25.75% | \frac{0.2575 * 716,800}{2} = 92,288 |
\frac{92,288}{329,810} = 0.2798 | 0.2798 * 0.031 = 0.0087 |
| Partial (5-fold) | 15.00% | \frac{0.1500 * 716,800}{5} = 21,504 |
\frac{21,504}{329,810} = 0.0652 | 0.0652 * 0.078 = 0.0051 |
| Partial (10-fold) | 9.00% | \frac{0.0900 * 716,800}{10} = 6,451 |
\frac{6,451}{329,810} = 0.0196 | 0.0196 * 0.156 = 0.0031 |
| Partial (30-fold) | 8.50% | \frac{0.0850 * 716,800}{30} = 2,031 |
\frac{2,031}{329,810} = 0.0062 | 0.0062 * 0.469 = 0.0029 |
| Full (64-fold) | 13.00% | \frac{0.2875 * 716,800}{64} = 1,456 |
\frac{1,456}{329,810} = 0.0044 | 0.0044 * 1 = 0.0044 |
| TOTAL | 100.00% | 329,810 | 1.0000 |
(a) (b) (c)
(d) (e) (f)
Figure 6: Running proposer selection model for various scenarios
Running the OOBN model
Scenario 1: Running the model with no evidence provided (a)
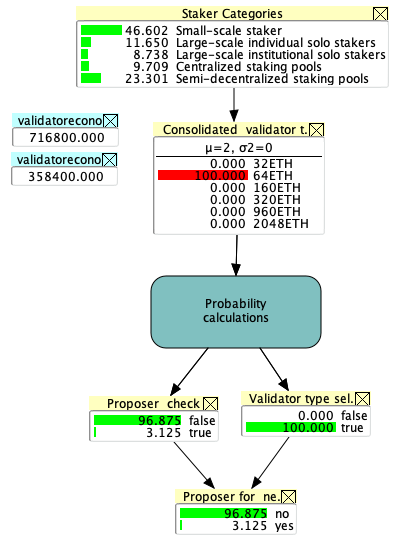
The result of running the BN model is shown in Figure 6(a). Therefore, assuming the active validator set consists of the staking categories as described along with their respective example consolidation strategies, the validator set will be reduced to 329,810 from 716,800. This adjusted validator set has different proportions of consolidated validators as shown in node Consolidated validator types. Across this validator set, the proportion of validators that will pass the proposer test is 20.8% and the marginal probability, across the various validator types in the validator set, of being selected as the first candidate is 26.4%, and of being the proposer of the next block is 0.69%.
The probability of being the next proposer depends on being selected as the next candidate and then passing the test. It appears counter-intuitive that the probability is so much smaller than the individual probabilities in the BN. The reason for this becomes clearer when we look at the conditional probability table of this node:
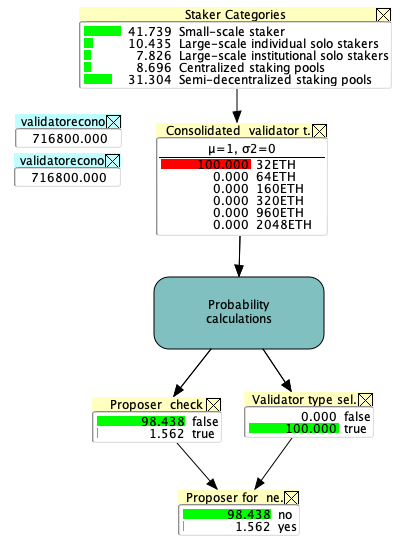
Scenario 2: Running the model with all validators having 32 ETH (b)
If we enter evidence (shown as a state of a node being red) that the validator set consists entirely of unconsolidated validators, and therefore there is no reduction in the size of the validator set, the probability of selecting an unconsolidated validator type is understandably 100%, with the probability of passing the proposer check being 1.56%. Therefore the probability of an unconsolidated proposer being the proposer of the next block is simply its probability of passing the proposer check, which is 1.56%.
Scenario 3: Running the model with all validators having 64 ETH (\textbf{c})
In this scenario we assume that all stakers decided to consolidate their validators into 64 ETH validators. Here the validator set size reduces to 358,400. As in Scenario 2, the first selected validator type will be a validator with 64 ETH, i.e. 100%. For a validator with an EB of 64 ETH, the probability of passing the proposer check is 3.12%, meaning that the probability of a validator type of 64 ETH being the next proposer is 3.12%.
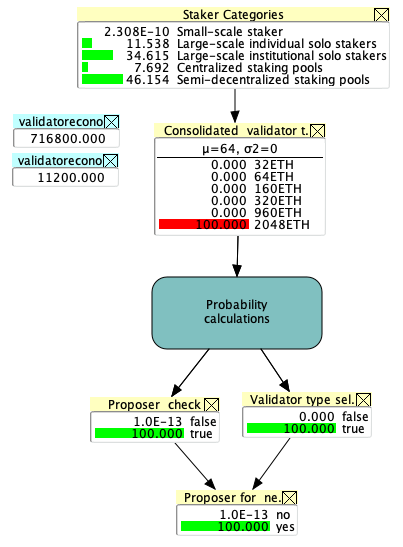
Scenario 4: Running the model with all validators having MaxEB (2,048 ETH) (d)
In this scenario we assume that all stakers decided to consolidate their validators to the maximum allowed, i.e. 2,048 ETH. This is the largest reduction in validator set size, being just 11,200. As in Scenarios 2 & 3, the first selected validator type will definitely be a validator with an EB of MaxEB. For MaxEB the probability of passing the proposer check is 3.12%, meaning that the probability of a validator type of 64 ETH being the next proposer is 3.12%.
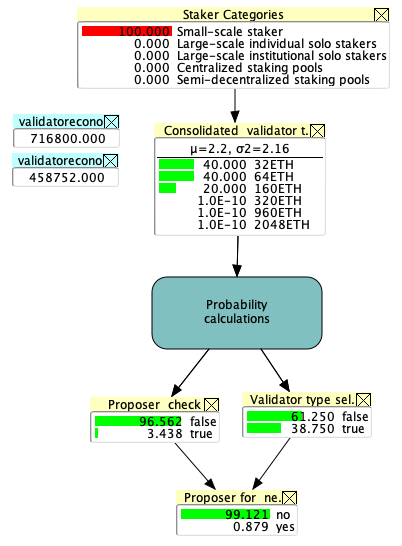
Scenario 5: Running the model assuming the validator set consists only of small-scale stakers applying the example consolidation strategy (e)
The small staker group is assumed to mainly consist of validators with 32 or 64 ETH, with a small proportion consolidated into 160 ETH validators. Based on this strategy, the validator set reduces to 458,752. Across these small staker validators, the proportion that will pass the proposer test is 3.44% and the marginal probability, across the three validator types in the validator set, of being selected as the first candidate is
38.75%, and of being the proposer of the next block is 0.88%.
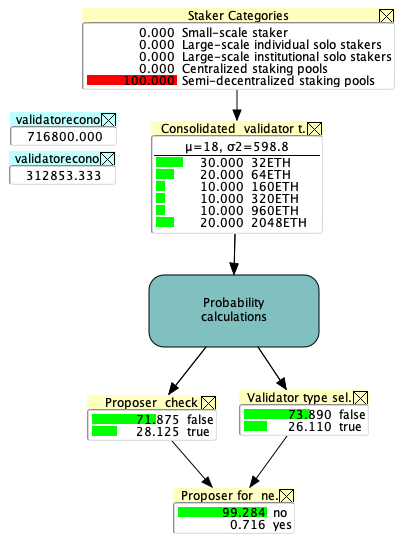
Scenario 6: assuming the validator set consists only of semi-decentralized staking pools applying the example consolidation strategy (f)
In the example consolidation strategy for semi-decentralized staking pools, they are assumed to have a fairly even spread across the various extents of consolidation, with a slight majority of single stake validators. Based on this strategy, the validator set reduces to 312,853. Across this validator set, the proportion of validators that will pass the proposer test is 28.13% and the marginal probability, across the three validator types in the validator set, of being selected as the first candidate is
26.11%, and of being the proposer of the next block is 0.72%.
Online version of Proposer Selection OOBN model
We used HUGIN EXPERT when constructing the proposer selection model. Hugin made the proposer selection OOBN model freely available online with some widgets to allow interaction with the model.
Increased proposer selection time
As pointed out in the ethresear.ch post Increase the MAX_EFFECTIVE_BALANCE – a modest proposal, the expectation is that the increase in MaxEB “will slightly increase the time it takes to calculate the next proposer index (lower values of EB will result in lower probability of selection, thus more iterations of the loop)”. We demonstrate this in the graph below where we use a negative binomial to estimate the number of failed proposer eligibility checks before a solo validator passes the check.
We only looked at proposers with 32 ETH effective balances, so the probability of passing the proposer check was 0.016. Therefore the graph shows us the probability distribution of the number of failures of the check before the first successful proposer check [^2].
When we iterate through the shuffled validator indices, we observe that before a “successful” candidate is reached, all the candidates ahead of the eventual proposer in the shuffled index had to have been rejected.
However, given the large active validator set, the probability calculations based on a large finite sample assumption hold and do not materially change the calculations, and are valid in this case.
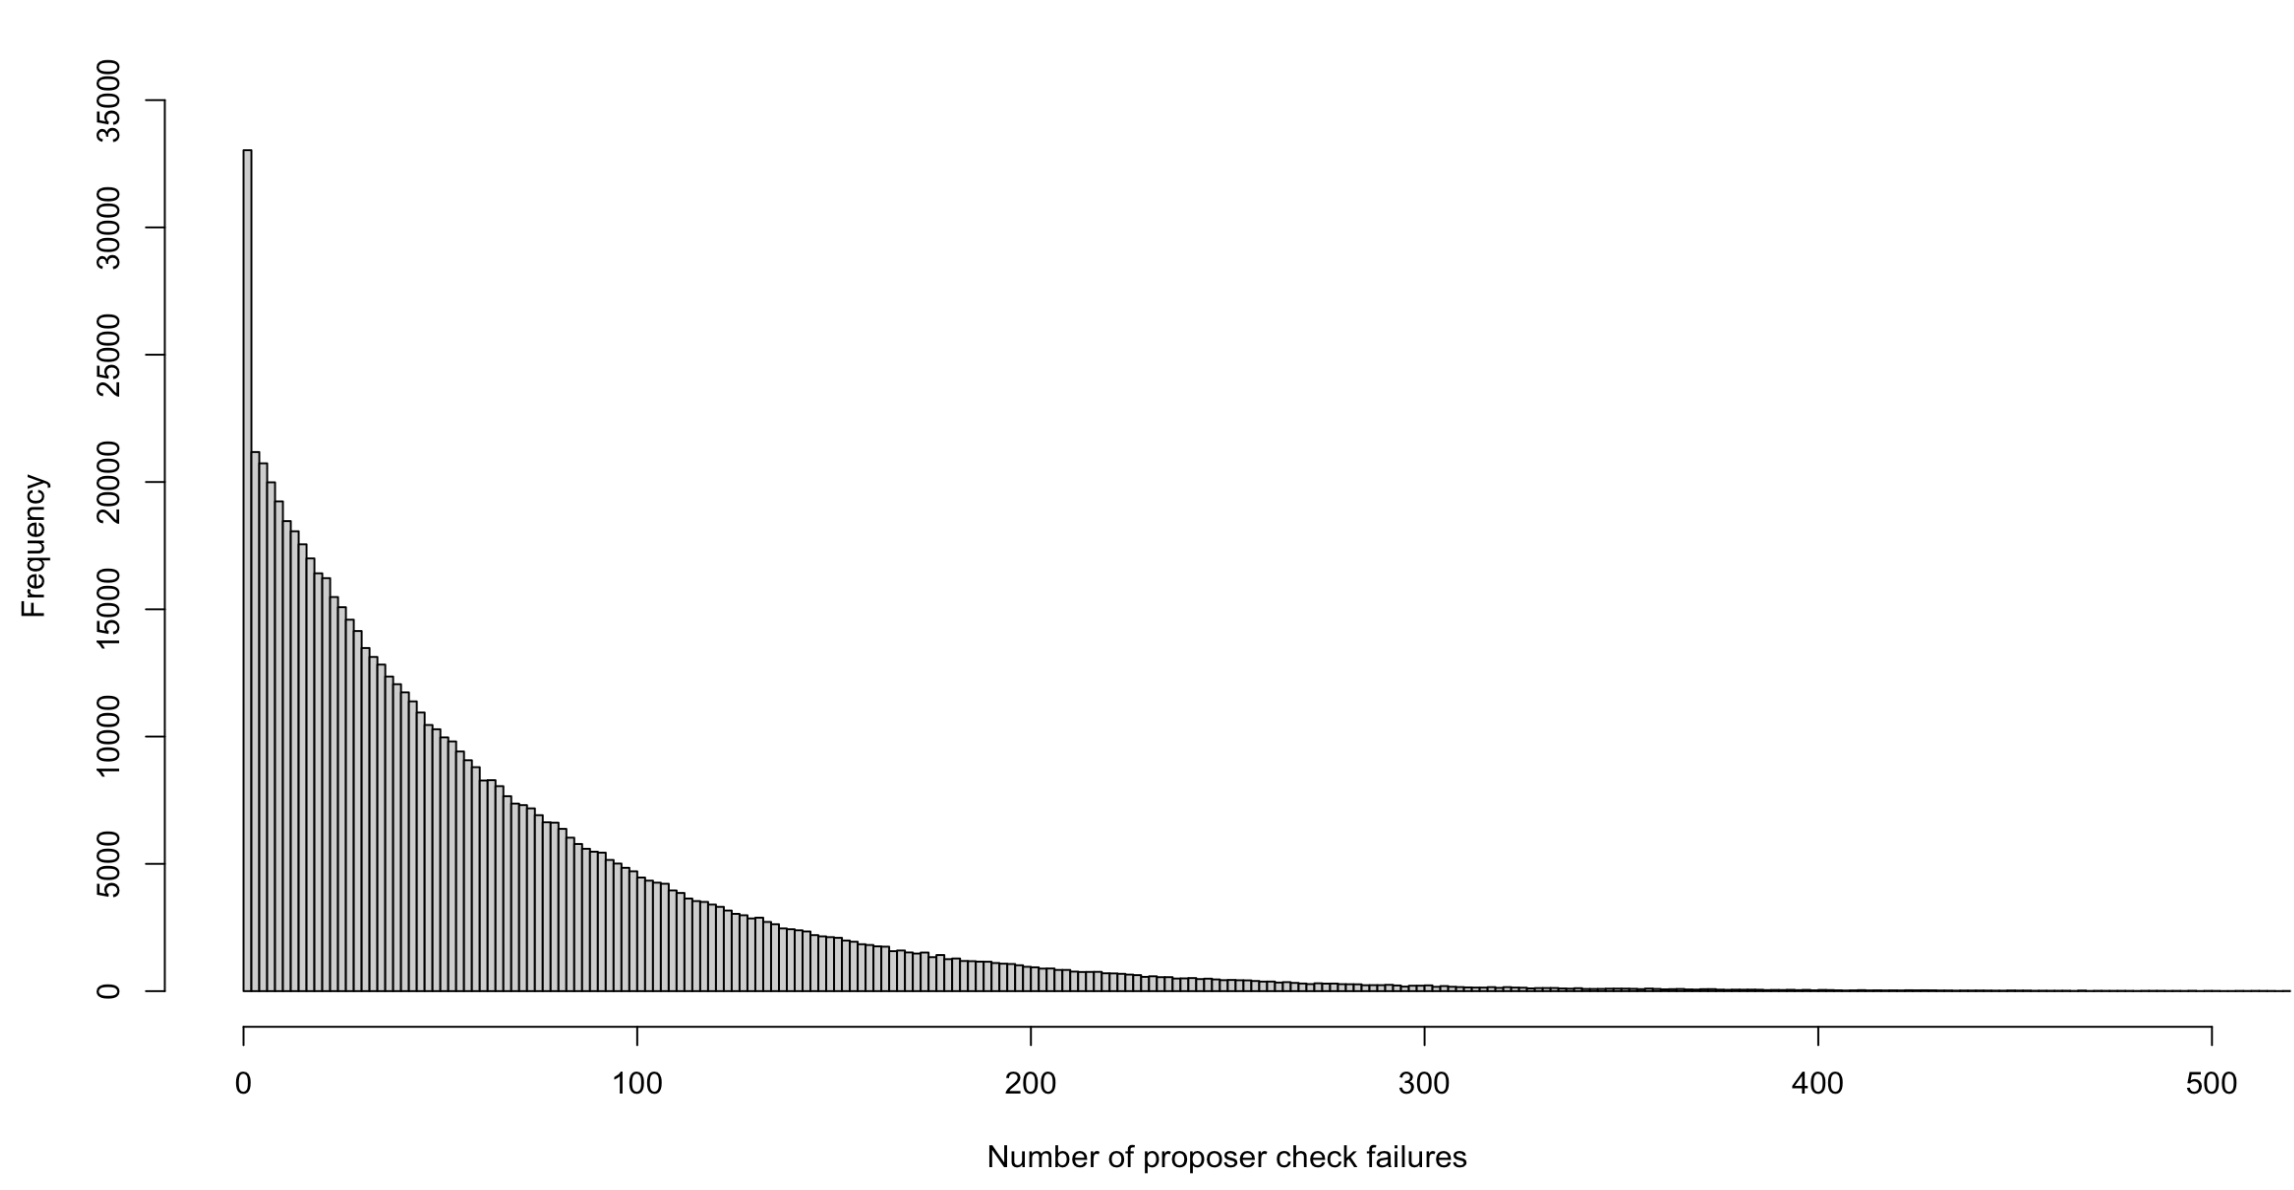
Figure 3: Visual representation of the number of failures for solo stakers before a candidate single validator passes the proposer check
The median value for the number of failures is 43, i.e. we can expect that half of the time more than 43 iterations will be required and half the time fewer than 43 iterations.
Apart from the median, it is also interesting to quantify other probabilities, such as:
- Probability of fewer than 100 iterations
= 0.7962 - Probability of more than 100 iterations
= 1 - 0.7962 = 0.2038 - Probability of more than 200 iterations
= 0.0422 - Probability of more than 300 iterations
= 0.0087 - Probability of more than 400 iterations
= 0.0018
Staker dilemma: Consolidate or not??
The probability of being selected as the candidate from the shuffled consolidated validator set of size n is the same for each validator, regardless of the extent of consolidation, viz. \frac{1}{n}.
So if staker A has 64 single validators and staker B has one consolidated staker, then the probability that a validator from staker A or staker B is the next proposer is calculated as follows:
P(staker \texttt{ } A \texttt{ } is \texttt{ } next \texttt{ } proposer) =
\frac{64}{n} * \frac{32}{2048} = \frac{1}{n}
P(staker \texttt{ } B \texttt{ } is \texttt{ } next \texttt{ } proposer) =
\frac{1}{n} * 1 = \frac{1}{n}
From this we can deduce that for this scenario, as far as proposer selection is concerned, it is equally likely for for a large staker that one of their validators will be the next proposer, regardless of whether they decide to consolidate validators to the full MaxEB, or leave them all as unconsolidated.
However, there are several other considerations for a staker to take into account when deciding on a consolidation strategy, such as rewards earned, slashing risk and penalties that vary with effective balance. Proposer selection is just one part of the puzzle.
References
[1] Viet Tung Hoang, Ben Morris & Phillip Rogaway (2014): An Enciphering Scheme Based on a Card Shuffle. arXiv:1208.1176
[2]: S. Johnson et al. (2013): “Modeling the viability of the free-ranging cheetah population in Namibia: an object-oriented Bayesian network approach,” Ecosphere, vol. 4, no. 7, link to journal article