The Anatomy of Ethereum’s State Access
1. Introduction
Every Ethereum transaction reads and writes pieces of the chain’s state: account balances, nonces, codes, and the storage slots. As the chain grows, more of that state goes untouched for a long time, which is why several proposals look at different ways of dealing with state growth, such as separation of dormant state from active state, expiring dormant state and creating new forms of state. To best help with the research, this report is set out to answer:
- What does state access and creation look like over Ethereum’s history?
- How much state is touched over a given period?
- Are writes mostly creations, updates, or deletions?
- Are reads fetching real data, or just probing for existence?
- How concentrated is the activity?
- How effective would an in-protocol state-tiering scheme be?
2. Summary
- Writes are state growth, not churn. About 55% of written slots are created once and never touched again. The two-thirds of write events that are updates concentrate on a small, repeatedly-hit hot set.
- The read-only set is small and mostly empty probes. Slots read but never written are under 8% of state, and 83–93% of those are existence checks rather than populated reads.
- State access is extremely concentrated. The top 1% of read accounts has captured ~96–98% of read accesses since 2022, led by stablecoins, DEXes, and block builders.
- The warm set is essentially the write set. Even with populated reads, it adds only 4–9% on top of writes.
- A write-age tier covers update gas cheaply. 94% of slot update SSTOREs (97% for accounts) already sit on warm state at a 30-day window, so the Inactive premium hits only 3–6% of updates.
- A ~30-day window is the sweet spot. It covers ~94% of warm updates while keeping only ~3% of state Active. Wider windows buy little extra coverage for far more warm state.
3. Data and method
T is the window length in days. The windowed tables throughout end at mainnet block 24,870,000, and §5.1 and §6 also replay them weekly across post-Merge history. Windows are T ∈ {1, 7, 14, 30, 60, 90, 180, 365} days. Object types are accounts and storage slots.
All source tables are extracted from Xatu. The SQL queries are included here.
| set | table |
|---|---|
| writes (accounts) | canonical_execution_balance_diffs, canonical_execution_nonce_diffs, canonical_execution_contracts |
| writes (slots) | canonical_execution_storage_diffs |
| reads (slots) | canonical_execution_storage_reads |
| reads (accounts, direct) | canonical_execution_balance_reads, canonical_execution_nonce_reads |
| reads (accounts, derived) | canonical_execution_address_appearances |
Set definitions
For each (T, object_type):
- W: objects created, modified, or deleted in the window.
- R: objects only read, never written, in the window.
- R⁺: the objects in R whose reads return a nonzero (populated) value.
- R∪W = W + R: all objects touched in the window. R⁺∪W = W + R⁺ is the populated warm set, used as the warmth measure in §5.1.
We write |W| for the number of objects in W, and likewise |R|.
In practice every written object is also read in the same window. A slot’s SSTORE is preceded by a read, and a sender’s nonce is read to validate the transaction that writes it. So R counts only the explicit reads (such as SLOAD) that add something beyond W.
Granularity and known gaps
- System-call state is not recorded. The per-block protocol writes to the EIP-4788 beacon-root, EIP-2935 blockhash-history, and EIP-7002/7251 request-queue contracts do not appear.
- Consensus-layer withdrawals are not recorded. Validator withdrawals credit execution layer addresses without an EVM write, so withdrawal-only recipients are missing from W. That is a few tens of thousands of addresses, well under 1% of the account write set.
4. What state access and creation looks like
A slot or account can be touched in many ways. This section attempts to explore the patterns of state writes and reads.
4.1 Write structure
A storage write is one of three transitions, and most written slots are created once and never touched again. Two views follow: the all-time event totals, then how the slots written in a window break down by lifecycle.
Write events over the entire chain history
Every write event from the first state activity (block ~46k, July 2015) to block 24,870,000.
Slot write events (9.20B total):
| transition | events | share |
|---|---|---|
| update (x→y) | 6,109,404,842 | 66.4% |
| create (0→x) | 2,323,710,153 | 25.3% |
| delete (x→0) | 765,554,231 | 8.3% |
Account write events:
| source | metric | events | share |
|---|---|---|---|
| balance changes (8.55B) | adjust (x→y) | 7,965,568,085 | 93.1% |
| fund (0→x) | 385,657,967 | 4.5% | |
| drain (x→0) | 203,518,204 | 2.4% | |
| nonce changes (3.42B) | subsequent | 3,043,409,094 | 89.0% |
| first use (from 0) | 376,865,812 | 11.0% | |
| contract creations | creations | 100,078,703 | n/a |
Two things stand out:
- Write traffic is update-dominated: over 66% of all slot write events ever are updates.
- A third of all slots ever created have been deleted.
The lifecycle of a written slot
Each write event is one of three transition types (values are net per transaction, §3):
- C (create):
0 → x, an empty slot becomes set. - U (update):
x → y, a set slot’s value changes. - D (delete):
x → 0, a set slot is cleared.
Every written slot is then classified by which transition types it saw in the window, and a slot can see a type more than once:
- C: created once, then untouched. A second create needs a delete first, so a C slot has exactly one create.
- U: updated one or more times, never created or deleted. A slot that existed before the window and modified in place.
- D: deleted once, never created or updated. A pre-existing slot cleared.
- C+U: created once, then updated one or more times, not deleted. With no delete it has exactly one create, and the
+Ucovers one update or many. - C+D: created and deleted but never updated, one or more birth-and-death cycles.
- U+D: updated one or more times, then deleted. Existed before the window.
- C+U+D: created, updated one or more times, and deleted, a full lifecycle.
The table below shows the composition averaged over the post-Merge sweep, weighting each weekly anchor equally:
| T (days) | C | C+U | U | C+U+D | C+D | U+D | D |
|---|---|---|---|---|---|---|---|
| 30 | 53.3% | 8.2% | 14.4% | 2.8% | 12.1% | 0.8% | 8.4% |
| 90 | 54.9% | 9.2% | 11.4% | 3.3% | 12.9% | 0.7% | 7.7% |
| 180 | 55.5% | 10.0% | 9.4% | 3.7% | 13.6% | 0.6% | 7.2% |
| 365 | 55.4% | 11.4% | 7.0% | 4.2% | 14.7% | 0.5% | 6.8% |
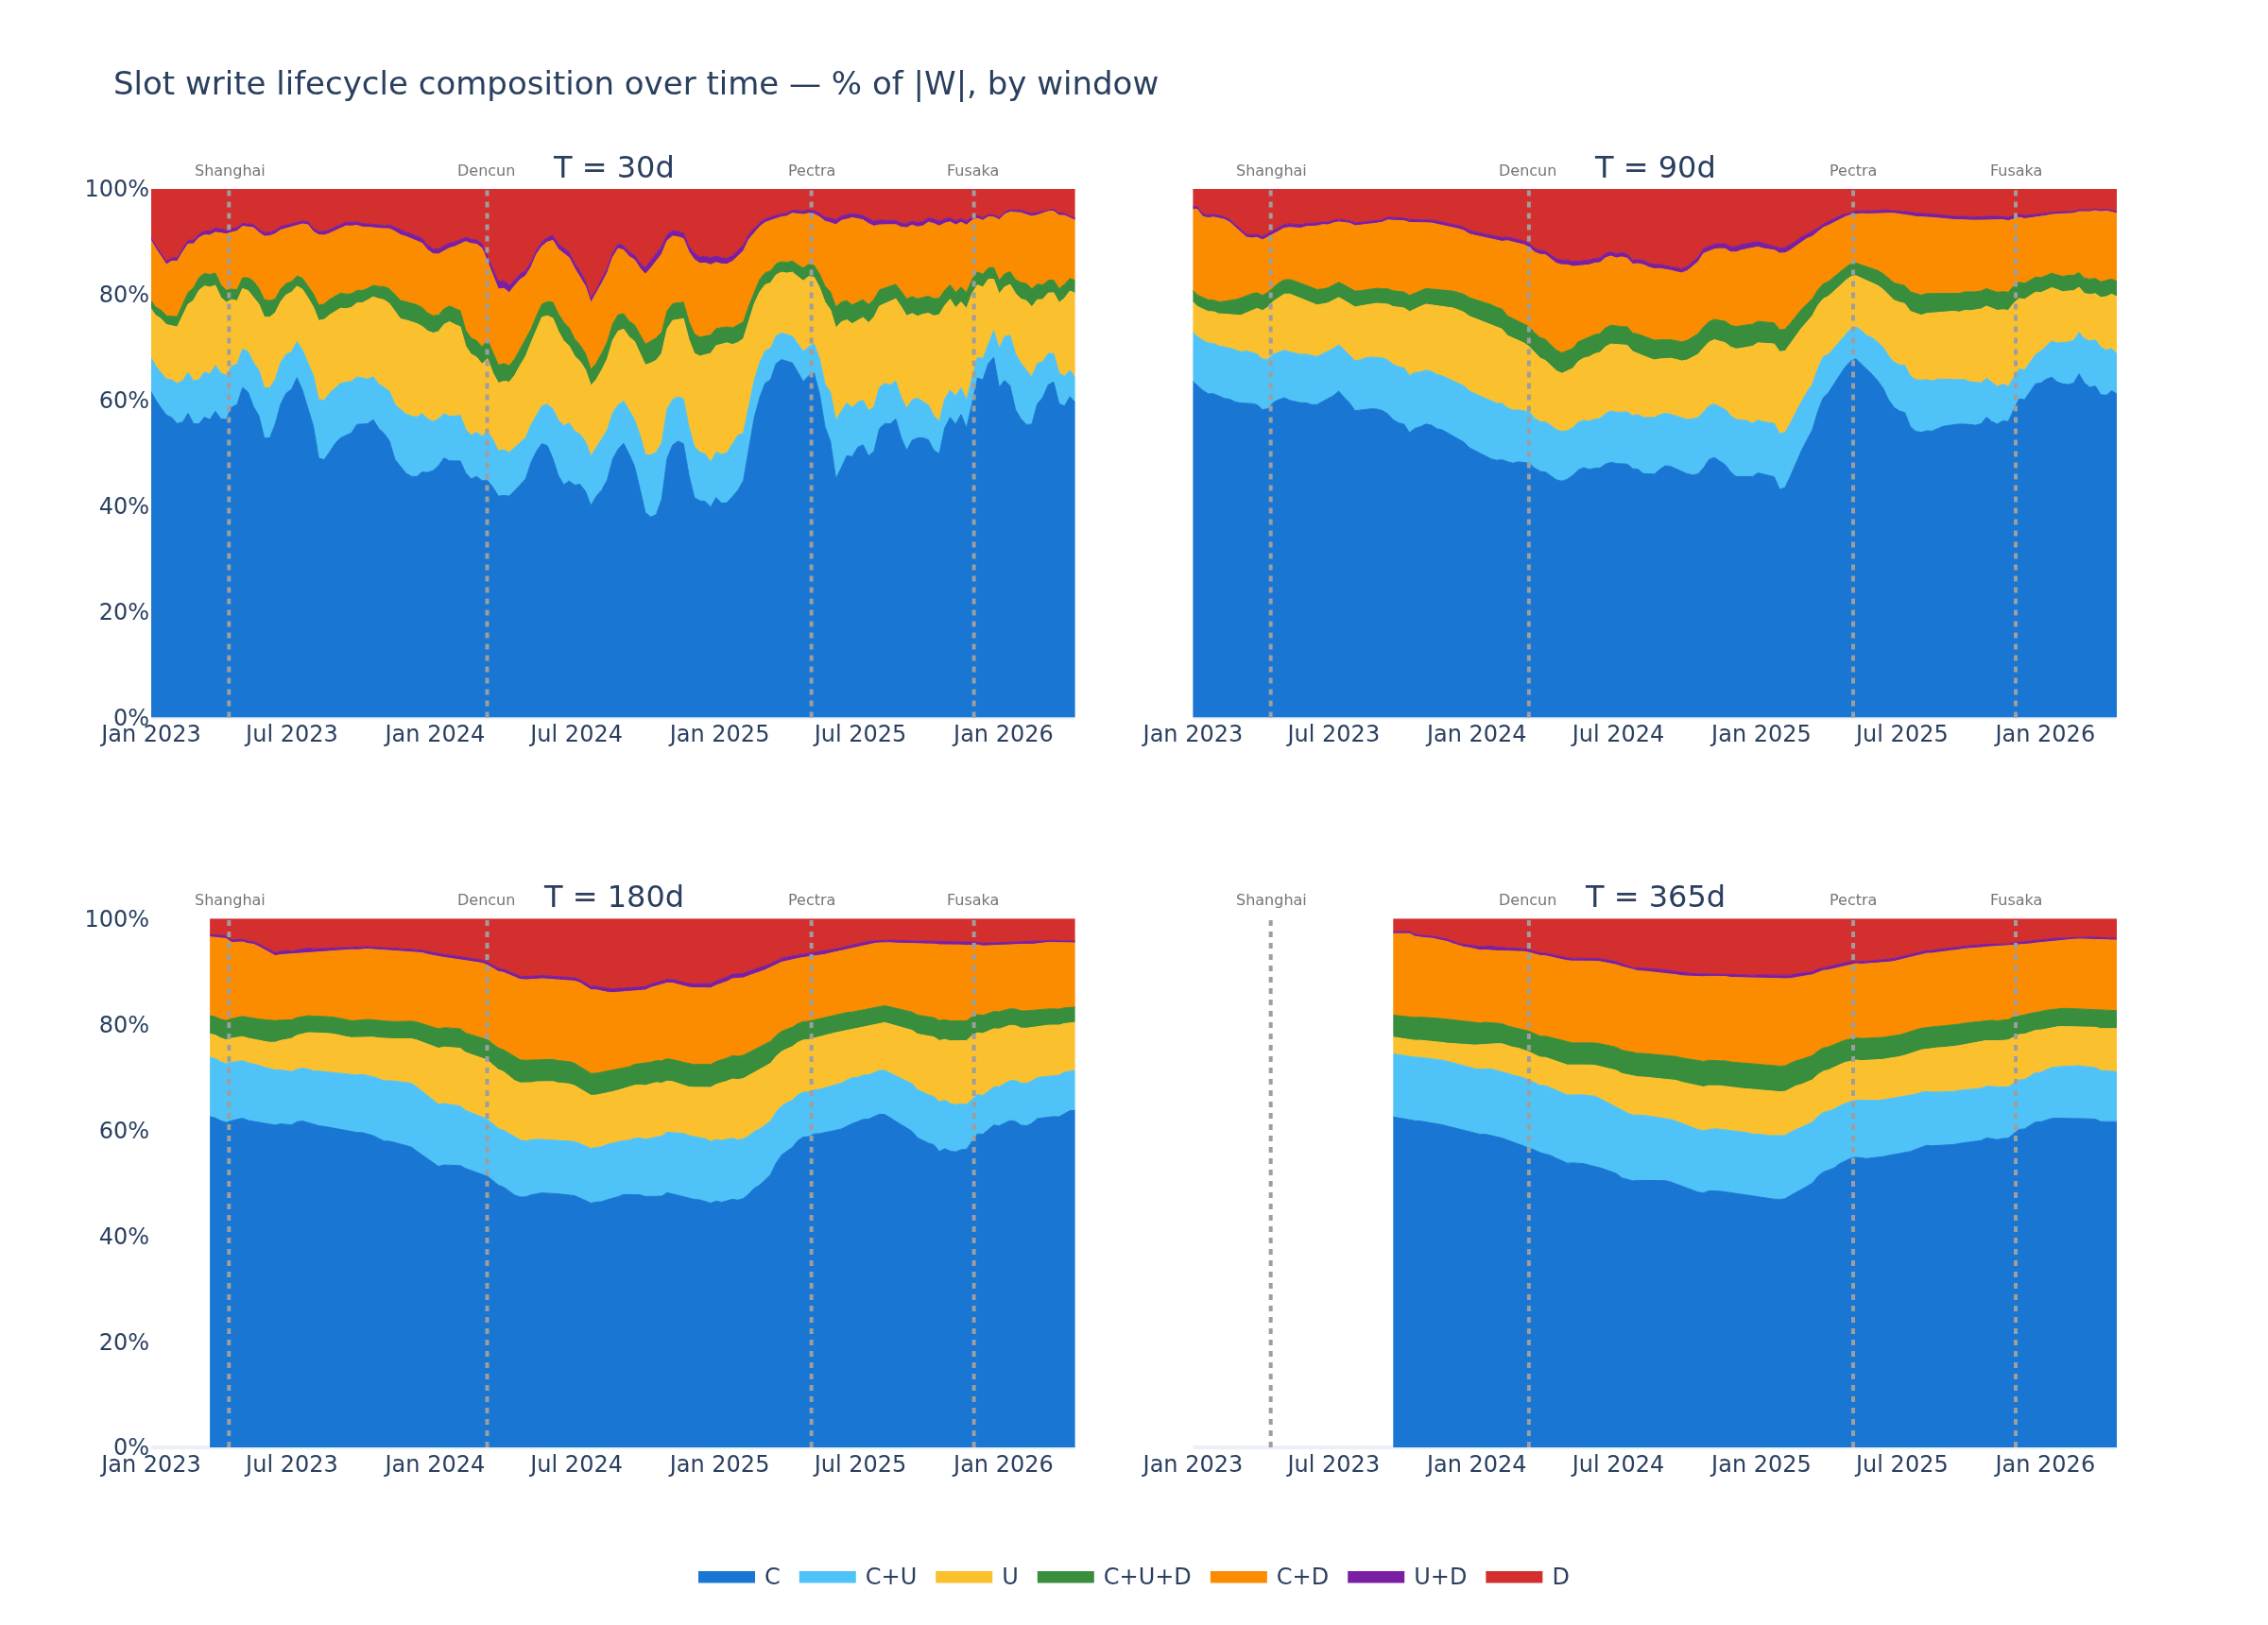
Creation dominates at every window, ~55% of |W|. Most slots are initialized in window and never touched again, which is state growth rather than churn. C is also the most volatile class. At T=30 it swings between 38% and 68% week to week, dipping through the 2024 activity surge and recovering after.
C+D is the largest mixed class, ~12–15% of |W|. These are ephemeral slots born and died inside the window. The share is steady at every window across the timeline.
Creation dominates more at longer windows. The create-bearing classes (C, C+U, C+D, C+U+D) are ~76% of |W| at T=30 and ~86% at T=365, while pure in-place updates (U) halve from 14% to 7%. A longer window captures more of each slot’s birth, so the write set looks even more growth-driven the further back it reaches.
4.2 Read structure
Reads can have two different return values: either zero or nonzero. As with writes, two views follow, the all-time totals and the per-window split over time.
Read events over the entire chain history
Every read event over all of history.
Slot read events (23.69B total, 2.6× the write events):
| returned value | events | share |
|---|---|---|
| nonzero | 16,552,716,483 | 69.9% |
| zero | 7,138,221,664 | 30.1% |
Account read events:
| source | metric | events | share |
|---|---|---|---|
| balance reads (15.10B) | nonzero | 9,845,422,896 | 65.2% |
| zero | 5,251,717,095 | 34.8% | |
| nonce reads (13.64B) | nonzero (post-increment, never 0) | 13,637,765,012 | 100% |
| appearances (41.98B) | internal-call target / caller | 15.74B each | 37.5% each |
| tx sender / fee recipient / tx recipient | 3.39B each | 8.1% each | |
| contract creator / new contract | ~100M each | 0.24% each | |
| selfdestruct caller / refund recipient | ~60M each | 0.14% each |
The fee recipient is the block proposer credited the transaction’s priority fee, not a consensus-layer withdrawal (those are not recorded).
As shown, most read events are nonzero for both accounts and slots. These read totals include the reads coupled to writes, since every write is preceded by a read (one SLOAD per SSTORE). The write-coupled reads equal the write count exactly, so for slots they are ~35% of all read events, leaving ~65% as genuine reads beyond the write set.
What reads return
Each read in R returns zero (an empty-slot probe, “is this slot set?”) or nonzero (populated data). R holds only objects read but not written in the window. As a share of |R|, averaged over the weekly post-Merge sweep:
| T (days) | zero-only | nonzero-only |
|---|---|---|
| 30 | 82.5% | 17.5% |
| 90 | 87.1% | 12.8% |
| 180 | 89.8% | 10.1% |
| 365 | 92.6% | 7.4% |
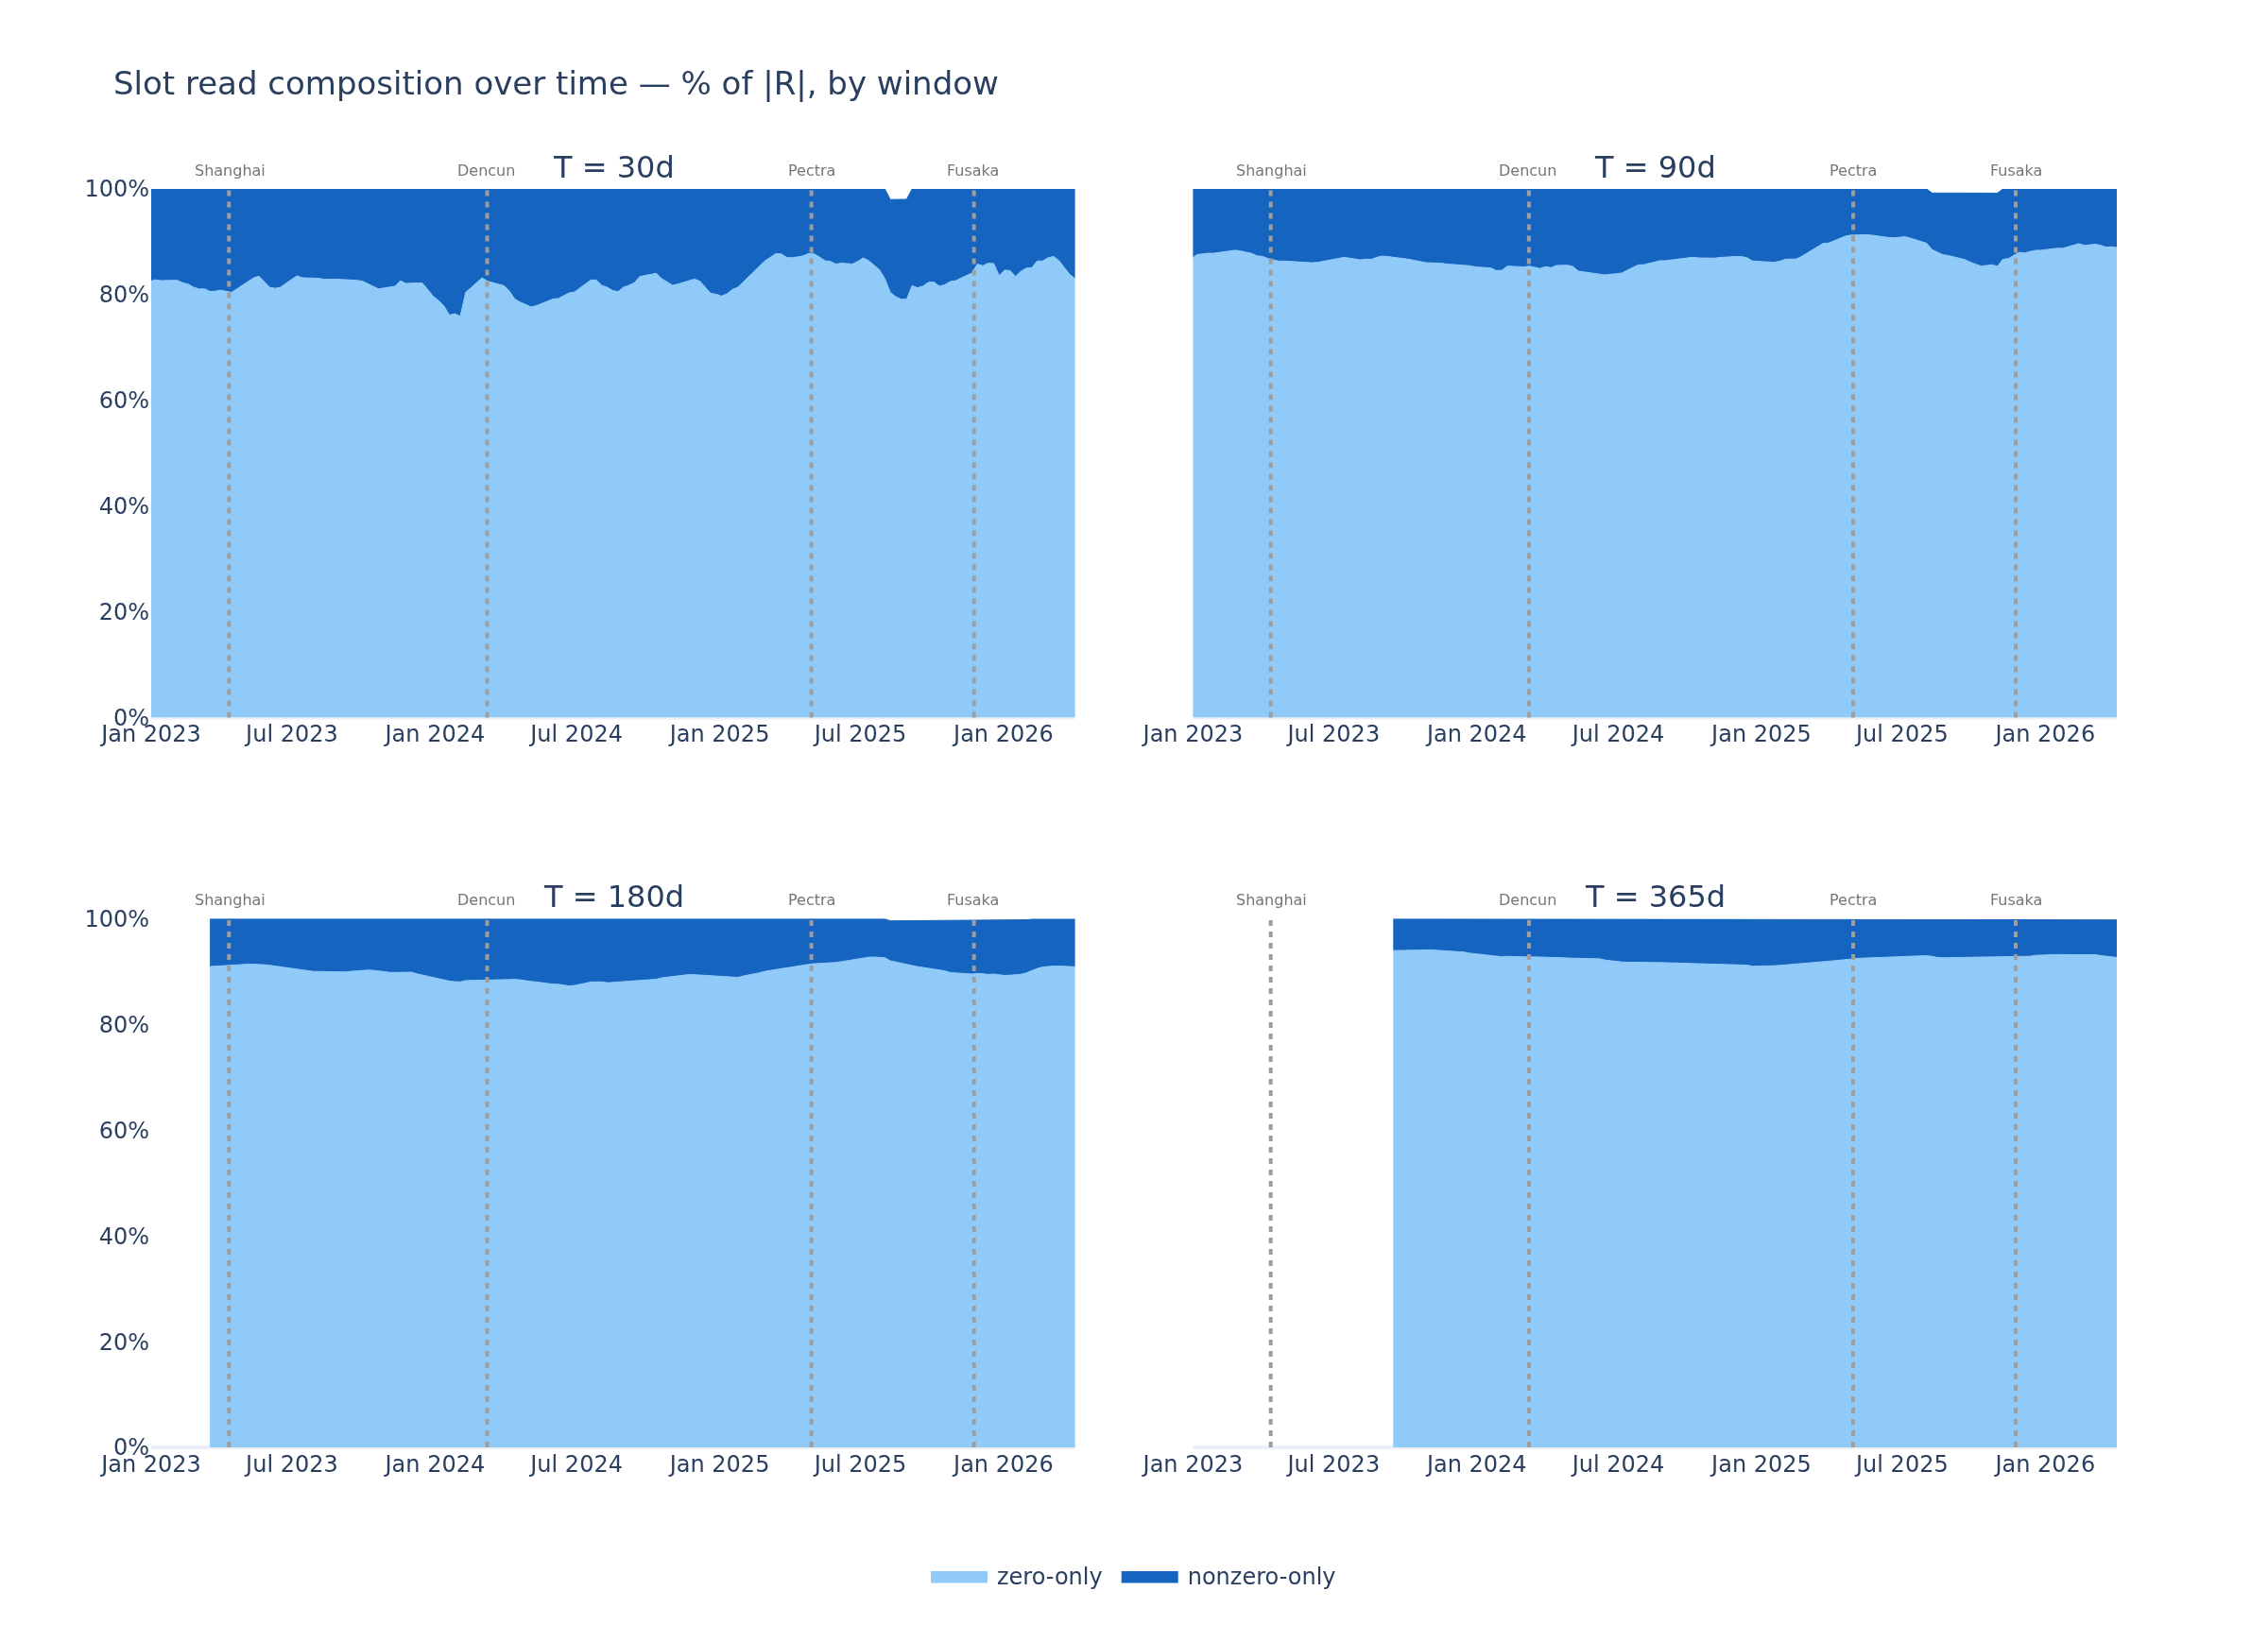
Most of R is empty-slot probes. Only ~7–18% of R is actual populated read, and that share shrinks as the window widens.
This does not contradict the 69.9% nonzero in the all-history table above. They count different things. The 69.9% is per event: of every SLOAD ever, ~70% hit a populated slot, because a small set of hot populated slots is read over and over. The ~7–18% here is per distinct slot in the read-only set R: most slots that are only read in a window are one-shot existence probes, each hit once. Weighted by read events, populated reads dominate. Weighted by objects, empty probes do take up a larger share.
5. Warmth and concentration
This section checks how much of the state is “warm” (touched in a window) and how concentrated the accesses are across objects.
5.1 Warmth: how much state is active
Each value is the mean across the weekly post-Merge sweep, one per window. The read-only column is R⁺, counting only reads that return a nonzero (populated) value, so empty-slot probes are excluded from the warm set.
Slots (mean share of live slots):
| T (days) | W | R⁺ | R⁺∪W |
|---|---|---|---|
| 30 | 2.82% | 0.21% | 3.03% |
| 90 | 7.55% | 0.39% | 7.95% |
| 180 | 13.60% | 0.55% | 14.15% |
| 365 | 24.17% | 0.70% | 24.88% |
Accounts (mean share of live accounts):
| T (days) | W | R⁺ | R⁺∪W |
|---|---|---|---|
| 30 | 3.30% | 0.46% | 3.76% |
| 90 | 7.94% | 1.07% | 9.01% |
| 180 | 13.45% | 1.79% | 15.24% |
| 365 | 23.08% | 2.51% | 25.59% |
Combined (mean share of slots and accounts against the total state):
| T (days) | W | R⁺ | R⁺∪W |
|---|---|---|---|
| 30 | 2.91% | 0.26% | 3.16% |
| 90 | 7.63% | 0.51% | 8.14% |
| 180 | 13.58% | 0.77% | 14.36% |
| 365 | 23.99% | 1.04% | 25.03% |
The warm set grows with T at every window, since a longer window captures more state. The populated read set stays a tiny fraction of the write set throughout.
Warmth over time
The following panels show the slots, accounts, and the combined set as a share of its live-state denominator:
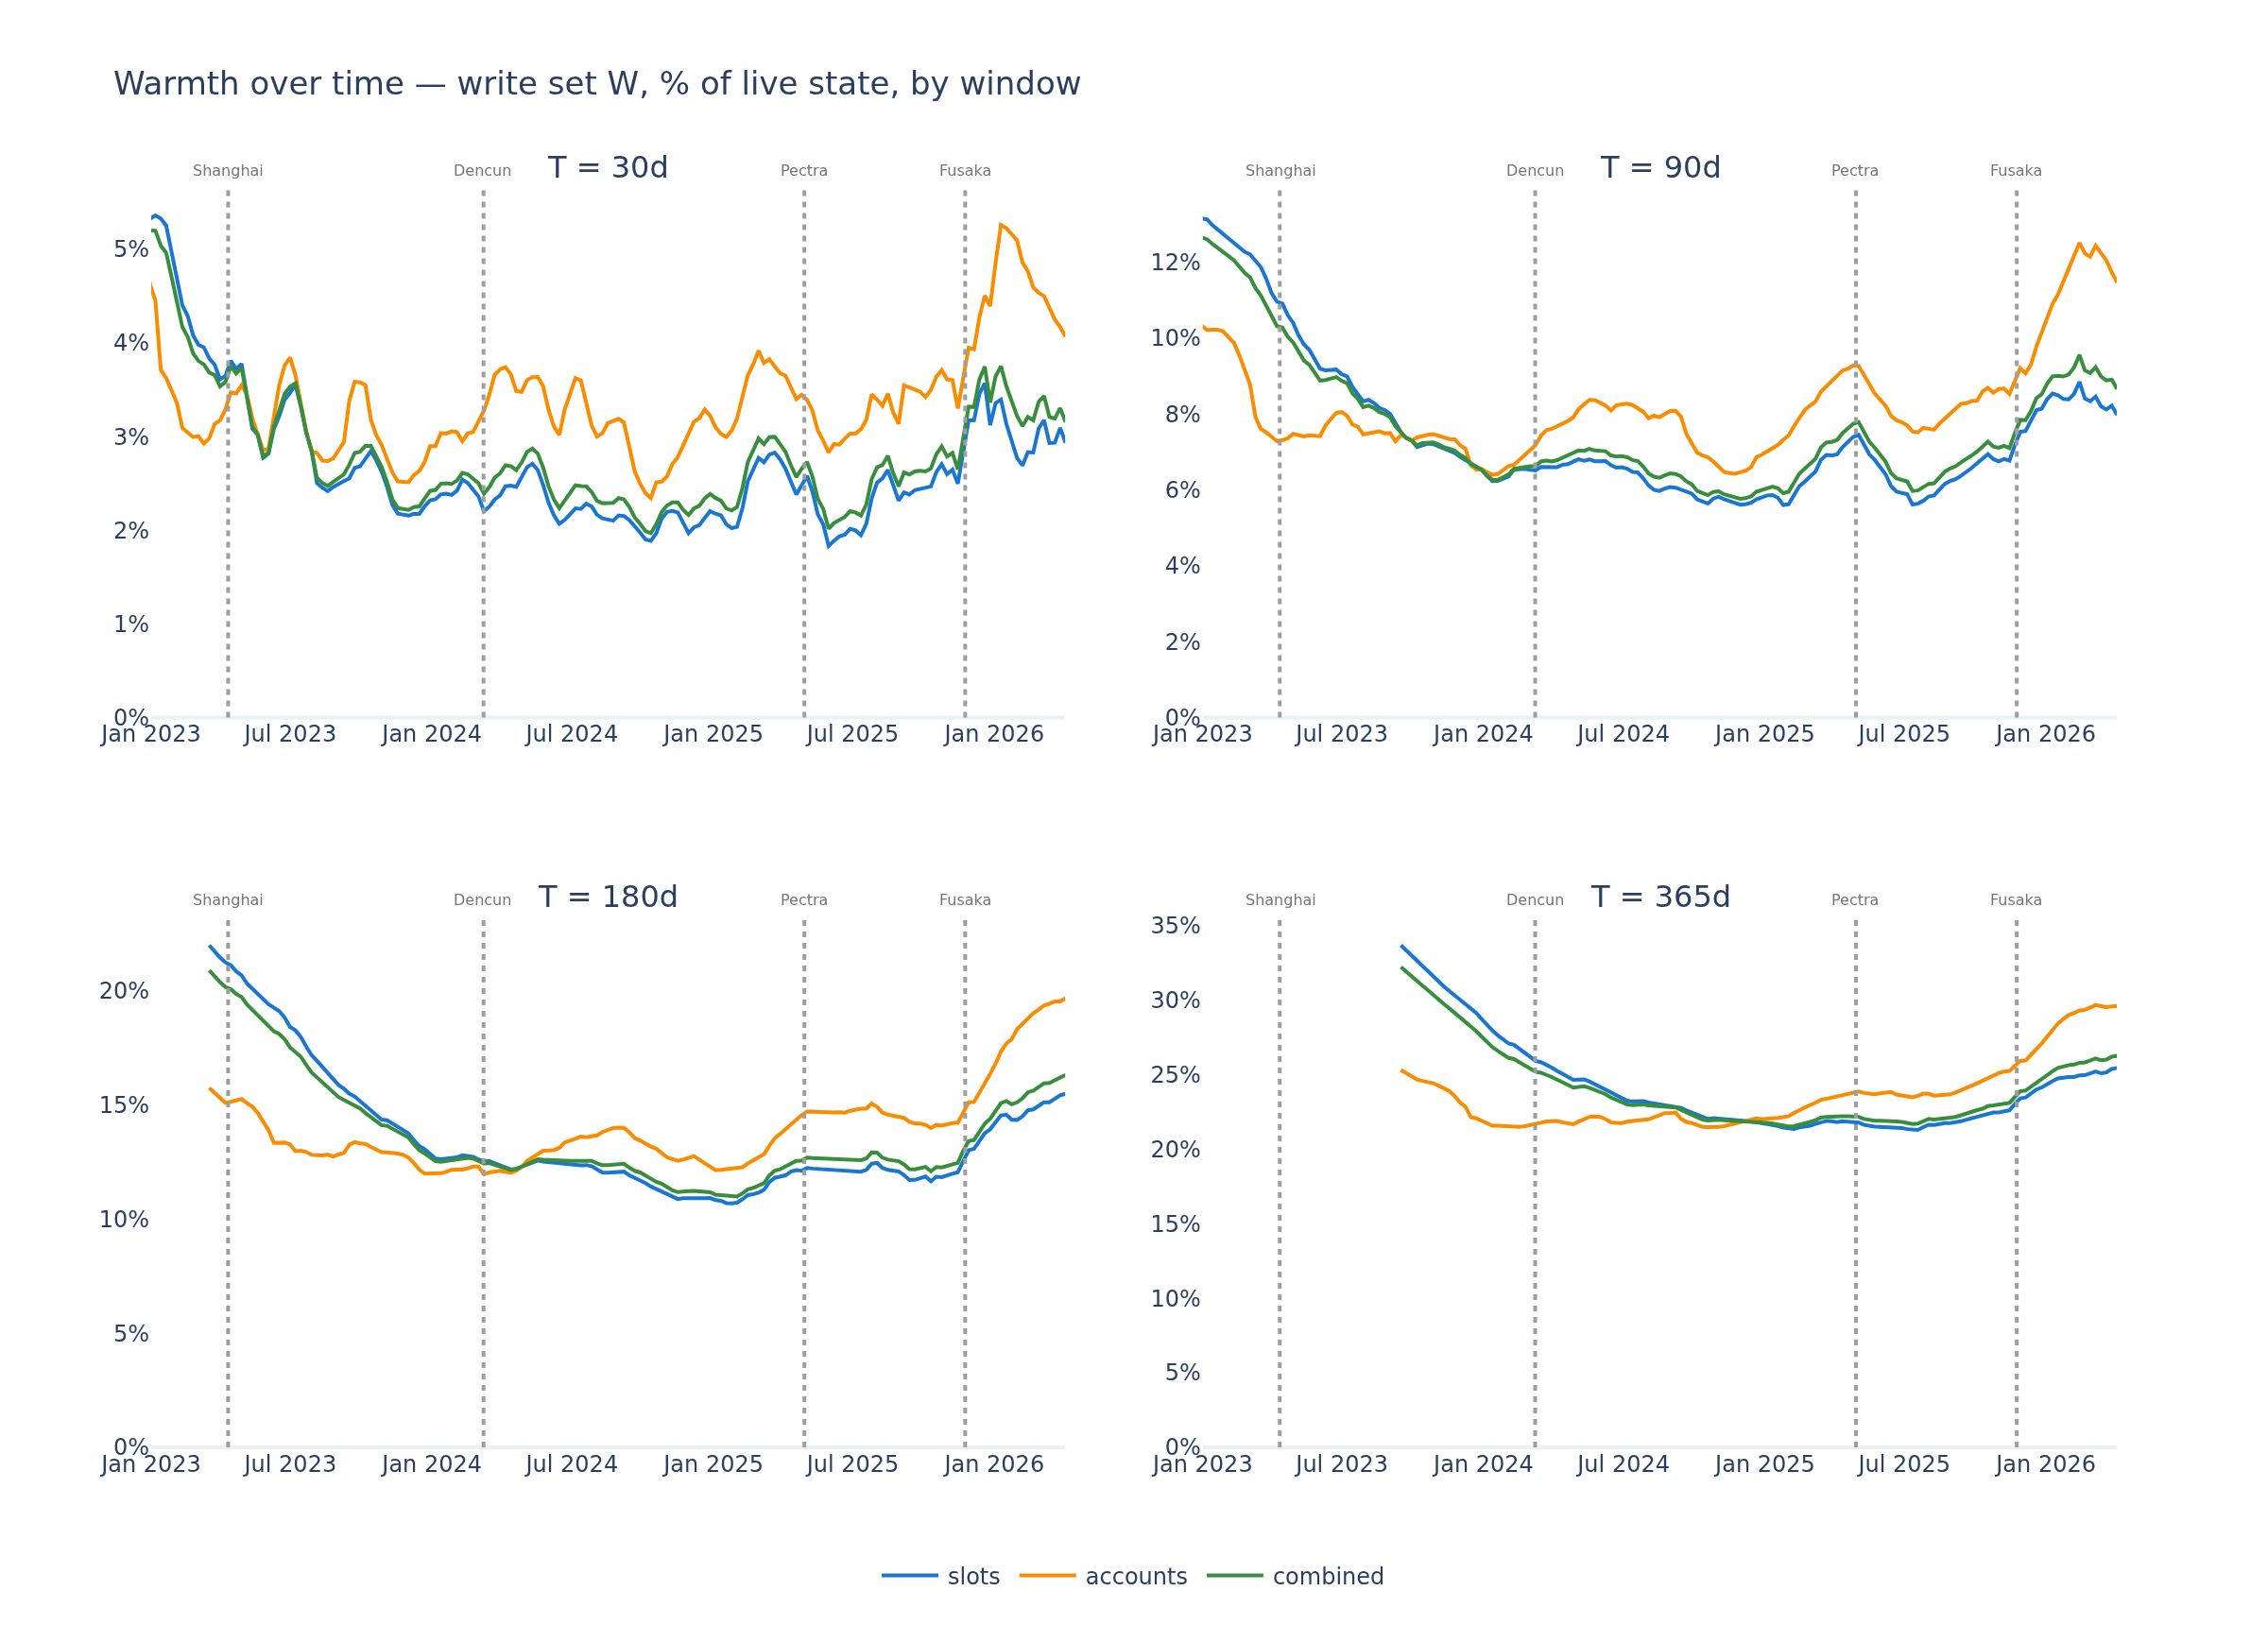
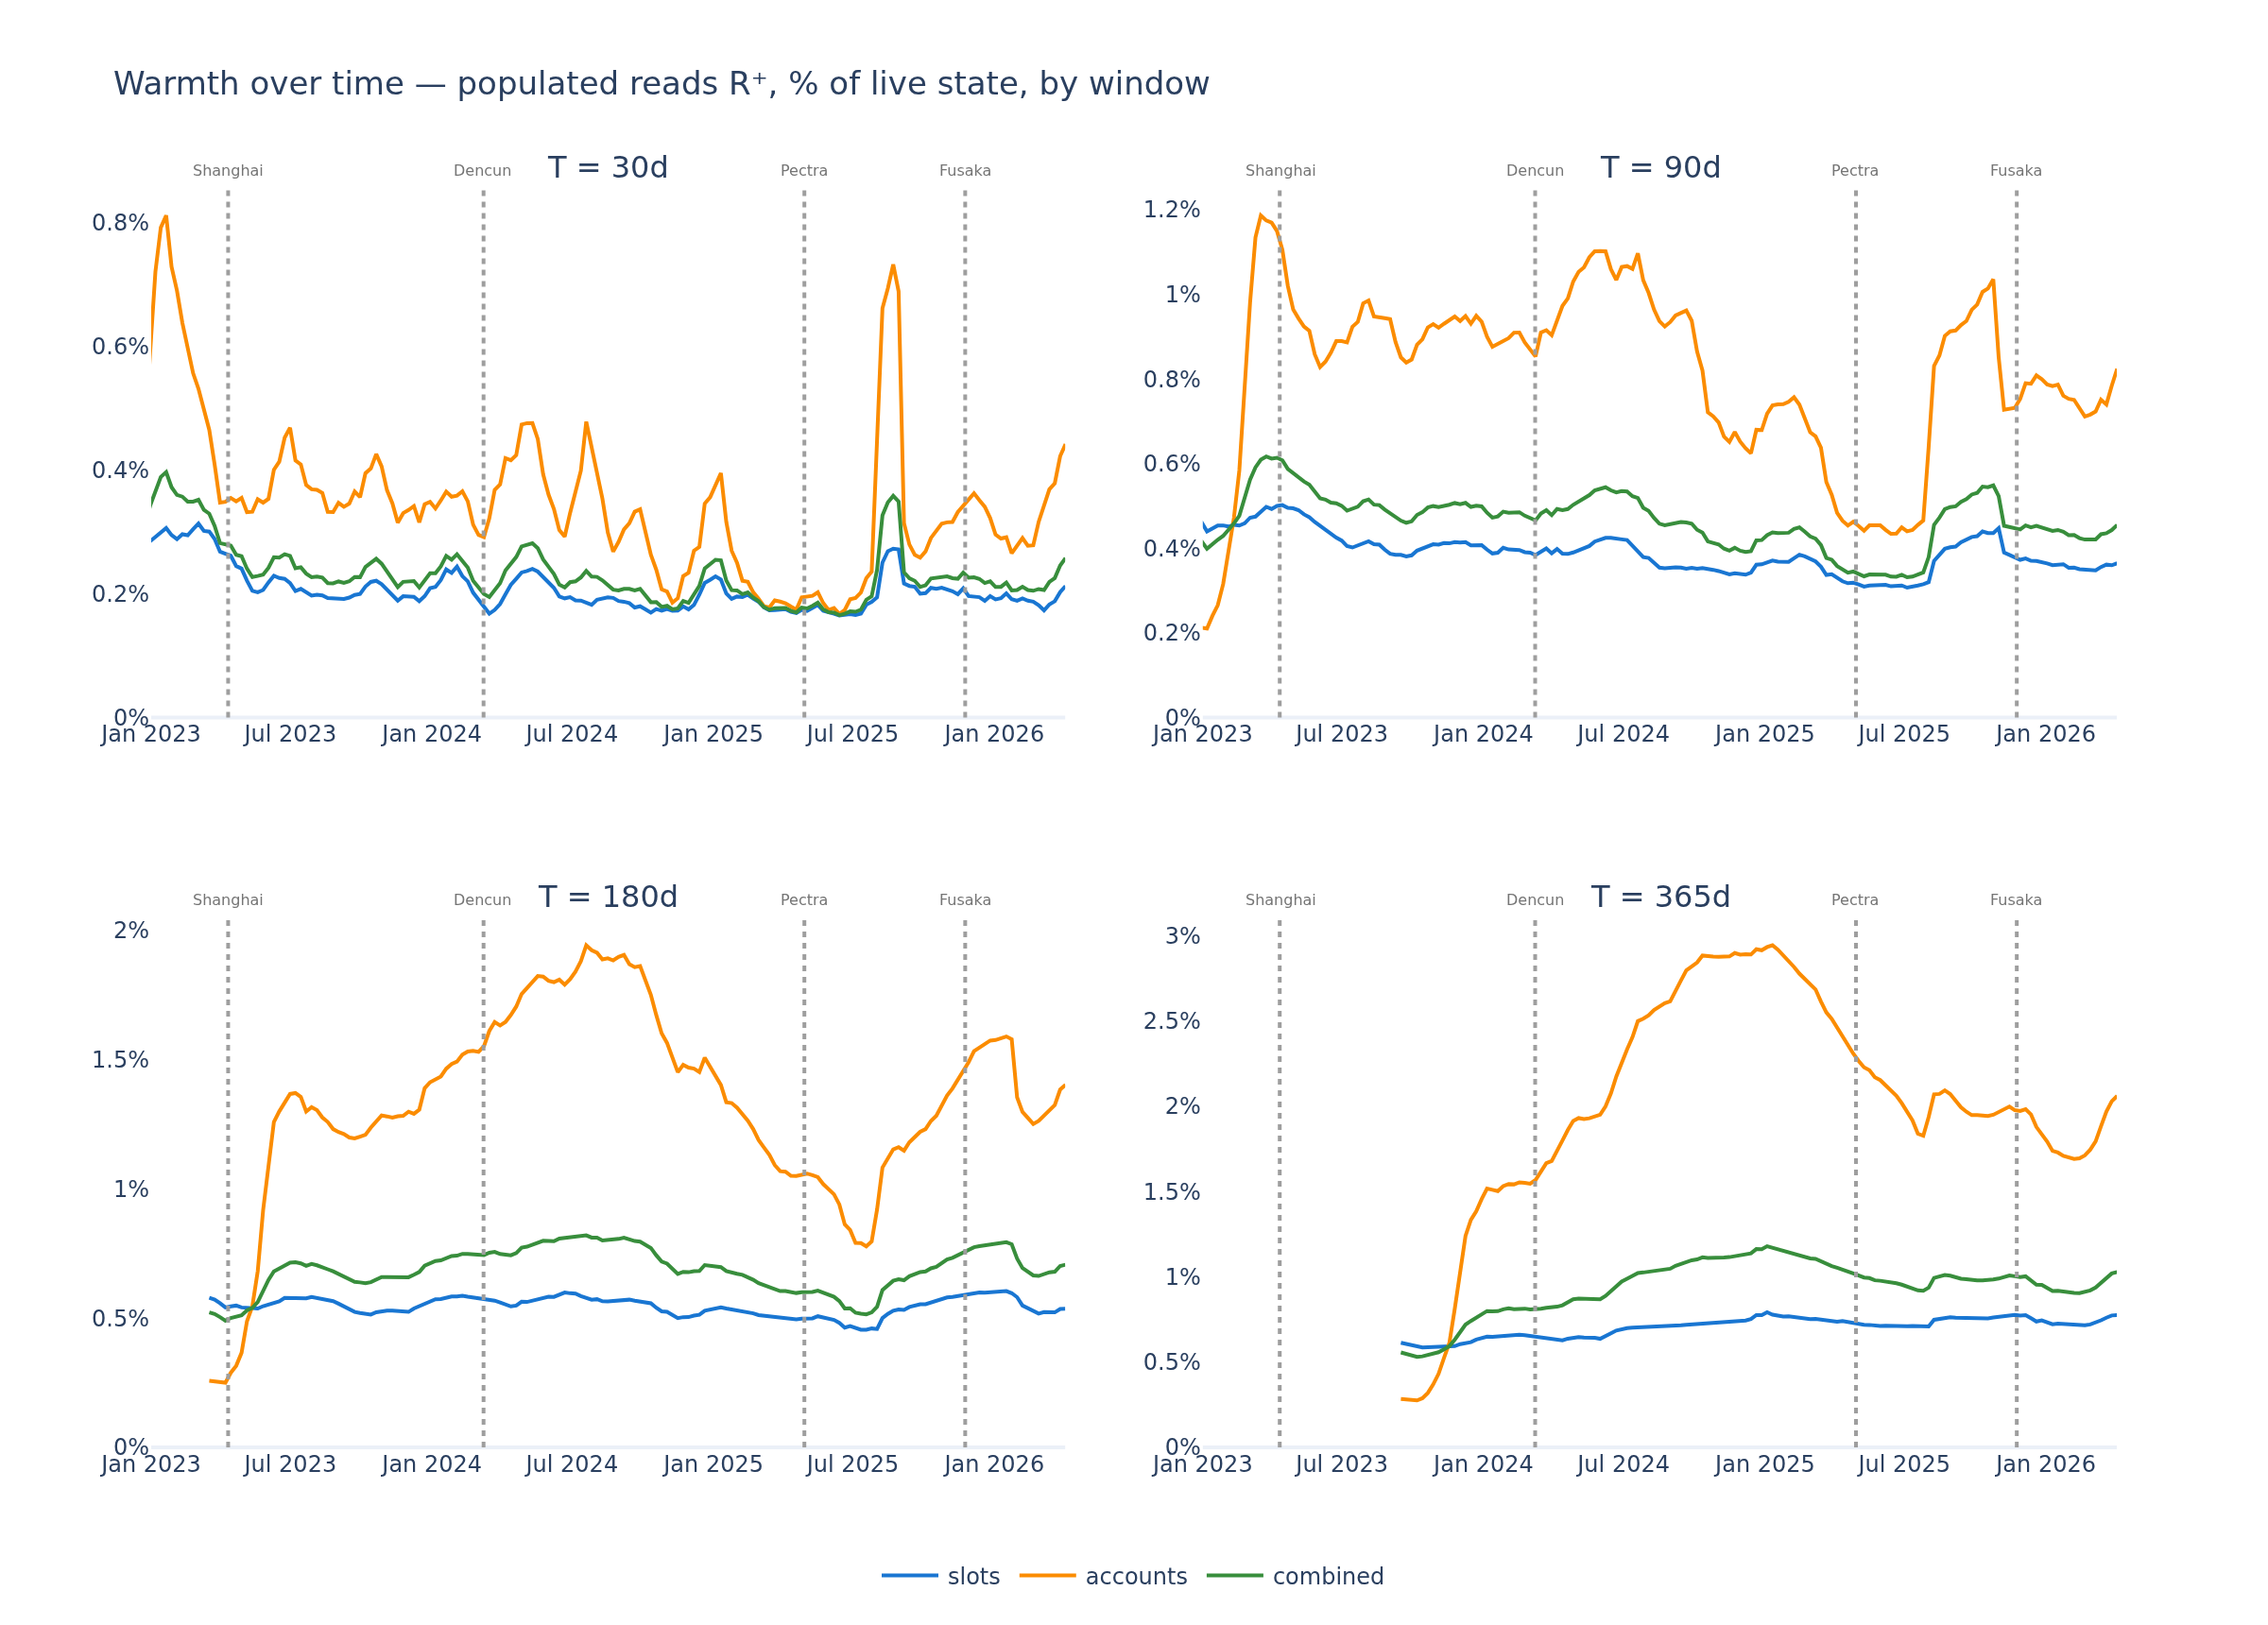
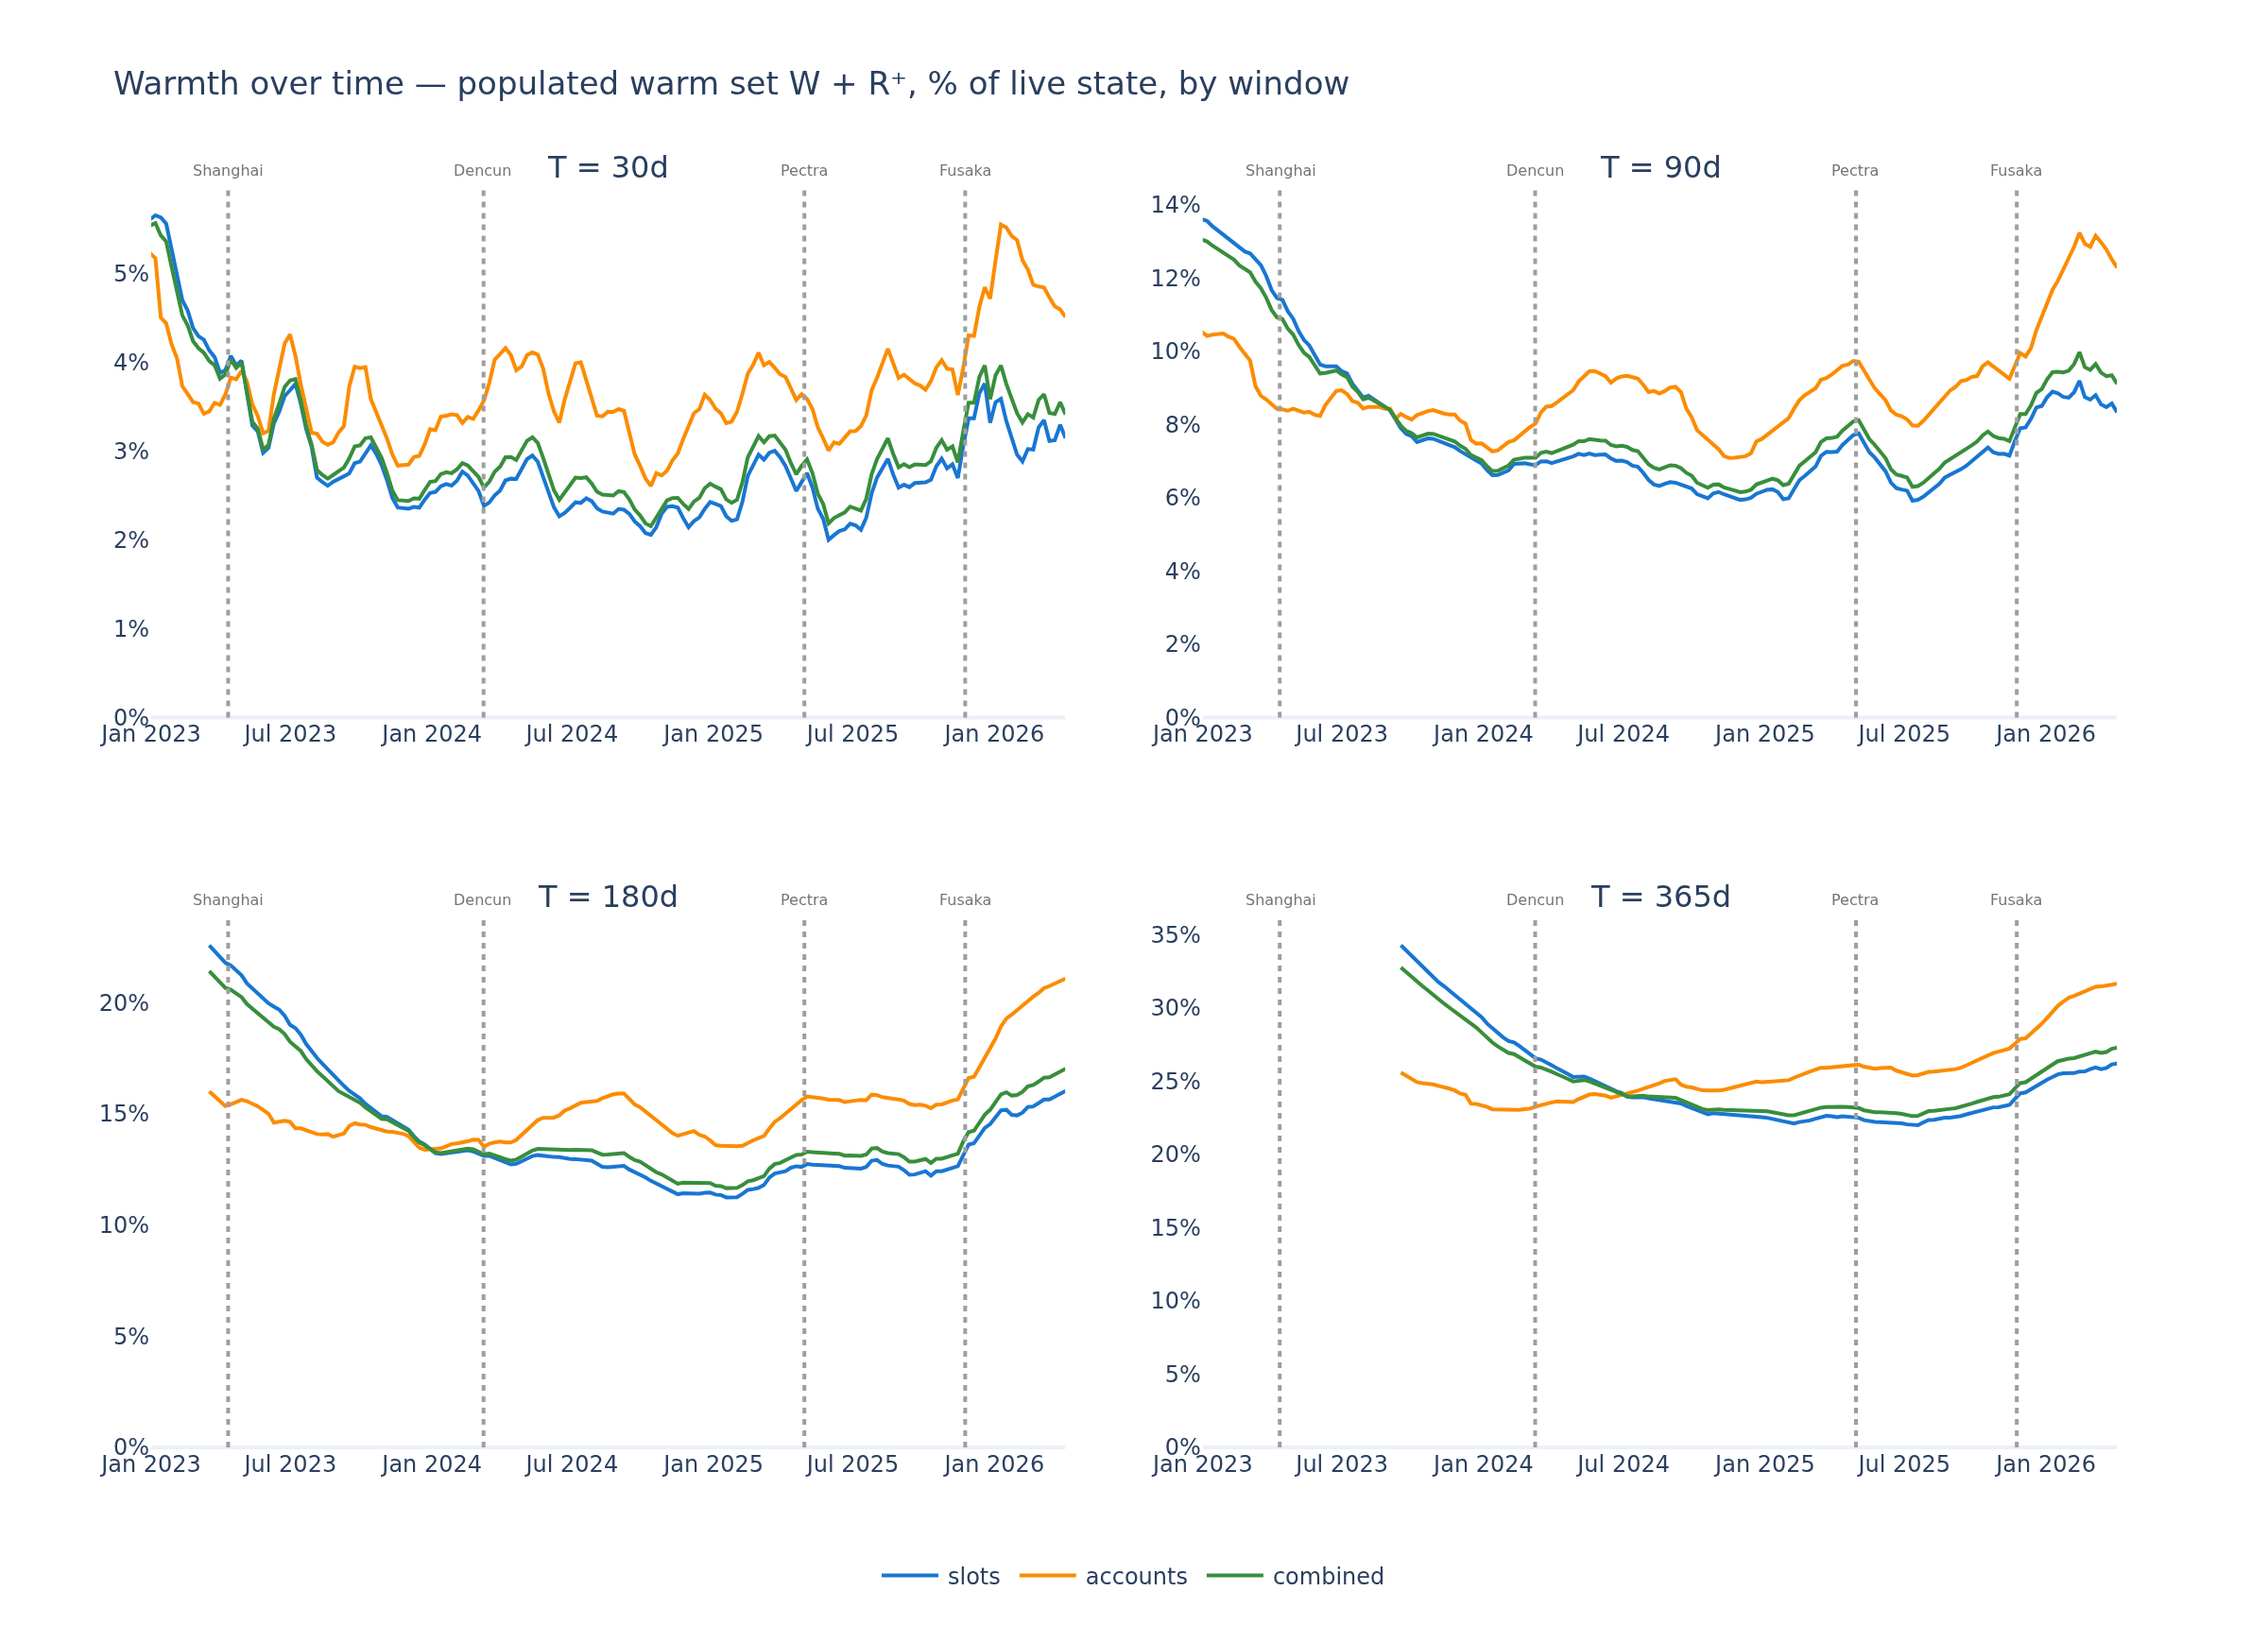
In the write-set chart, the slot share trends down across the post-Merge timeline (live state grows faster than the in-window write set) while the account share holds steadier. Both climb from late 2025. The populated-read set R⁺ is small at every window and grows gradually, more on the account side than the slot side.
5.2 Concentration
For each access set and window, the share of accesses captured by the top 1% of objects. Accesses are per-(tx, object) events (§3).
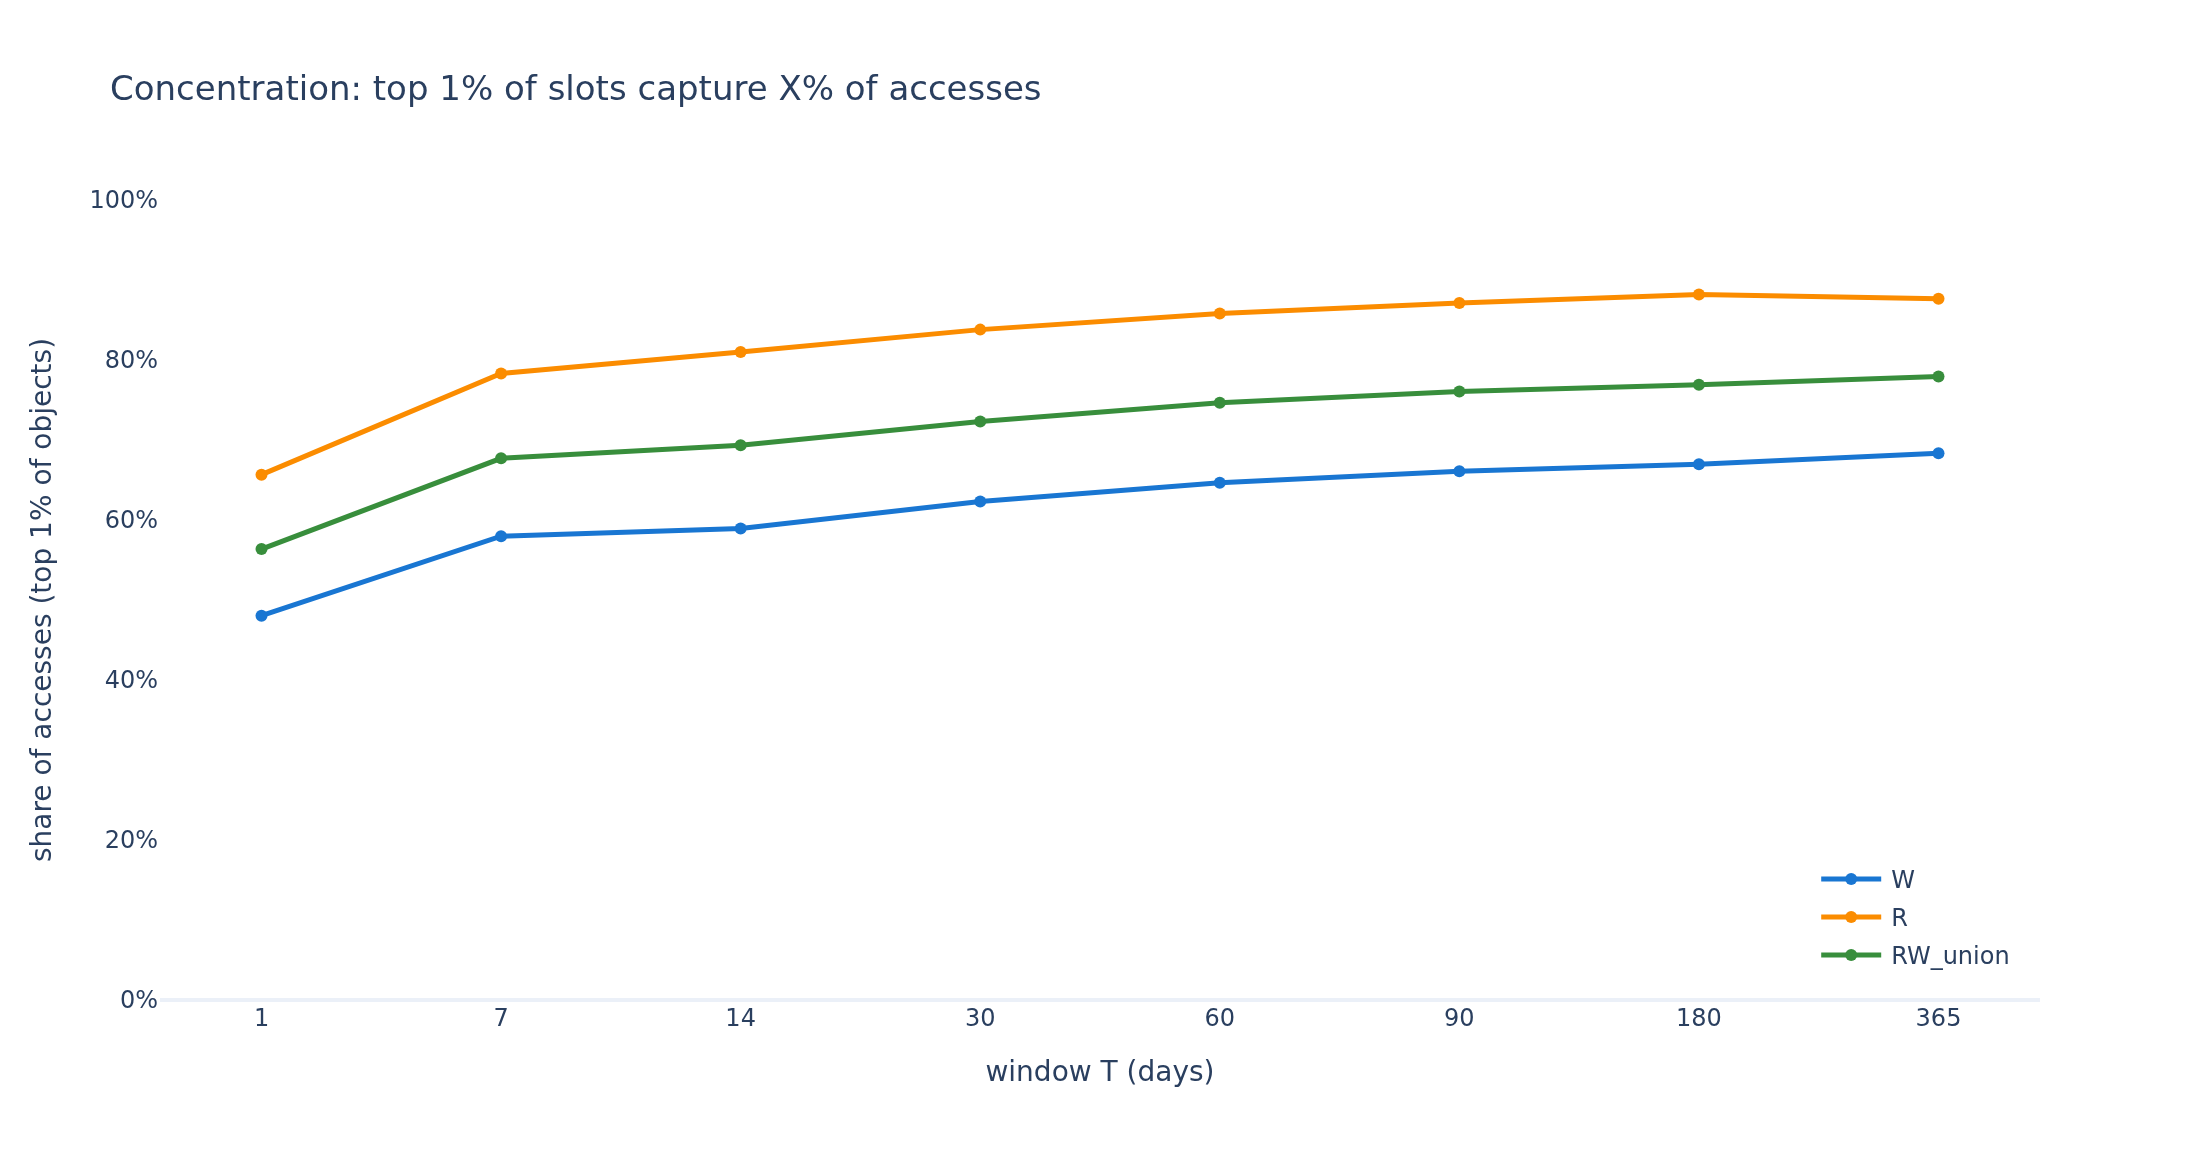
Slots, top-1% share of accesses:
| T (days) | W | R | R∪W |
|---|---|---|---|
| 1 | 48.0% | 65.7% | 56.4% |
| 30 | 62.3% | 83.8% | 72.3% |
| 90 | 66.1% | 87.1% | 76.1% |
| 365 | 68.2% | 87.7% | 77.9% |
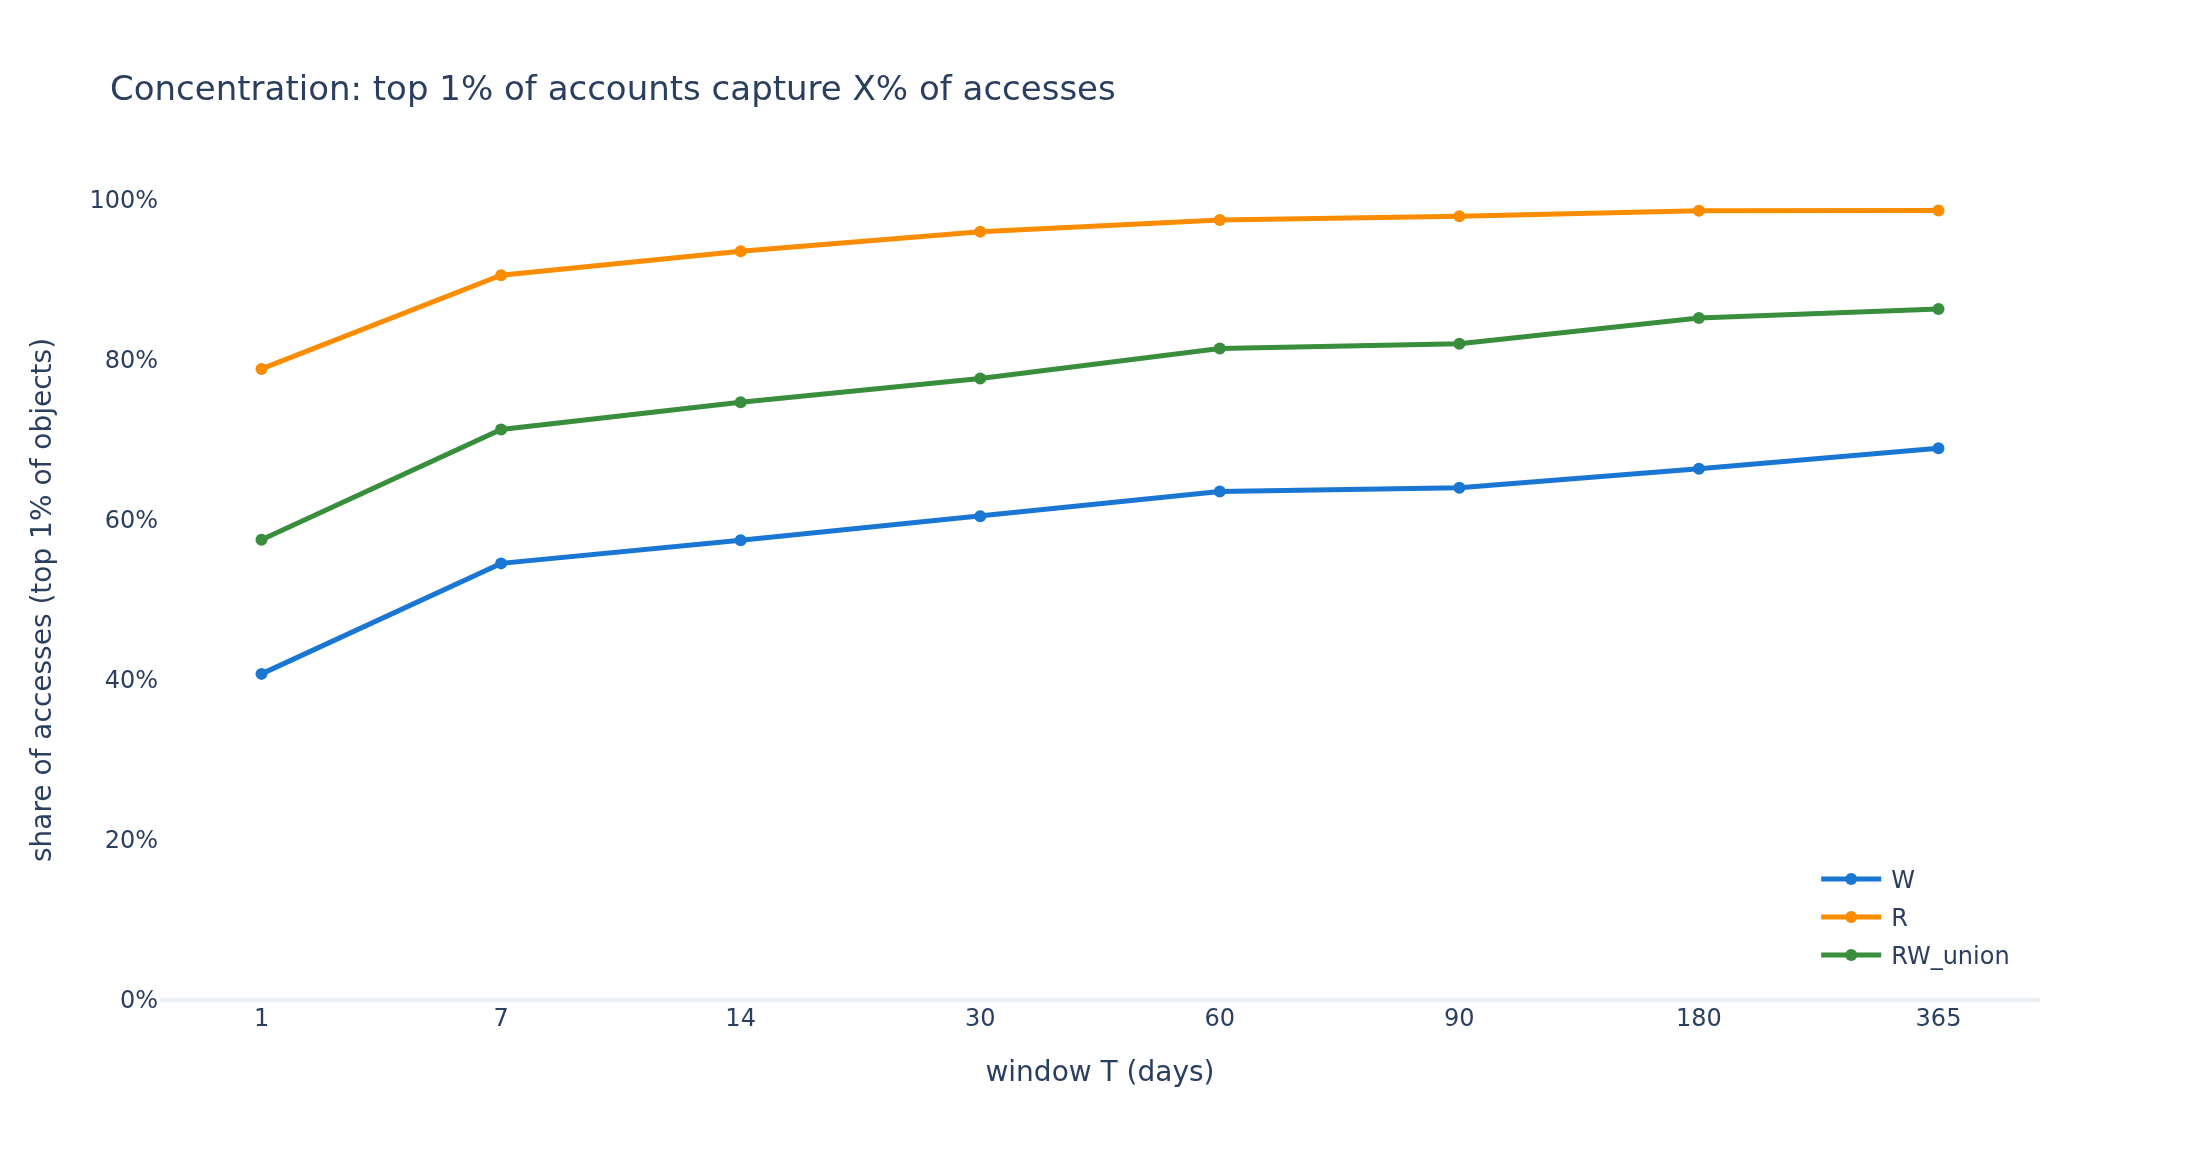
Accounts, top-1% share of accesses:
| T (days) | W | R | R∪W |
|---|---|---|---|
| 1 | 40.8% | 78.9% | 57.5% |
| 30 | 60.5% | 96.0% | 77.7% |
| 90 | 64.0% | 98.0% | 82.0% |
| 365 | 69.0% | 98.7% | 86.4% |
R is more concentrated than W everywhere. At T=365d the top 1% of R slots sees ~88% of slot read accesses, and the top 1% of R accounts ~98%. A handful of popular contracts absorb almost all the read operations.
Concentration grows with T. Wider windows pull in tail keys that get few accesses, so the head’s relative weight rises. The jump is sharpest from T=1d to T=30d (~18pp for slot R, ~17pp for account R) and flattens after.
Accounts concentrate far more tightly than slots. At T=30d the top 1% of R accounts captures 96% of accesses against 84% for slots. Account reads land on a tiny set of popular contracts, while slot reads spread across many contracts’ storage.
Concentration over time
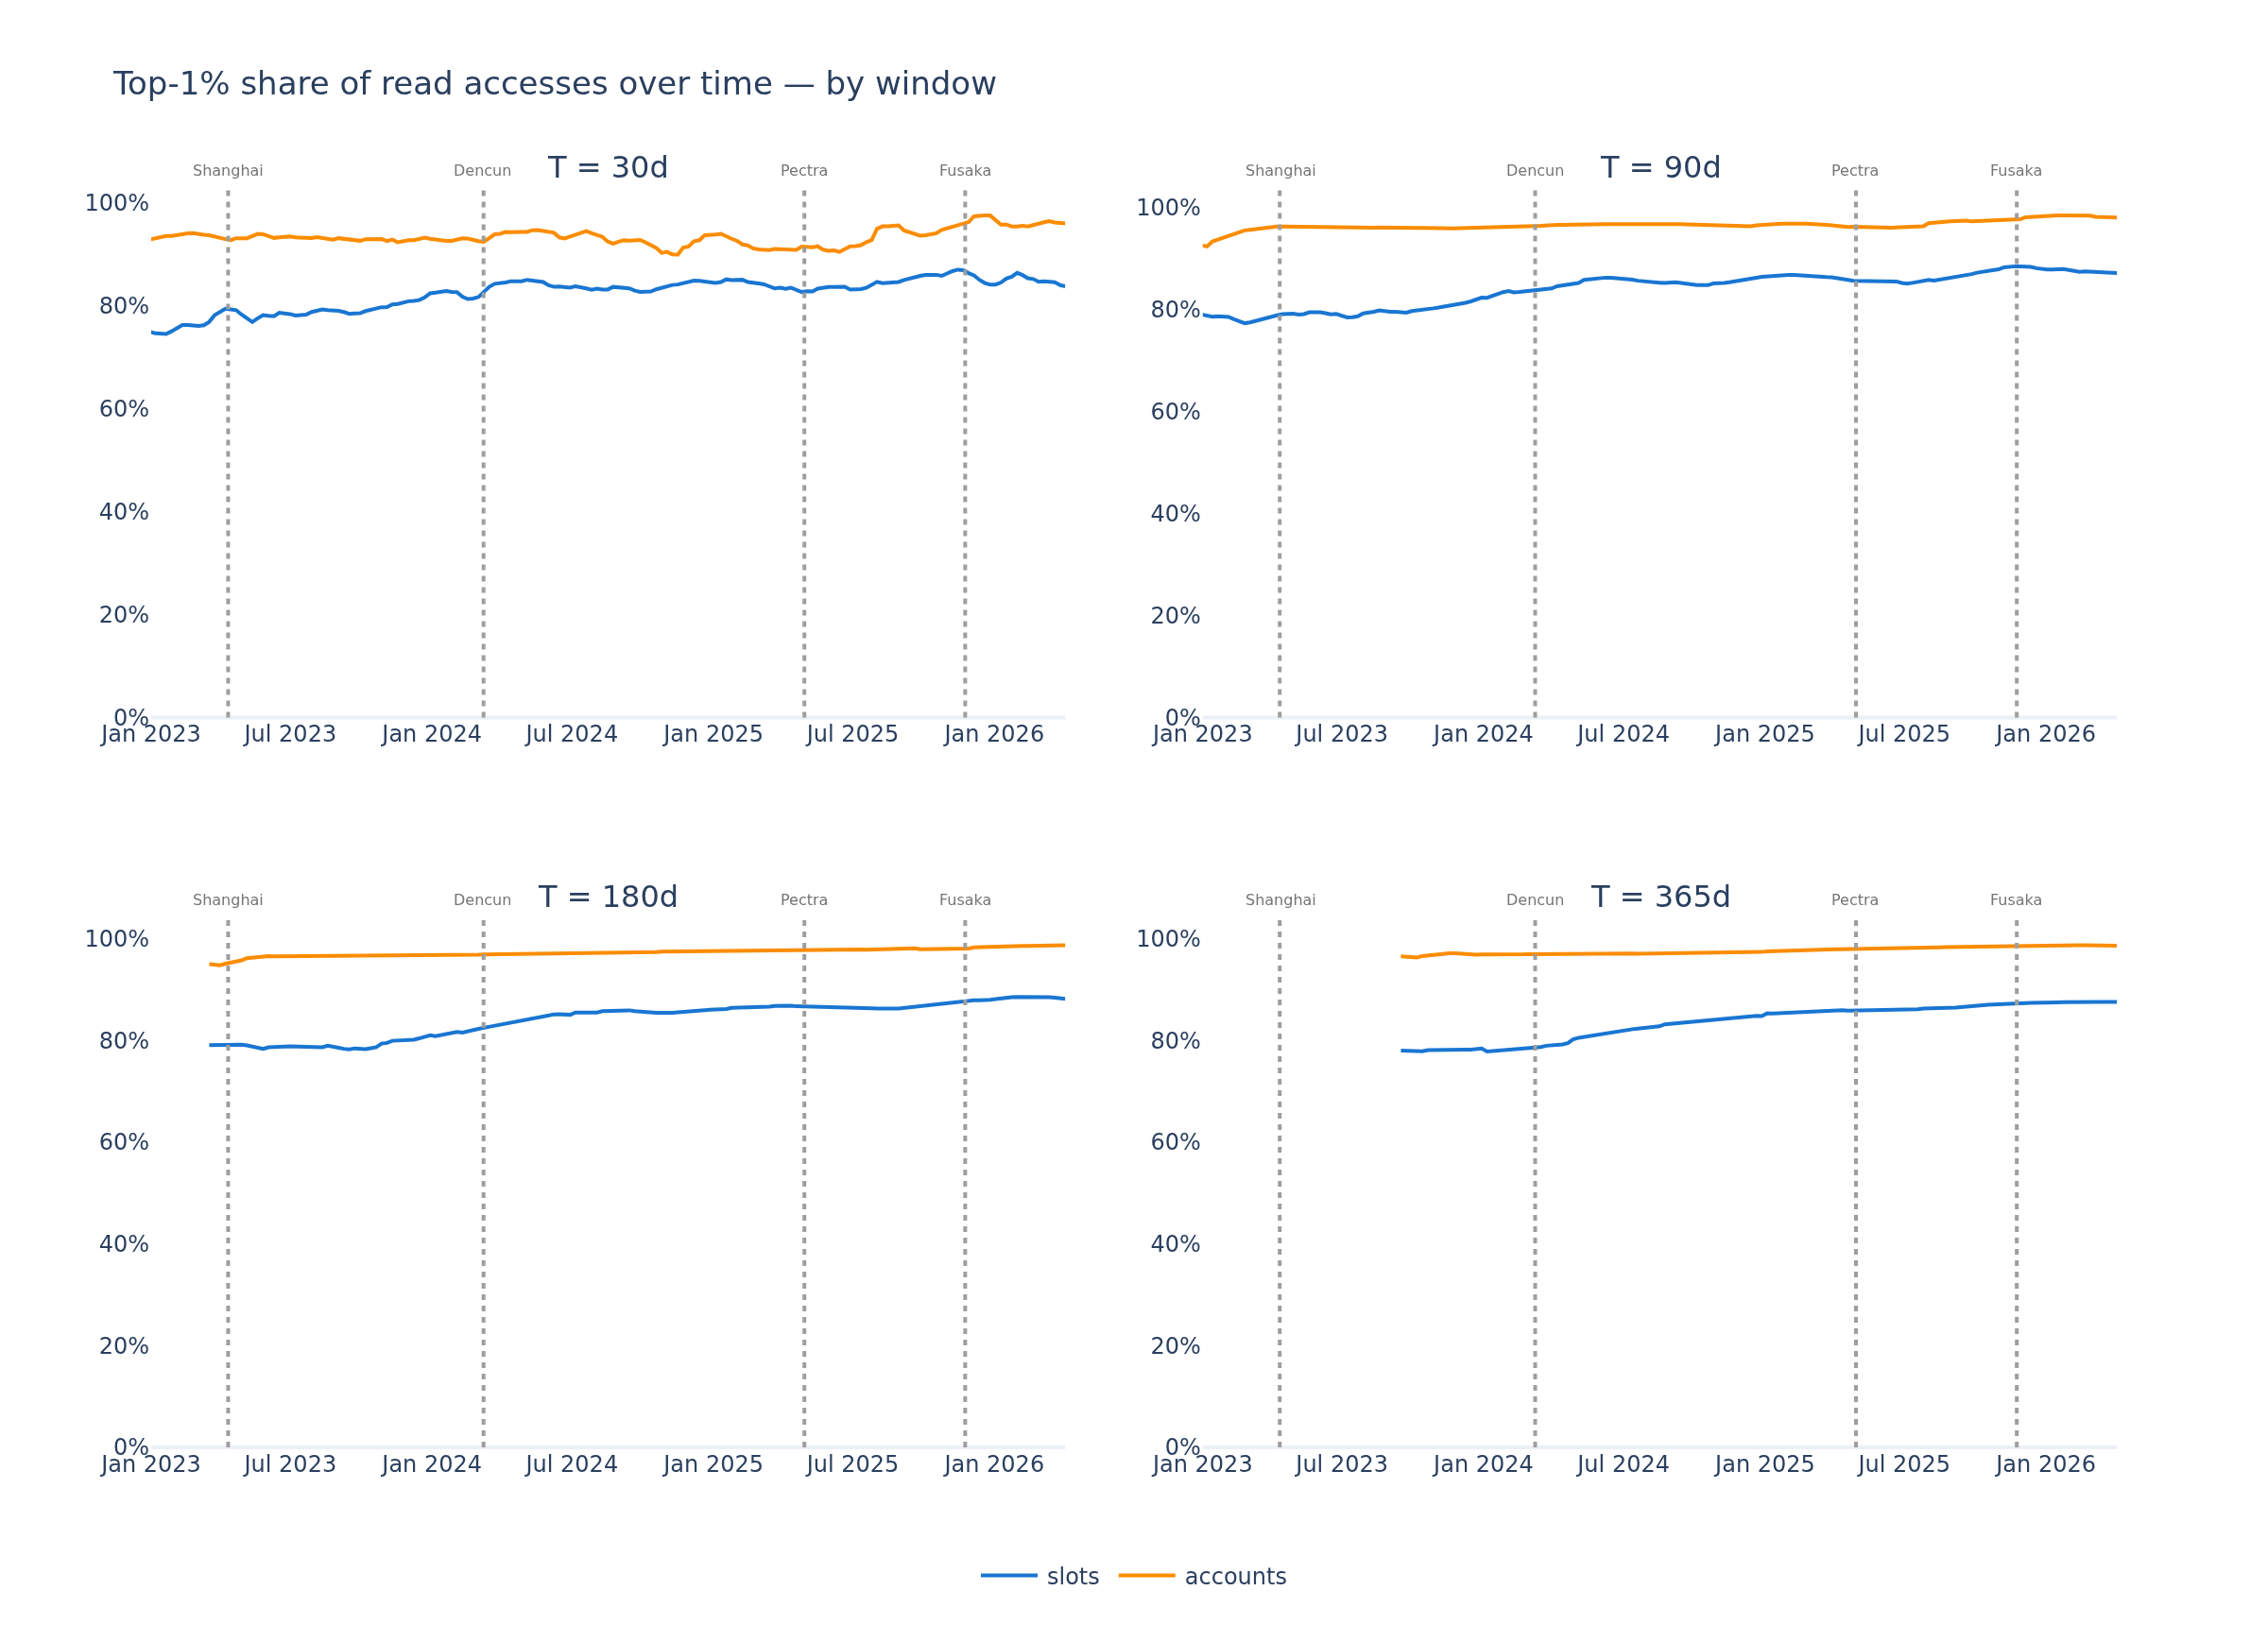
Account-read concentration is extreme and has been for the whole sample. The top 1% of R accounts holds 96–98% of read accesses at the latest anchor (block 24,870,000), and at the wider windows it was already there in 2022–2023 (T=90 ~93%, T=180 ~95%, T=365 ~97%). The one window that moved is the short 30-day one, climbing from ~87% to ~96% as read traffic consolidated onto a tiny set of heavily-called contracts. Slot concentration is lower and rose more gently (~78% to ~88% at T=365).
Who sits at the top
The ten most-accessed (RuW) accounts in the T=365d window (block 24,870,000), by access count over all sources:
| rank | account | accesses | what it is |
|---|---|---|---|
| 1 | 0x4838b106fce9647bdf1e7877bf73ce8b0bad5f97 |
1.19B | Titan Builder |
| 2 | 0xa0b86991c6218b36c1d19d4a2e9eb0ce3606eb48 |
729M | USDC |
| 3 | 0xdadb0d80178819f2319190d340ce9a924f783711 |
729M | BuilderNet |
| 4 | 0xdac17f958d2ee523a2206206994597c13d831ec7 |
615M | USDT |
| 5 | 0xc02aaa39b223fe8d0a0e5c4f27ead9083c756cc2 |
579M | WETH |
| 6 | 0x43506849d7c04f9138d1a2050bbf3a0c054402dd |
428M | unknown |
| 7 | 0x396343362be2a4da1ce0c1c210945346fb82aa49 |
241M | QuasarBuilder |
| 8 | 0x000000000004444c5dc75cb358380d2e3de08a90 |
217M | Uniswap V4 PoolManager |
| 9 | 0x609e0f0cb16e53878ba5e959a22fc7fcd81b124a |
209M | unknown |
| 10 | 0x95222290dd7278aa3ddd389cc1e1d165cc4bafe5 |
205M | beaverbuild |
The head splits in two. Block builders (Titan, BuilderNet, QuasarBuilder, beaverbuild) top the list because post-Merge every transaction credits the block’s fee recipient. This is due to the fact that builders are the fee recipient on every transaction in every block it builds. The contracts that are genuinely the heavily accessed accounts: stablecoins (USDC, USDT), WETH, and the Uniswap V4 singleton.
So the account concentration head is a mix: a few dominant builders pulled up by fee crediting, plus the handful of contracts that absorb most call traffic.
The ten contracts whose storage slots are accessed most in the same window:
| rank | contract | slot accesses | what it is |
|---|---|---|---|
| 1 | 0xdac17f958d2ee523a2206206994597c13d831ec7 |
1.31B | USDT |
| 2 | 0xa0b86991c6218b36c1d19d4a2e9eb0ce3606eb48 |
799M | USDC |
| 3 | 0xc02aaa39b223fe8d0a0e5c4f27ead9083c756cc2 |
332M | WETH |
| 4 | 0x06450dee7fd2fb8e39061434babcfc05599a6fb8 |
317M | XEN |
| 5 | 0x000000000004444c5dc75cb358380d2e3de08a90 |
133M | Uniswap V4 PoolManager |
| 6 | 0xc7bbec68d12a0d1830360f8ec58fa599ba1b0e9b |
54M | Uniswap V3 USDC/USDT pool |
| 7 | 0x2b591e99afe9f32eaa6214f7b7629768c40eeb39 |
52M | HEX |
| 8 | 0xbbbbbbbbbb9cc5e90e3b3af64bdaf62c37eeffcb |
51M | Morpho |
| 9 | 0x87870bca3f3fd6335c3f4ce8392d69350b4fa4e2 |
45M | Aave V3 Pool |
| 10 | 0xe0554a476a092703abdb3ef35c80e0d76d32939f |
44M | Uniswap V3 USDC/ETH pool |
Token balance and allowance mappings (USDT, USDC, WETH), DEX (the Uniswap V4 singleton and two busy Uniswap V3 pools), lending (Aave V3, Morpho), and the high-churn mint/stake tokens (XEN, HEX). These are the contracts whose storage gets read and written far more than any other.
6. EIP-8295: a state-tiering counterfactual
The previous sections describe how state accesses and creations look over the course of Ethereum’s history. This section explores the effectiveness of a state-tiering scheme.
EIP-8188 adds a last_written_block field to every account and storage slot, consensus-level metadata recording when each piece of state was last mutated. It changes no gas costs by itself. EIP-8295 is the tiering scheme built on that metadata. It would price recently-written state cheaply (Active) and long-dormant state higher (Inactive), treating its activeness threshold as a rolling T-day window. The sections below model that layer as a counterfactual. “Active” and “Inactive” below refer to it.
6.1 Warm-update coverage
Definition
For each window, classify every update event as warm or cold:
- warm: the object was already created or updated earlier in the same window.
- cold: the update is the object’s first warming event in the window. Deletions do not count as warming.
So an object’s first in-window create-or-update may be cold, and every later update on it is warm.
Coverage
Each value is the mean % of update events warm over the weekly post-Merge sweep.
| T (days) | slot % warm | account % warm |
|---|---|---|
| 1 | 85.2% | 92.0% |
| 7 | 91.2% | 95.1% |
| 30 | 94.1% | 97.0% |
| 90 | 95.7% | 98.0% |
| 180 | 96.7% | 98.6% |
| 365 | 97.7% | 99.0% |

The Active tier covers update gas well. ~94% of slot update SSTOREs at T=30d keep the cheap Active price, ~96% at T=90d, so the Inactive premium hits only ~3–6% of slot updates. Even a 1-day window already covers 85% of slot update gas and 92% of account update gas.
Slots are more window-sensitive than accounts at the low end. Cutting the window from 30d to 1d drops slot coverage from 94% to 85%, but account coverage only from 97% to 92%. Account state (hot contracts) is re-written many times during short windows, so almost every account update already has a same-day prior write.
The benefit saturates fast. Slot coverage climbs from ~94% at T=30d to ~98% at T=365d, only +4pp for a 12× window, and accounts are flatter still (~97% to ~99%). Stretching past ~30d does little for update gas.
A ~30-day window is the sweet spot. Going from T=30d to T=365d buys only +3.6pp of slot coverage (94.1% to 97.7%), but the Active set it has to keep warm grows from 2.8% to 24.2% of live slots (§5.1), roughly 9× more state in the cheap tier for almost no extra gas covered. A threshold around 30 days captures nearly all the warm-update gas while keeping the Active set small, which is what a tiering scheme wants.
6.2 Read-side period bump
Under a hypothetical extension where the first read of an inactive object also bumps its period, making reads write-like for users, which objects pay that cost?
The bad-UX set is objects whose first in-window event is a nonzero read. For example, a slot whose first event is an SLOAD returning a populated value, or an account whose first event is a balance or nonce read returning nonzero. A write or a zero read as the first event costs nothing because writes already refresh the metadata, and zero reads do not populate the metadata.
EIP-8188 updates the write-age on writes only, never on reads. A scheme that bumped the period on a read would cost as much as a write, so we want to see how much impact it incurs.
Slots: first-operation classification
The share of slots in R∪W by what their first event is:
| T (days) | first = write | first = zero read | first = nonzero read |
|---|---|---|---|
| 30 | 67.90% | 26.32% | 5.77% |
| 90 | 69.34% | 26.57% | 4.09% |
| 180 | 69.86% | 26.93% | 3.21% |
| 365 | 70.28% | 27.37% | 2.35% |
At T=30d, 5.8% of slots in R∪W would be hit by the read-side bump, their first event a populated SLOAD. This falls to 2.4% at T=365d, because a wider window is more likely to contain an earlier write.
Accounts: first-operation classification
The share of accounts in R∪W by what their first event is:
| T (days) | first = write | first = zero read | first = nonzero read |
|---|---|---|---|
| 30 | 89.65% | 0.91% | 9.44% |
| 90 | 89.67% | 1.04% | 9.29% |
| 180 | 89.96% | 1.14% | 8.89% |
| 365 | 90.91% | 1.19% | 7.90% |
The bad-UX set is ~9% of warm accounts at T=30d, easing to ~8% at T=365d. The zero-read band stays small throughout (~1%).
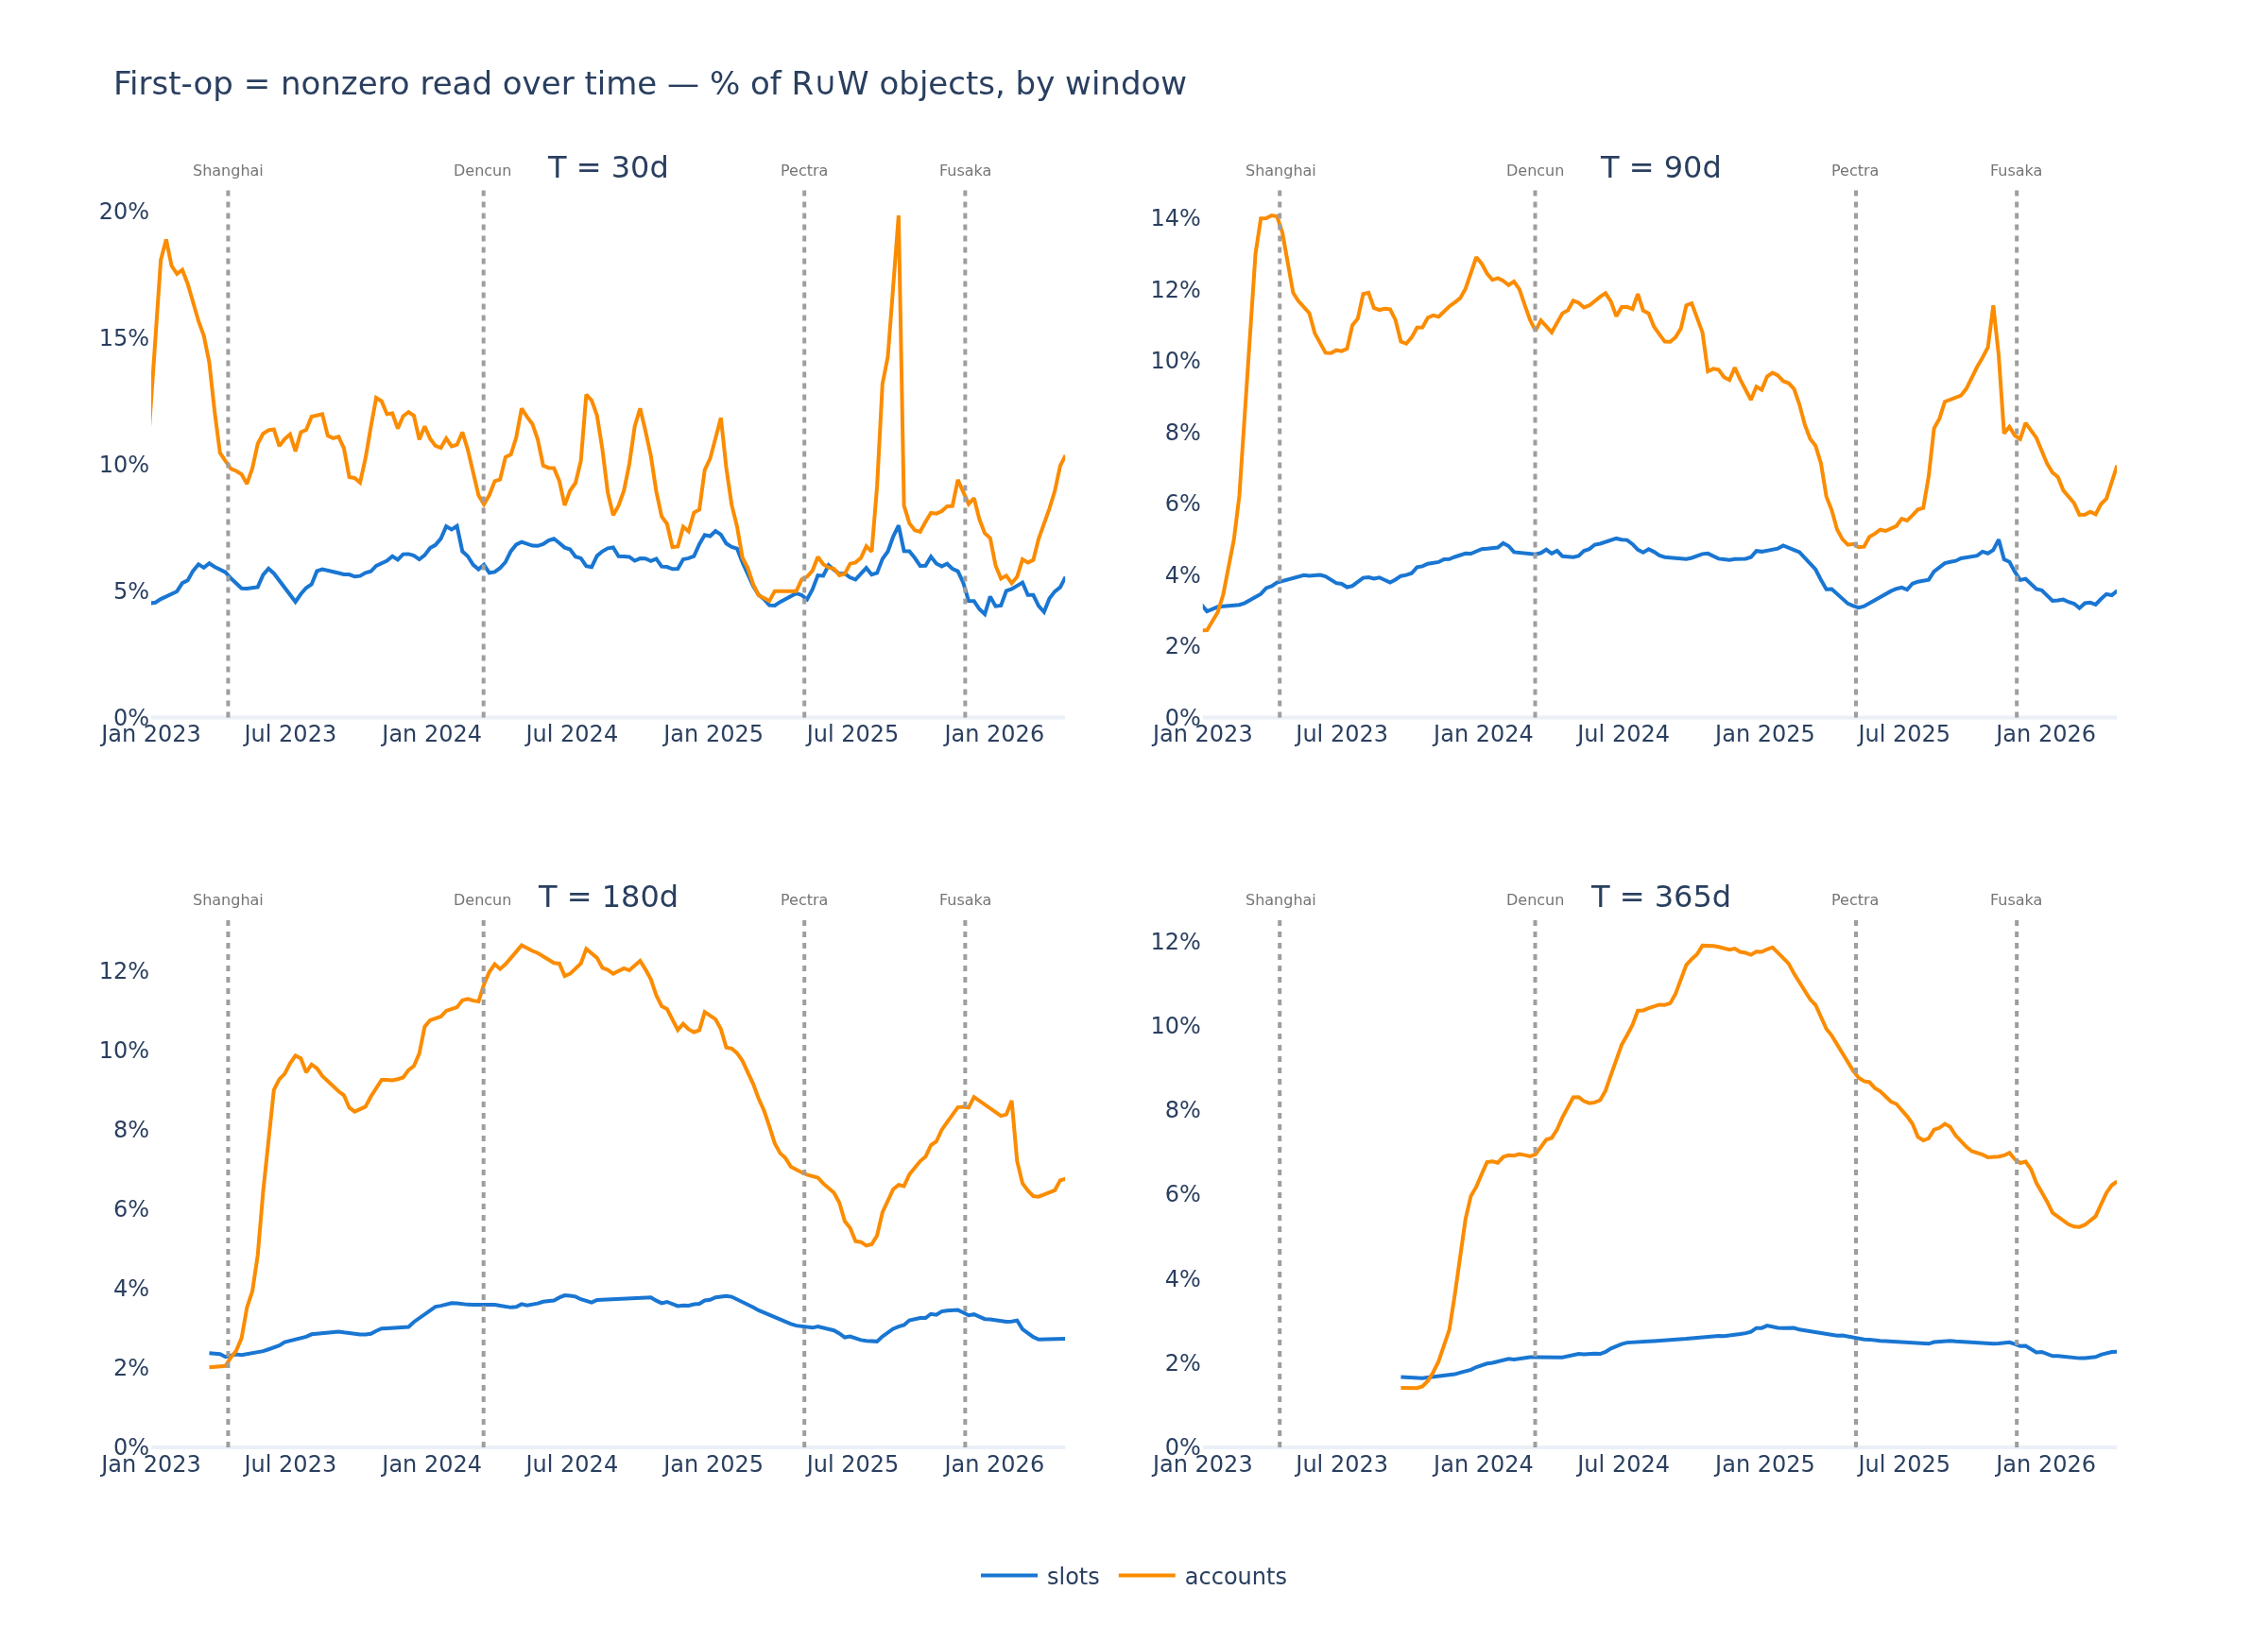
Over the timeline the bad-UX set stays a minority, rising gently as the read-only set fills with populated accounts, with short-window excursions toward ~20% in early 2023 and 2025.
Conclusion
Ethereum’s state grows far faster than it churns. Most writes creates new state that is then never touched, and the share of state active in any fixed window keeps falling as the chain ages. The result is then a large proportion of dormant state that every stateful node carries forever, while real activity stays concentrated on a small hot set led by a handful of applications.
This is exactly the shape that makes separating active from dormant state worthwhile. A write-age tier built puts almost all the gas-relevant write activity in a small Active set, a 30-day window already covers ~94% of update gas while keeping only ~3% of state warm, and marks the rest Inactive. Because the dormant tail grows with the chain, the value of treating it differently compounds over time.
Tiering is one expression of that idea. The same structure underpins state expiry, partial statelessness, and any design that stops treating all state as equally live. The active set is small and bounded, so Ethereum should scale its state sustainably based on this asymmetry.