Antero Eloranta - October 6th, 2025
This research has received funding from ETHGas. Many thanks to Kevin Lepsoe and the ETHGas team for their valuable feedback and comments. Any opinions in this post are my own.
1. Intro
Today, on-chain trading on Ethereum happens via Automated Market Makers (AMMs) and solver networks, with Uniswap being the biggest AMM protocol and CoWSwap being the biggest solver network. On AMMs, the market making happens by Liquidity Providers (LPs) selecting which pools to passively provide liquidity in, while in solver networks, solvers actively compete against each other to find the best combination of AMM pools, combined with their personal liquidity, to settle trades. This is fundamentally different from the Limit Order Book (LOB) mechanism used in traditional finance exchanges for trading, where market makers actively adjust their bid and ask orders based on market conditions. The more passive approach for AMM liquidity provisioning results in the LPs being more prone to adverse selection in the form of toxic volume compared to LOBs.
The AMMs’ volume can be split into volumes from toxic and noise trading. Toxic volume arises due to price discrepancies, that is, when the price of a token moves enough in a centralized exchange between two blocks to cause there to be an arbitrage opportunity between the prices in a centralized exchange and an AMM for an arbitrageur to take advantage of. Noise trading volume, on the other hand, happens when people want to trade between assets without profiting from cross-venue price discrepancies.
When choosing at which fee level to provide liquidity, LPs face a tradeoff. Higher fees protect the LP against arbitrageurs and increase per-trade revenue. On the other hand, higher fees reduce the volume AMM pool receives, leading to lower overall revenue from fees as well as an increase in the stickiness of the price. In addition to the fee charged by the AMM, the LPs can also be protected against arbitrageurs by decreasing the block time. This results in a lower probability of the price difference between a centralized exchange and an AMM exceeding the pool fee between two blocks over an individual block. This results in a decrease in the amount of assets passive AMM LPs lose to adverse selection, as a greater part of the toxic volume is returned to the LPs in the form of fee revenue over a long period of time.
There are broadly two types of discussions to address the latency or block times on Ethereum:
-
In Protocol: The Lean Ethereum initiative, spearheaded by Justin Drake, where block times can potentially be reduced down to 4 or 2 secs. This initiative is envisioned, or hoped to materialize over the next 10 years; and,
-
Out of Protocol: Where users can acquire and trade realtime preconfirmations for example, on ETHGas. This is available today with an initial set of validators embracing the faster user experience.
This study examines the impact that reducing block times from 12 seconds to smaller intervals may have for DEXes, AMM liquidity providers as well as traders. The study furthermore assumes that blockspace is largely unlimited - that is, if block times were decreased and the volume of transactions increased, then the blockspace would fill almost instantly. While the Lean Ethereum initiative is expected to increase blockspace, the Based Rollup roadmap is assumed to be executed upon but this discussion is largely outside the scope of this article.
The findings demonstrate that shorter block times would benefit the AMMs by reducing the need for arbitrage protection, thereby allowing pools to offer lower fees while maintaining liquidity provider protection. This creates a virtuous cycle: lower fees attract more trading volume, improve price competitiveness with centralized exchanges, reduce transaction failure rates, and decrease price staleness. AMM pools fall into two categories: ones with high toxic volume that should optimize fees for arbitrage protection and others that should focus on maximizing overall volume through competitive pricing.
2. Market making
Market making in traditional finance and Limit Order Books (LOBs) have been studied extensively. It is usually considered an optimal control problem where market makers attempt to determine optimal bid and ask quotes for a market. Market makers attempt to find bid and ask quotes that have an optimal balance between generating profit and inventory risk management by determining the quotes based on various variables. These variables can, for example, include volatility, order flow imbalance, cumulative volume delta, trading volume, and correlation with other assets.
Volatility is an important part of most market-making models as it is used as a proxy for determining the risk for adverse selection in a market. As the volatility of a market increases, so does the probability of information asymmetry between market makers and informed traders. To account for this, market makers tend to increase the spread between their bid and ask quotes during periods of high volatility to compensate for the increased risk of adverse selection and decrease the spread during periods of low volatility to maintain competitiveness. Besides volatility, other variables are usually used for fine-tuning the models. Order flow imbalance provides insights into the amount of buy and sell quotes at different price levels, which the market makers can use to determine the fair value for an asset. Cumulative volume delta and trading volume can impact the risk faced by market makers. Correlation with other assets can be used to better understand and hedge the market maker’s overall risk exposure.
As an example of a market-making model, the Avellaneda-Stoikov model is one of the most widely referred models. The model determines optimal bid and ask quotes based on volatility, market maker’s inventory and risk aversion, and the frequency of orders in the market. The model starts by determining an indifference price r for a market based on volatility, inventory, and risk aversion of the market maker, where s is the current price, σ is volatility, q is current inventory, γ is risk aversion, and κ is the frequency of orders.
r = s - q\gamma\sigma^2
The Indifference price represents the price at which the market maker is indifferent to either buying or selling the market. If the market maker does not hold inventory, the indifferent price is the same as the current price. After determining the indifference price, the model determines the optimal spread.
\delta = \delta_a + \delta_b = \gamma\sigma^2 q + 2\gamma\ln(1 + \gamma\kappa)
The \delta represents how far apart the market maker should set their bid and ask quotes, and \delta_a and \delta_b represent how far from the indifference price the optimal bid and ask quotes should be. If the market maker does not hold an inventory of assets, the ask and bid quote specific spreads are the same. However, if there is an inventory, the ask and bid quote spreads differ from one another, caused by inventory skewing the quotes. This is done to lower the probability of the quote resulting in additional inventory being hit while also increasing the probability of the quote resulting in lower inventory being hit.
Based on this, the model expresses the optimal bid and ask prices as:
\text{bid} = r - q\gamma\sigma^2 - \gamma\ln(1 + \gamma\kappa)
\text{ask} = r - q\gamma\sigma^2 + \gamma\ln(1 + \gamma\kappa)
3. AMMs
Automated Market Makers (AMMs) are a market-making mechanism used to facilitate trading on top of blockchains with limitations on data throughput. The main difference between LOBs and AMMs is that with AMMs, the price discovery happens independent of liquidity providers’ actions based on the traders interacting with the AMM, while in LOBs, the price is determined proactively based on which bid and ask quotes different liquidity providers decide to post. This means that the AMM liquidity providers are able to passively deposit funds into the AMM pool, and the price of the AMM is determined based on trades interacting with the pool without liquidity providers’ active participation in the pool beyond depositing the funds. This reduces both the number of interactions liquidity providers have to perform as well as the amount of on-chain data arising out of such interactions while achieving a relatively efficient market. However, the tradeoff for this is that the liquidity providers are no longer able to control their quotes beyond the option to provide liquidity in different pools.
Milionis et al. (https://arxiv.org/pdf/2305.14604) determine how much toxic volume there theoretically should be between a centralized exchange and an AMM based on the volatility of a token, block time, and AMM fee. Based on these variables, the study finds that the probability of a toxic transaction for an individual block decreases as
-
AMM fees increase
-
Volatility decreases
-
Block time decreases
This is due to the decrease in the probability of there being a significant enough price discrepancy between the venues for an arbitrage opportunity. The authors highlight that faster block time reduces arbitrage profits without hurting AMM’s fee income, and fees should be optimized between protecting AMM liquidity providers from arbitrage and how competitive the price is with other venues. Below is a visualization of the probability of an arbitrage transaction in a block and the expected number of arbitrage opportunities over 12 seconds with different block times and fees based on 5% daily volatility.
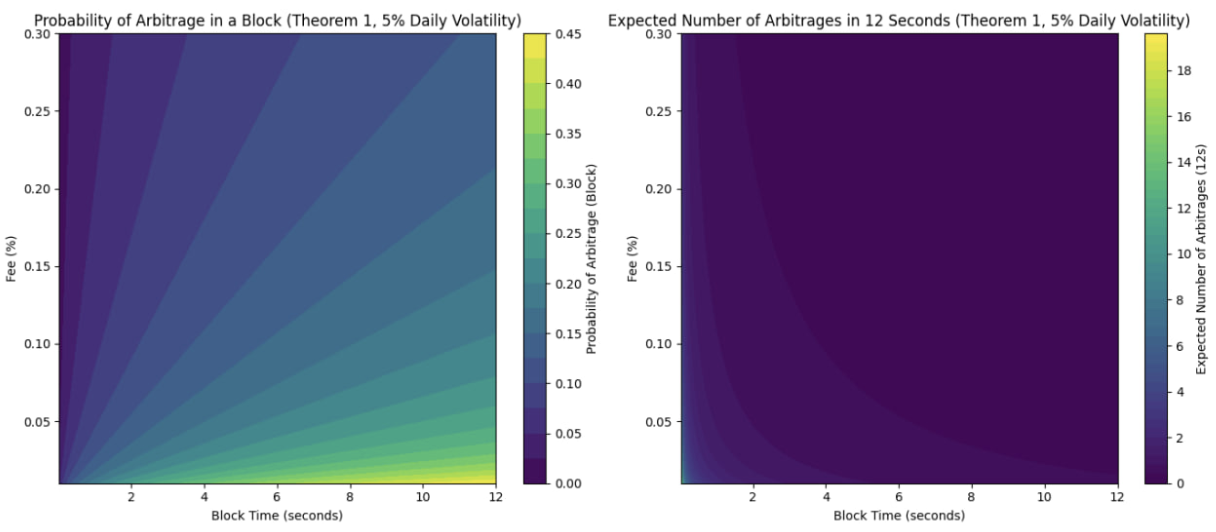
Figure 1: Probability of arbitrage in a block and expected number of arbitrages over 12 12-second periods with different block times and fees based on 5% daily volatility
Campbell et al. (https://arxiv.org/pdf/2508.08152) model optimal fees for liquidity providers in AMMs using data from ETH/USDC in Uniswap v2 and Binance. They assume that fundamental traders route their orders between different venues based on how competitive the venues’ prices are. The study finds that optimal fees for AMMs undercut the trading costs traders have in centralized exchanges modestly during normal market conditions by charging between 70% and 80% of effective trading costs in centralized exchanges. The market volatility impacts the profitability of the LP across all fee levels, with higher volatility corresponding to lower profitability. The liquidity providers face the trade-off of fees having to be low enough to attract volume, but on the other hand, needing to be high enough to offset losses from arbitrage between AMM and centralized exchanges. To account for this, the study suggests a threshold-type dynamic fee where the AMM fee is stable and slightly below costs associated with trading in a centralized exchange during periods of low volatility, but the fee is increased much higher, or trading in the AMM is halted altogether, during periods of high volatility. This study concludes by pointing out that the current fees of 30 bps may be too high for many pools in AMMs and suggests that most AMM pools would benefit from decreasing the fee level closer to 5 bps. The authors also note that decreasing the block time would improve the profitability of liquidity providers.
On-chain noise traders suffer from the long block time of Ethereum in various ways. First, the AMM LPs might choose to provide liquidity in higher fee pools, given the long block time compared to if the block time were shorter, to protect from the negative effect that toxic volume has on the LP returns. If the block time were shorter, resulting in lower negative effects from toxic volume, the LPs could instead choose to provide liquidity at lower fee pools. This would result in lower fees paid by traders, which would make AMMs a more attractive option for buying and selling assets, resulting in higher fee revenue for LPs through increased noise trading volume.
Second, if noise traders execute transactions on the AMM pool in the direction of increasing the price discrepancy between AMM and a centralized exchange, the trade will have a worse execution price than centralized exchange. This is caused by arbitrageurs performing arbitrage only to the extent that it is profitable, resulting in the pool price being fees worth away from the centralized exchange after the arbitrageurs’ transactions. For example, if token is trading at $10,000 on centralized exchange with “infinite liquidity” and $10,100 on AMM and the combined fees for performing trades on both centralized exchange and AMM are 0.5% the arbitrageur will move the AMM price to $10,050 as after that the point the marginal profits from the trade are negative and before the point the point arbitrageur is leaving money on the table. If a noise trader wants to buy a token on the AMM after the arbitrage transaction, the noise trader will end up paying more for the token compared to a centralized exchange.
Third, the block time results in trades being settled every 12 seconds, which results in traders being uncertain at which price their trade will be settled. For example, if a trader sends a transaction 2 seconds into a slot, they are exposed to the price evolution of the asset for 10 seconds before the trade is settled. For example, if a token is trading at $10,000 and a trader initializes a transaction to buy 1 token for $10,000 with tight slippage tolerance, and the centralized exchange price increases to $10,050 before the next block, the trade fails, and the trader misses out on the $50 of profit. However, had the block time been shorter, the trade would have gone through.
4. Data
To analyze the impact of decreasing the block time in Ethereum on AMM liquidity providers and traders, I acquire data from both AMM and centralized exchanges. For AMMs, I focus on Uniswap v3 on top of the Ethereum blockchain. For centralized exchanges, I use Binance for everything, except determining bid-ask spread, as it is the most liquid venue, and I assume that the price discovery process for assets analyzed in this study happens on Binance, or if it happens on another venue, the Binance price reflects the other venue’s price before Uniswap does. Using the event data from Uniswap pools, I recreate the pool state at the beginning and end of each block that has swaps and match it with the respective Binance price using the blocks’ timestamps.
I collect swap, mint, and burn events for the following Uniswap v3 pools on top of the Ethereum mainnet: USDC - WETH pool with a 5 bps fee, USDC - WETH pool with a 30 bps fee, USDC - SEI pool with a 30 bps fee, and USDC - WBTC pool with a 30 bps fee. The first block of the dataset is 22 607 000 produced at 2:53 AM UTC on June 1st, 2025, and the last block of the dataset is 22 820 000 produced at 9:44 PM UTC on June 30th, 2025. The mint and burn events are used for calculating the amount of liquidity in the pools, while swap events are used for determining the trades in the pools.
For Binance, I collect historical data for 1-second candles and trades for the same period. For all pairs, I acquire data for USDT - Token pairs, as USDT pairs have higher volume and liquidity than corresponding USDC pairs.
For determining the bid-ask spreads, I use data between June 1st, 2025, and June 7th, 2025, from Bybit. I use data from Bybit, as the historical orderbook data is not easily available for Binance.
5. Methodology
Arbitrage / toxic flow
To identify the subset of AMM transactions that are arbitrage between Uniswap and Binance, I do the following. First, I compare the AMM pools’ prices at the end of each block with the prices from Binance 1-second candle data with a timestamp corresponding to the next block to identify blocks where the price difference between Binance and Uniswap pools has been higher than the fees of the pool.
\frac{|P_{\text{AMM}} - P_{\text{Binance}}|}{\min(P_{\text{AMM}}, P_{\text{Binance}})} > f
Where P_{\text{AMM}} is price in AMM pool, P_{\text{Binance}} is price in Binance, and f is fees.
Second, from these blocks, I identify cases where the first transaction touching the AMM pool results in the price difference converging as a result of the transaction.
(P^*_{\text{AMM}} > P_{\text{AMM}} \land P_{\text{Binance}} > P_{\text{AMM}}) \lor (P^*_{\text{AMM}} < P_{\text{AMM}} \land P_{\text{Binance}} < P_{\text{AMM}})
Where P^*_{\text{AMM}} is the price of AMM after the transaction
Third, I check that the blocks’ first transaction touching the AMM pool does not cause the price difference to converge closer than the trading fees. This is done to distinguish between transactions that move the price closer to the Binance price and are arbitrage, from the ones that move the price closer but are not.
P^*_{\text{AMM}} \geq P_{\text{Binance}} \cdot (1 + f), \text{ if } P_{\text{AMM}} > P_{\text{Binance}}
P^*_{\text{AMM}} \leq \frac{P_{\text{Binance}}}{1+f}, \text{ if } P_{\text{AMM}} < P_{\text{Binance}}
Based on these criteria, I calculate the volume and number of transactions in each AMM pool that are toxic and noise trading. I use this figure as a baseline for other analyses.
Change in revenue from toxic and noise trading
After determining the baseline for toxic and noise trading, I simulate how the amount of arbitrage would change if block times were decreased or fees were changed. This is done by analyzing price movements from the Binance 1-second candle and trade data, and sampling the data into different periods. For candle data, open prices are used to determine the price movements during a period of time. For trade data, the price of a trade with a matching timestamp or the last timestamp before the end of a period is used to calculate the price movements. Based on this, I analyze how different block times and fees affect the amount of arbitrage and AMM’s revenue from it.
After determining how AMM pools’ revenue from toxic transactions changes, given different block times, I perform a scenario analysis on how changing the volume of noise trading affects the AMM pools’ revenue and whether the pools’ revenue is mainly driven by noise trades, toxic volume, or a combination of both, assuming the TVL of the pool does not increase. In scenario A, the volume from noise trading increases 25% as the block time is halved, and in scenario B, the increase is 50%.
Campbell’s optimal fee
Lastly, I analyze the historical spread and cost associated with spot trading on Bybit to understand what the AMM fees should be set at if the pool were to follow the fee level recommended by Campbell et al. I estimate the costs associated with spot trading by halving the bid-ask spread and adding VIP0 spot trading fees of 0.1% on top.
6. Results
Arbitrage / toxic flow
Table 1 lists the percentage of arbitrage transactions and their volume in different pools, and Figures 2 and 3 visualize them for the ETH-USDC 5 bps and SEI-USDC 30 bps pools, respectively. Out of the studied pools, all except SEI have a higher arbitrage percentage in terms of volume than in terms of transaction count. This indicates that arbitrage transactions tend to be bigger than the average transaction in size. This is also supported by visualizations in Figures 2 and 3. The third subplots in Figures 2 and 3 visualize distributions for arbitrage count and revenue and indicate that this is also the case on a daily level. Other pools that are not visualized had similar distributions.
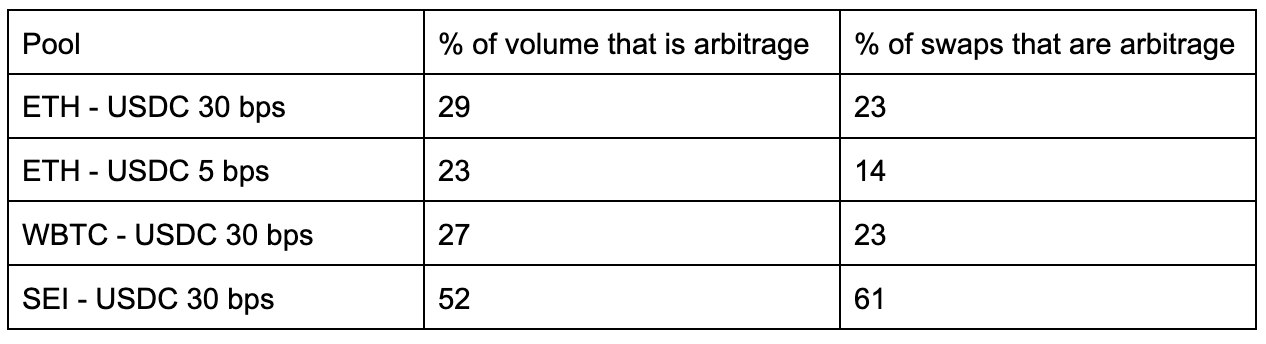
Table 1: Percentage of arbitrage transactions and their volume in different pools
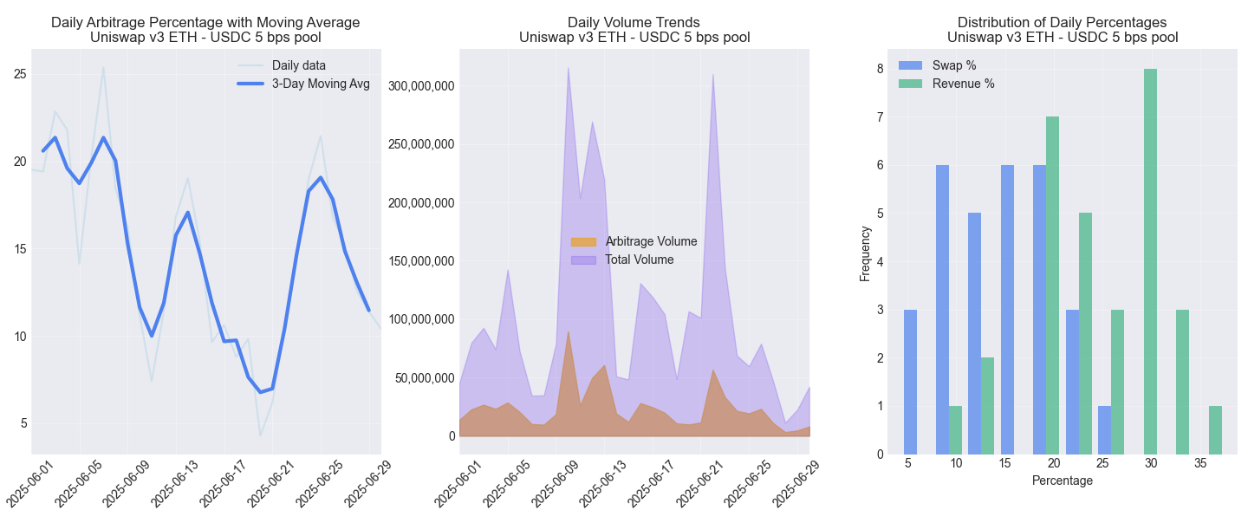
Figure 2: Percentage of arbitrage transactions and their volume in Uniswap v3 ETH - USDC 5 bps pool
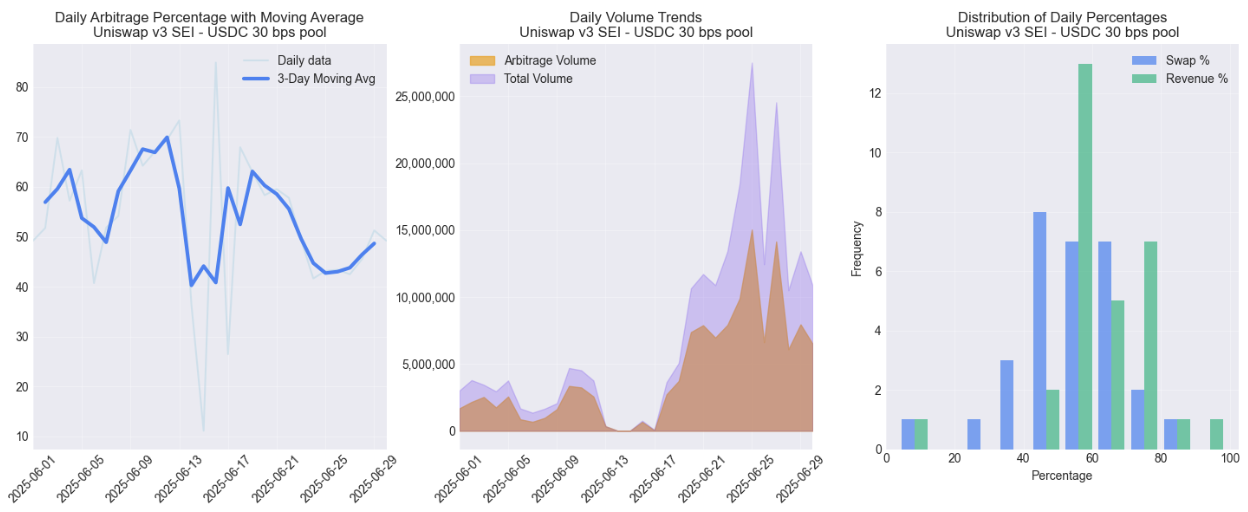
Figure 3: Percentage of arbitrage transactions and their volume in Uniswap v3 SEI - USDC 30 bps pool
Change in revenue from toxic and noise trading
Figures 4 and 5 visualize simulated revenue from arbitrage transactions for different fees and block times for ETH and SEI pools, respectively. In both cases, the arbitrage revenue pools increase as fees and block time decrease. However, if the pool fee is decreased too close to 0, the revenue starts decreasing. Revenue increases when fees and block times decrease because the additional revenue from additional arbitrage opportunities more than compensates for the lower fee income per transaction. These results are in line with Milionis et al.
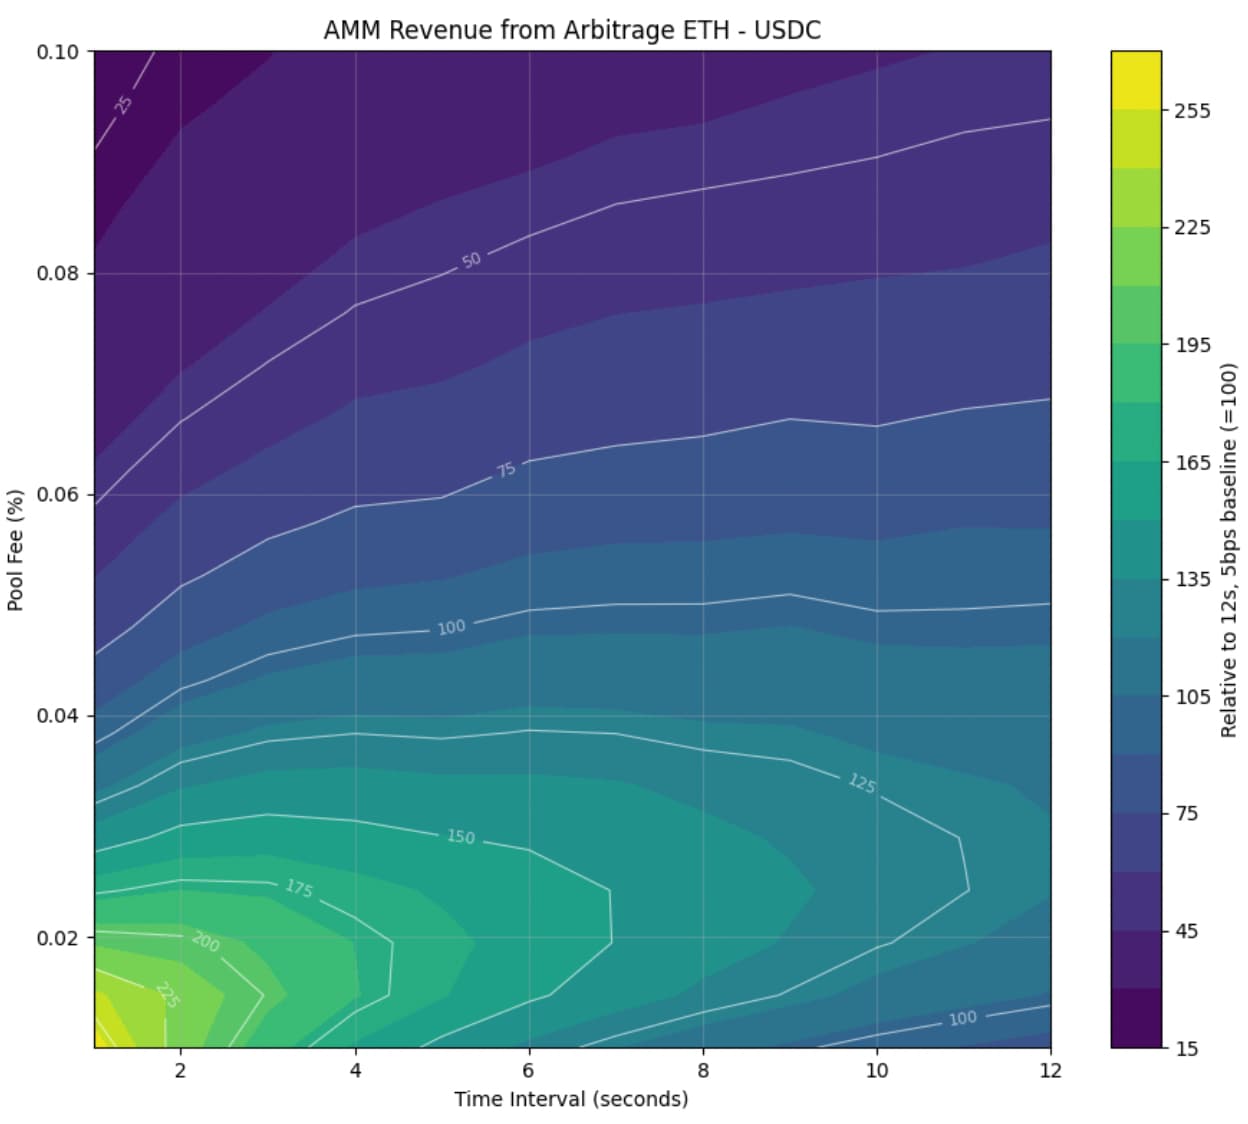
Figure 4: Revenue from arbitrage transactions for ETH - USDC with different block time and fee combinations relative to baseline of 12s block time and 5bps fee*
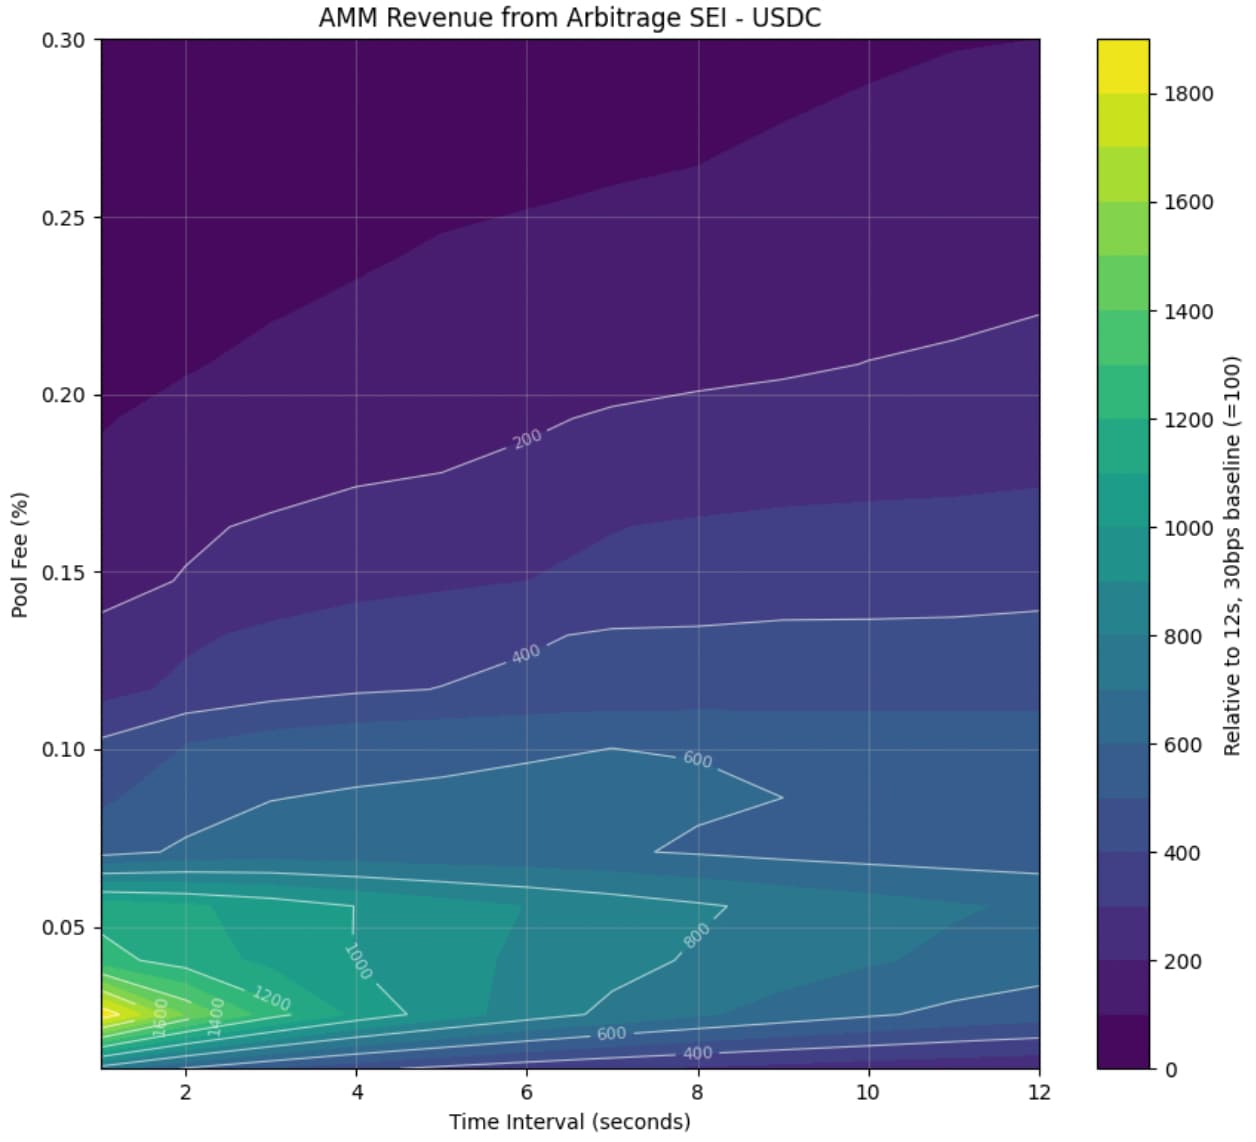
Figure 5: Revenue from arbitrage transactions for SEI - USDC with different block time and fee combinations relative to baseline of 12s block time and 30bps fee*
Interestingly, if the block time were to be decreased below 1 second, the simulation, visualized in Figure 6, suggests that the revenue from arbitrage would increase significantly. This is most likely caused by big orders momentarily eating up a lot of liquidity and big price shocks.
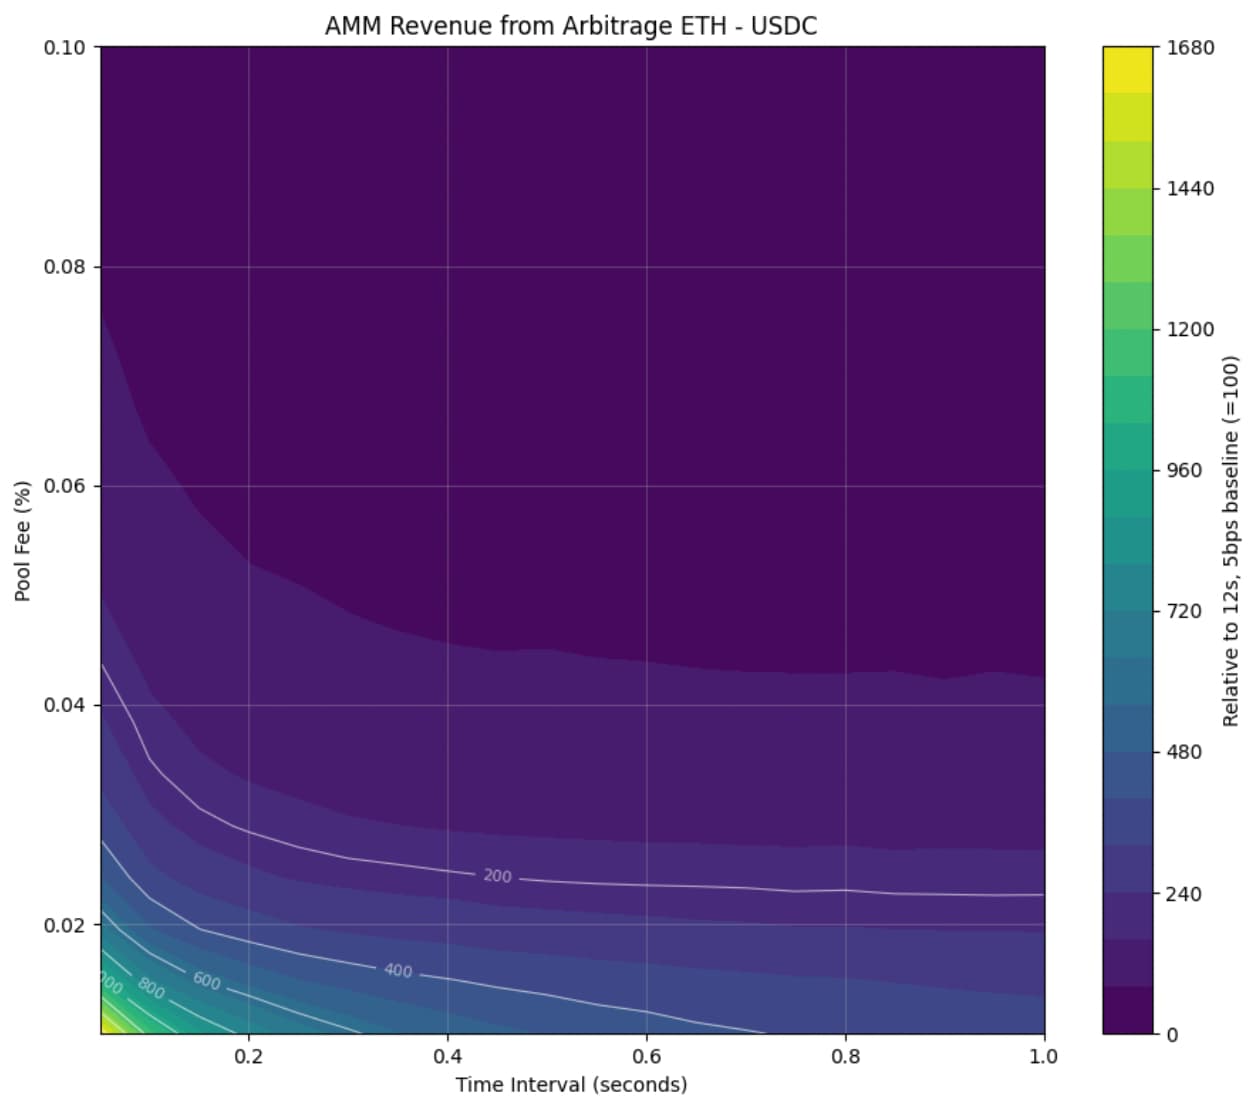
Figure 6: Revenue from arbitrage transactions for ETH - USDC with different subsecond block times and fee combinations relative to baseline of 12s block time and 5bps fee
After analyzing how fee and block time combinations would affect the arbitrage revenue of AMM pools, I analyze the total revenue, including noise trading, for different pools in different scenarios. Figures 7 and 8 visualize the revenue from arbitrage, total revenue with the current amount of noise trading, as well as Scenario A, where noise trading volume increases by 25% when block time is halved, and Scenario B, where noise trading volume increases by 50% when block time is halved. These values are also listed in Tables 2, 3, and 4. The first subplot of Figure 7 shows that out of the visualized fees ETH - USDC pool gets the highest relative amount of arbitrage-related revenue when fees are set to 2 bps. This indicates that if an optimal block time and fee combination were to be used, the AMM pool’s revenue from arbitrage could be doubled. However, the second subplot visualizes that when accounting for both toxic and noise trading volume, the revenue is the highest for all block times at 10 bps. From the third and fourth subplots, I can observe the same phenomenon - as block time decreases and noise trading volume increases, the revenue for the higher pool fees remains the highest. These findings suggest that with optimal block time and fees and current volume, the revenue for AMM could increase to 1.6 times, and for scenarios A and B, the increase would be to 3.5 times and 7 times the current revenue.
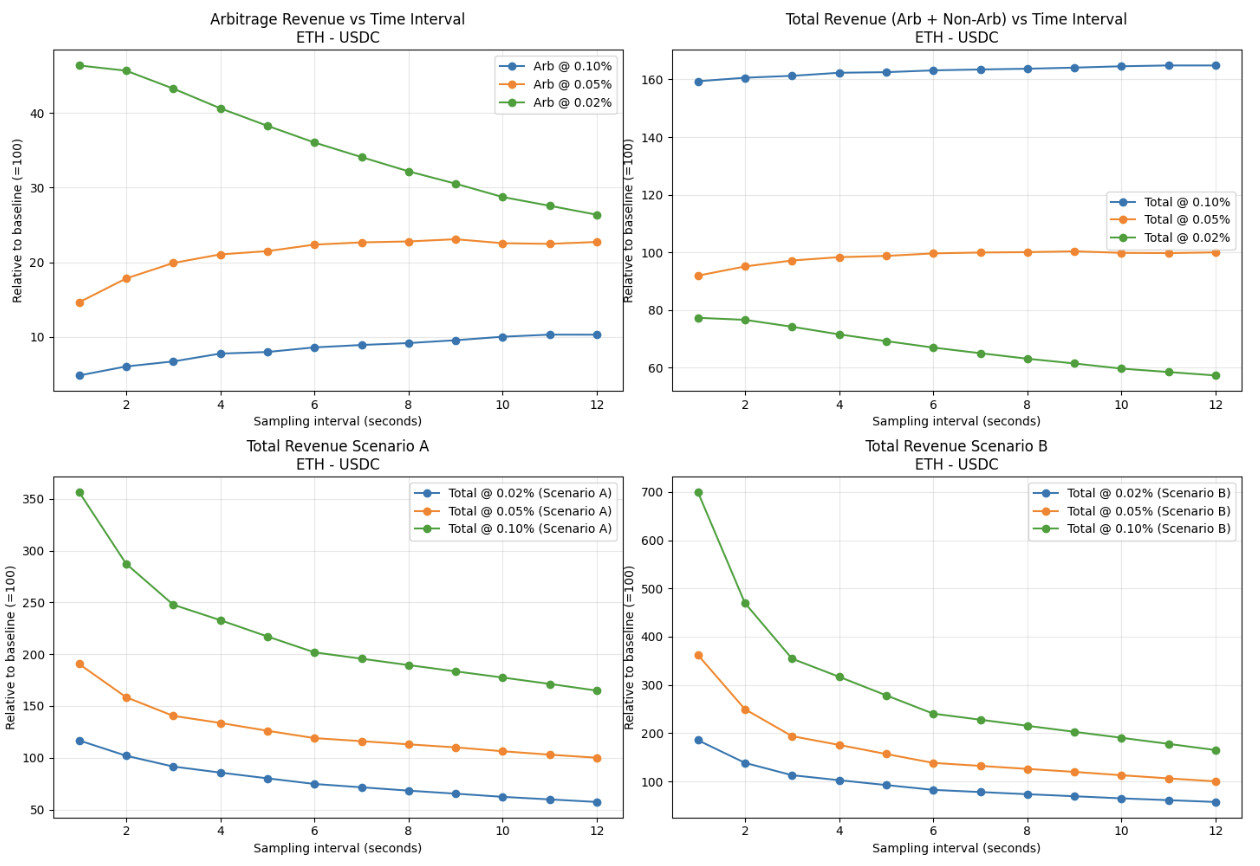
Figure 7: ETH - USDC pool’s arbitrage revenue, total revenue, and total revenue if noise trading volume increases 25% (Scenario A) or 50% (Scenario B) when block time halves relative to current revenue at 12s block time and 5 bps fees
Figure 8 shows contradicting results with SEI. Revenue from arbitrage is the highest for visualized fees with 12-second blocks when the fee is 5 bps, but as the block time decreases, the 2 bps fee generates the most arbitrage revenue. If an optimal block time and fee combination were to be used, the AMM pool’s revenue from arbitrage could increase to 15 times the current revenue. The results do not change significantly for the second subplot with both toxic and noise trading volume, which is due to volume arising out of arbitrage playing such a significant part in the total revenue of the pool. The same holds even in Scenarios A and B due to the noise trading volume being so small relative to the amount of revenue that is to be made from optimizing for arbitrage. Other tokens with limited liquidity, such as some memecoins, had similar characteristics.
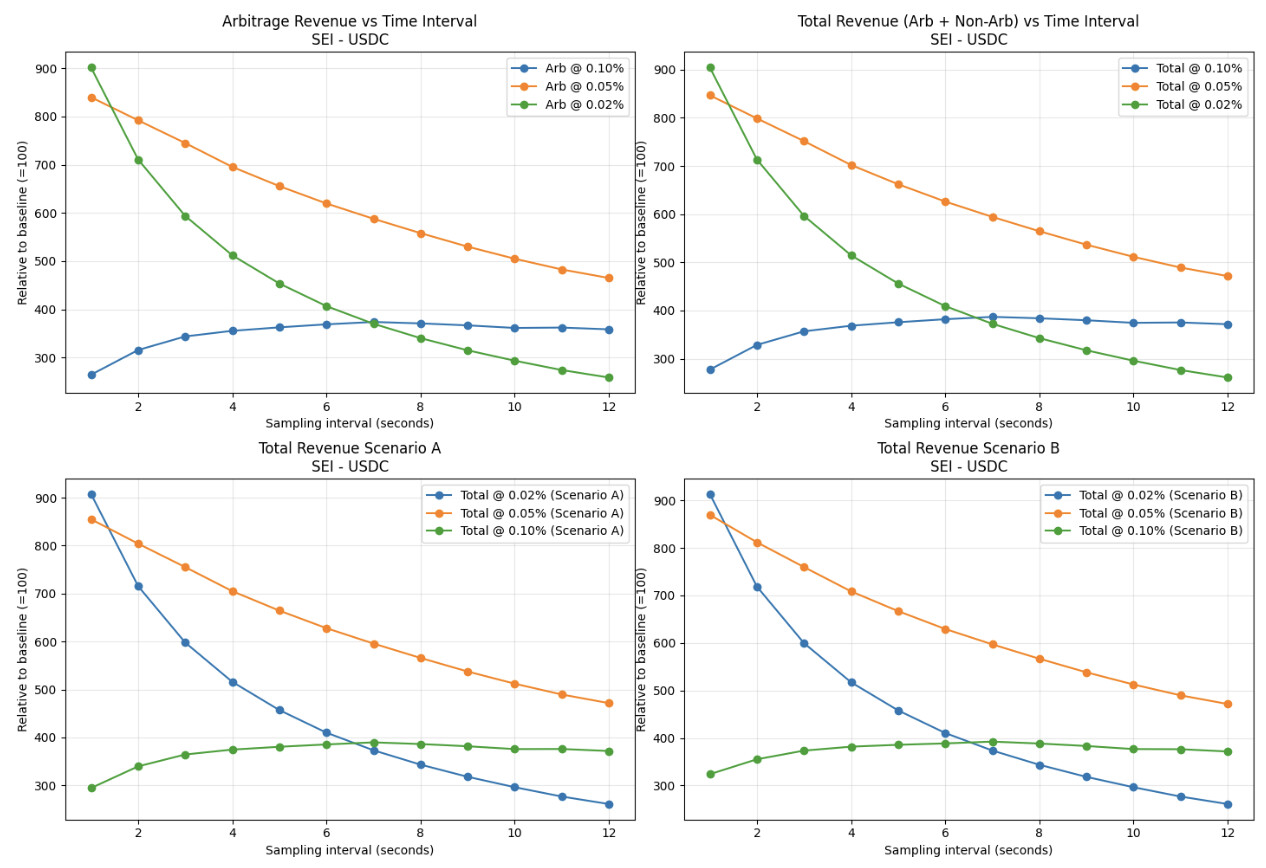
Figure 8: SEI - USDC pool’s arbitrage revenue, total revenue, and total revenue if noise trading volume increases 25% (Scenario A) or 50% (Scenario B) when block time halves relative to current revenue at 12s block time and 30 bps fees
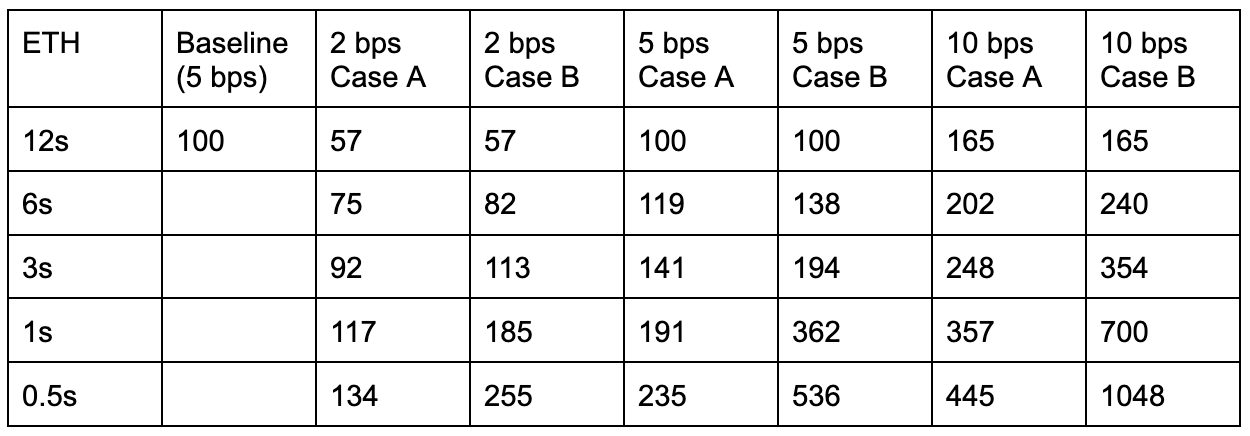
Table 2: ETH - USDC pool revenue, for a given transaction fee, relative to current revenue in different scenarios, where in A and B, noise trading volume increases 25% and 50% when block time is halved, respectively
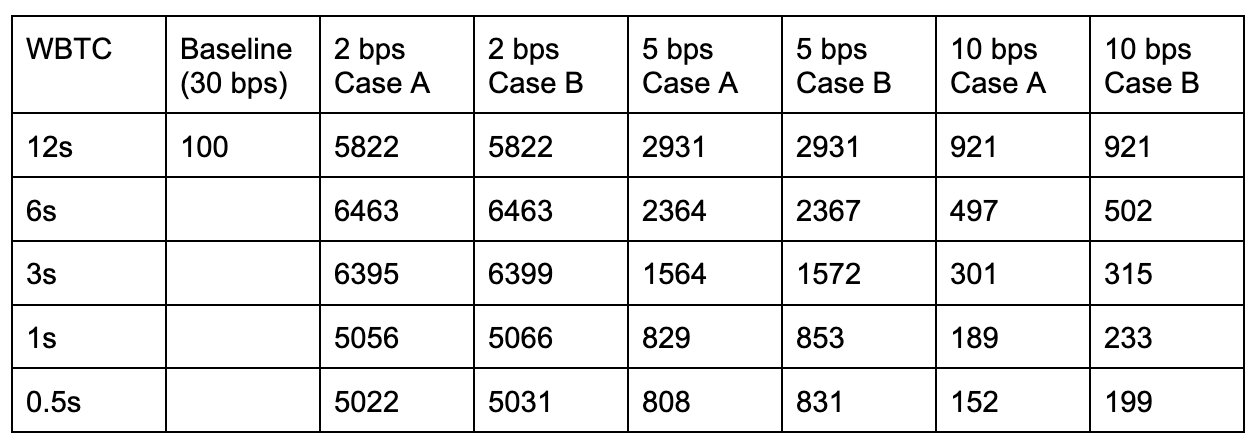
Table 3: WBTC - USDC pool revenue, for a given transaction fee, relative to current revenue in different scenarios, where in A and B, noise trading volume increases 25% and 50% when block time is halved, respectively
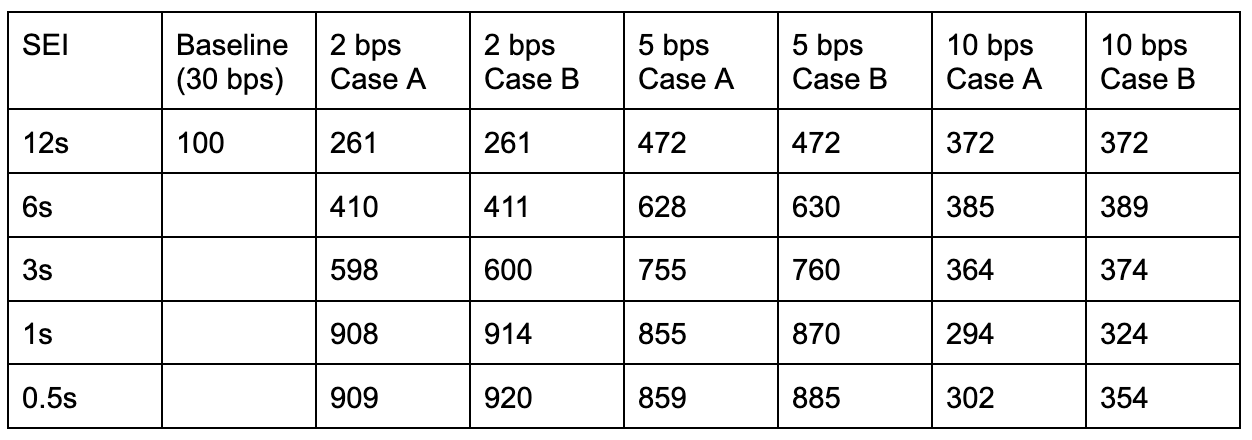
Table 4: SEI - USDC pool revenue, for a given transaction fee, relative to current revenue in different scenarios, where in A and B, noise trading volume increases 25% and 50% when block time is halved, respectively
Campbell’s optimal fee
Table 5 lists bid-ask spreads and trading costs with fees for different pairs. The median spread ranges from 0.7 bps to 15.4 bps, with ETH and BTC having low median spreads, while SEI has a 15 times higher spread than ETH and BTC. Interestingly, when looking at mean spreads, BTC’s spread is only half a basis point higher than the median, while ETH is 17 bps higher at 35 bps, and SEI is over three times higher at 55 bps. In terms of trading costs with fees, the medians are 10 and 11 bps for BTC and ETH, while the cost is 18 bps for SEI, and the fees vary between 10 and 38 bps when considering the mean costs.
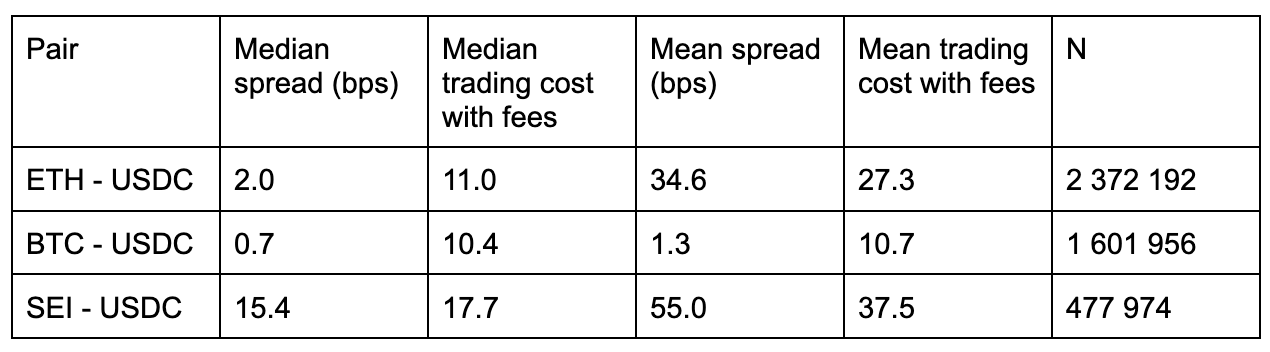
Table 5: Median and mean bid-ask spreads and trading costs with fees for different pairs in Bybit
Table 6 displays mean and median trade sizes as well as median gas-to-trade ratio for 5 bps and 30 bps Ethereum pools on top of different chains. The amount of gas used relative to the amount traded is above 1 basis point only for mainnet 5 bps and base 5 bps pools. This means that, excluding these pools, the amount of money traders spend on gas, on average, is relatively nonexistent. However, it is important to note that the mean and median trade sizes in mainnet are multiple times higher than other chains. This means that the gas fee would play a significantly bigger role if trades on mainnet were smaller.
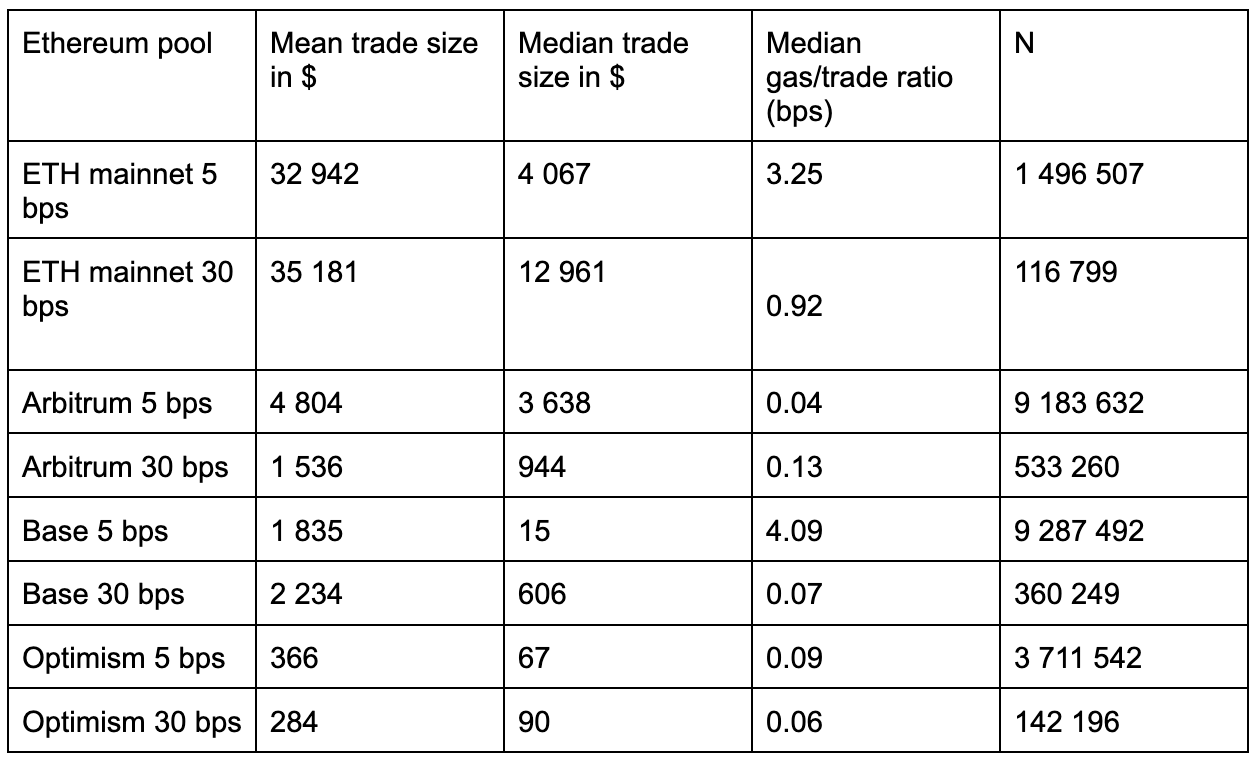
Table 6: Mean and median DEX trade sizes for ETH - USDC and the relative gas cost of swap on different pools
Considering Campbell’s proposal that AMMs should undercut centralized exchanges in trading costs by quoting fees that result in 70% - 80% of trading costs for the trader, the optimal fees would be between 4 and 30 basis points, depending on whether median or mean trading costs are used. If median trading costs and gas cost of 3 bps are used, the optimal fee for BTC and ETH would be between 4 and 6 bps, and the optimal fee for SEI would be between 9 and 11 bps. On the other hand, if mean trading costs and gas costs of 1 bps are used, the optimal fee for BTC would be between 6 and 8 bps, for ETH between 18 and 21 bps, and for SEI between 25 and 29 bps.
7. Findings and Discussion
The AMM trading pairs can be divided into two groups based on the amount of toxic volume and noise trading volume they exhibit relative to Binance or other centralized venues. If the toxic volume is high and the noise trading volume of AMM is not significantly lower than Binance, the AMM’s revenue can be optimized by optimizing the fees for arbitrage trading between AMM and a centralized venue. On the other hand, if toxic volume only makes up part of the volume and/or noise trading volume on a centralized venue is significantly higher than on the AMM, the pool should be optimized for generating as much volume as possible through fee revenue by optimizing noise trading volume. However, regardless of which of these groups the AMM pool falls under, it is important to note that decreasing the block time would be beneficial for the pool both in terms of a decrease in adverse selection and a better experience for the traders.
Shorter block time allows the AMM pools to decrease their fees as they no longer need to protect to the same extent against adverse selection with high fees. This not only improves the experience for the traders by decreasing their trading costs but also decreases the price discrepancy between the centralized venue and AMM, as well as makes the price on the AMM less stale. In addition, the traders also benefit by having a decreased chance of their pending transactions failing due to a price movement before the next block.
Besides looking into how the fees could be lowered by shorter block time, having smaller chances for adverse selection, I also look into what would be the optimal pool fees according to Campbell. I find that, based on the median trading costs, the pools should have about 11 bps fees for the ETH and BTC pools and about 18 bps fees for the SEI pool.
8. Summary
This study examines whether reducing Ethereum’s block time from 12 seconds could improve the experience for both traders and liquidity providers on Automated Market Makers (AMMs). By analyzing Uniswap v3 pools against Binance’s data, I find that, for examined pools, 23-52% of AMM volume consists of arbitrage transactions that exploit price discrepancies between Uniswap and Binance, with the remainder being from noise trading.
The findings demonstrate that shorter block times would benefit the AMMs by reducing the need for arbitrage protection, thereby allowing pools to offer lower fees while maintaining liquidity provider protection. This creates a cycle: lower fees attract more trading volume, improve price competitiveness with centralized exchanges, reduce transaction failure rates, and decrease price staleness. AMM pools fall into two categories: ones with high toxic volume that should optimize fees for arbitrage protection and others that should focus on maximizing overall volume through competitive pricing. For the studied highly toxic volume pool, the revenue for short block times combined with optimal fees could increase the revenue by up to 15 times while the increase in revenue could be about 60% without increase in noise trading volume for ETH - USDC, and up to 600% if the noise trading volume was to increase significantly as the result of lower block time.
Based on the analysis, the current 30 basis point fees appear too high for many pools. Optimal fees should range from 4-11 basis points for major assets like ETH and WBTC, following Campbell et al.’s framework of undercutting centralized exchange costs. Implementing shorter block times would improve AMM’s competitiveness through arbitrage protection and user experience through lower fees.