^rare picture of an organic prover killer about to kill an Ethereum block.
Thanks to Maria Silva for helping extract accurate gas costs from EVM operations through her work on evm-meter-analysis, and to Ignacio Hagopian, Anders Elowsson, Caspar Schwarz‑Schilling, and Joshua for their valuable comments and feedback on this post.
Introduction
Ethereum is rapidly moving toward scaling its L1 using zkVMs, by enabling validators to verify a SNARK proof for each block rather than having to re-execute it. As proving costs continue to drop, real-time block proving (i.e., proving blocks under 12 seconds) may become feasible by the end of 2025, highlighting the need for the protocol to prepare proactively for this transition. A key consideration is how to price EVM operations (i.e., opcodes and precompiles) in a zkVM world. EVM operations that are inexpensive to execute locally on a CPU could become computationally intensive during cryptographic proof generation.
This difference raises critical questions about how the protocol should adjust opcode and precompile pricing to accurately reflect the true costs of cryptographic proving. Repricing efforts are essential to prevent prover-killer attacks, where transactions and blocks are packed with operations disproportionately expensive to prove, potentially causing liveness failures if provers fail to generate proofs on time. With multiple zkVMs operating in parallel, another question also arises: Should repricing align with the fastest zkVM, the slowest, or a more conservative average among top performers? Addressing this question will be crucial to maintaining network stability without disproportionately affecting specific zkVMs.
So far, identifying worst-case scenarios has largely depended on intuition and prior knowledge to construct specially crafted “prover-killer” blocks, which maximize the computational complexity of cryptographic proofs. These blocks were empirically tested to measure proving overhead under extreme conditions. Recently, the ongoing development of a standardized zkVM benchmark suite has introduced a more structured approach, using targeted test cases to simulate computationally intensive operations to assess prover overhead in worst-case scenarios more accurately.
In this post, we introduce a complementary, data-driven approach aimed at detecting organic prover-killer (OPK) blocks, which are real mainnet blocks that were not explicitly constructed but still show disproportionately high proving times relative to their gas usage. Leveraging real-world proof data submitted by various zkVM teams, we systematically identify these organic prover-killer blocks and analyze them alongside carefully matched control blocks that have similar gas usage (see OPK block detection section for more details).
Our goal is to reveal specific opcode and precompile usage patterns associated with increased proving complexity. We outline our methodology, perform a statistical analysis to identify distinguishing features, and provide insights for future EVM pricing strategies and prover optimizations.
Methods
In this section, we briefly go over the data and methodology used to detect organic prover killer blocks on mainnet.
Data and preprocessing
- We used real-world proving data from ethproofs.org, a community resource that aggregates key metrics such as proving times, gas usage per block, block numbers, and prover teams from Ethereum’s zkVM ecosystem (e.g., Succint, Snarkify, ZKM).
- To identify specific opcode and precompile usage patterns linked to increased proving times (i.e., self-reported computation time during the proof generation process), we forked the evm-meter-analysis repository to extract raw execution traces for each block. This enabled us to aggregate opcode and precompile gas costs for each analyzed block.
OPK block detection
- To identify OPK blocks, we first model the relationship between a block’s total gas used and its proving time using Huber Regression (less sensitive to outliers than standard linear regression) for each proving team and for each day.
- We fit a separate Huber regression of proving time on total gas for each prover team on each day (rather than using a longer window) so that any sudden changes in prover performance (for example, an upgrade that speeds up proofs) become part of that day’s baseline. We then compute the residuals (actual minus predicted proving time) and flag any block whose residual exceeds a chosen multiple of that day’s Median Absolute Deviation (MAD) as an OPK candidate. This approach ensures that we catch only truly “prover-killer” blocks (those with disproportionately high proving times given their gas usage and that team’s typical daily performance) without mistaking normal improvements for outliers.
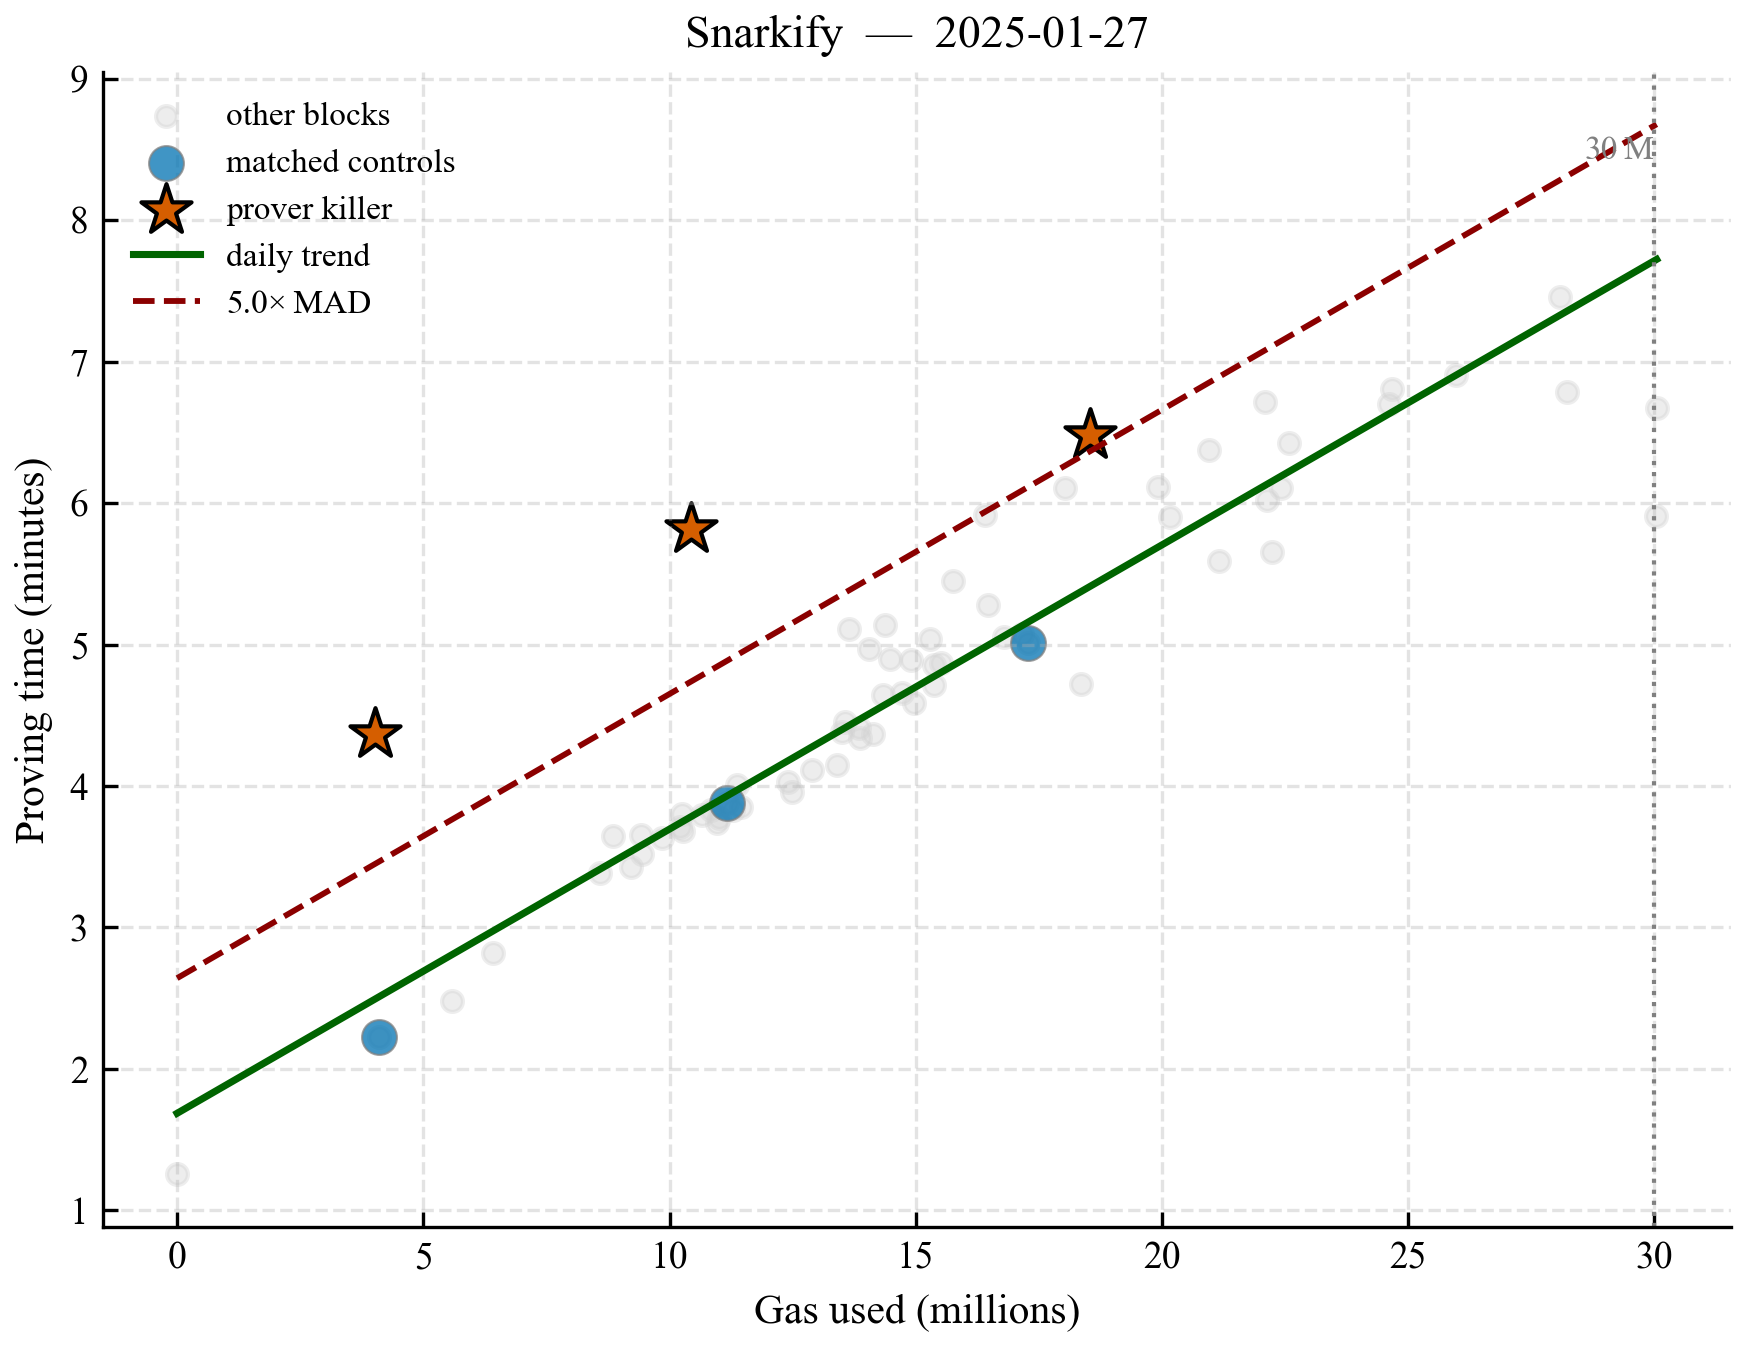
Figure 1. OPK block identification example. Scatter plot shows proving time (ms) vs. gas used. Orange stars represent prover-killer blocks, and blue circles their matched controls. Light grey dots represent other blocks from the same team/day for context. The dark green line is the Huber Regression trend for this team and day, and the dashed dark red line represents the 5.0x Median Absolute Deviation (MAD) threshold.
- Each identified OPK block (N=228) was then paired with a matched control block from the same proving team, selected for its similar total gas usage (within a ±10% tolerance) and temporal proximity (i.e., having the nearest proof creation timestamp). As shown in Figure 2, the distribution of gas used is not significantly different between OPK and matched control blocks (left panel, p-value = 0.2), but as expected we see statistically significant difference in their proving time distributions (right panel, p-value < 1.6e-20).
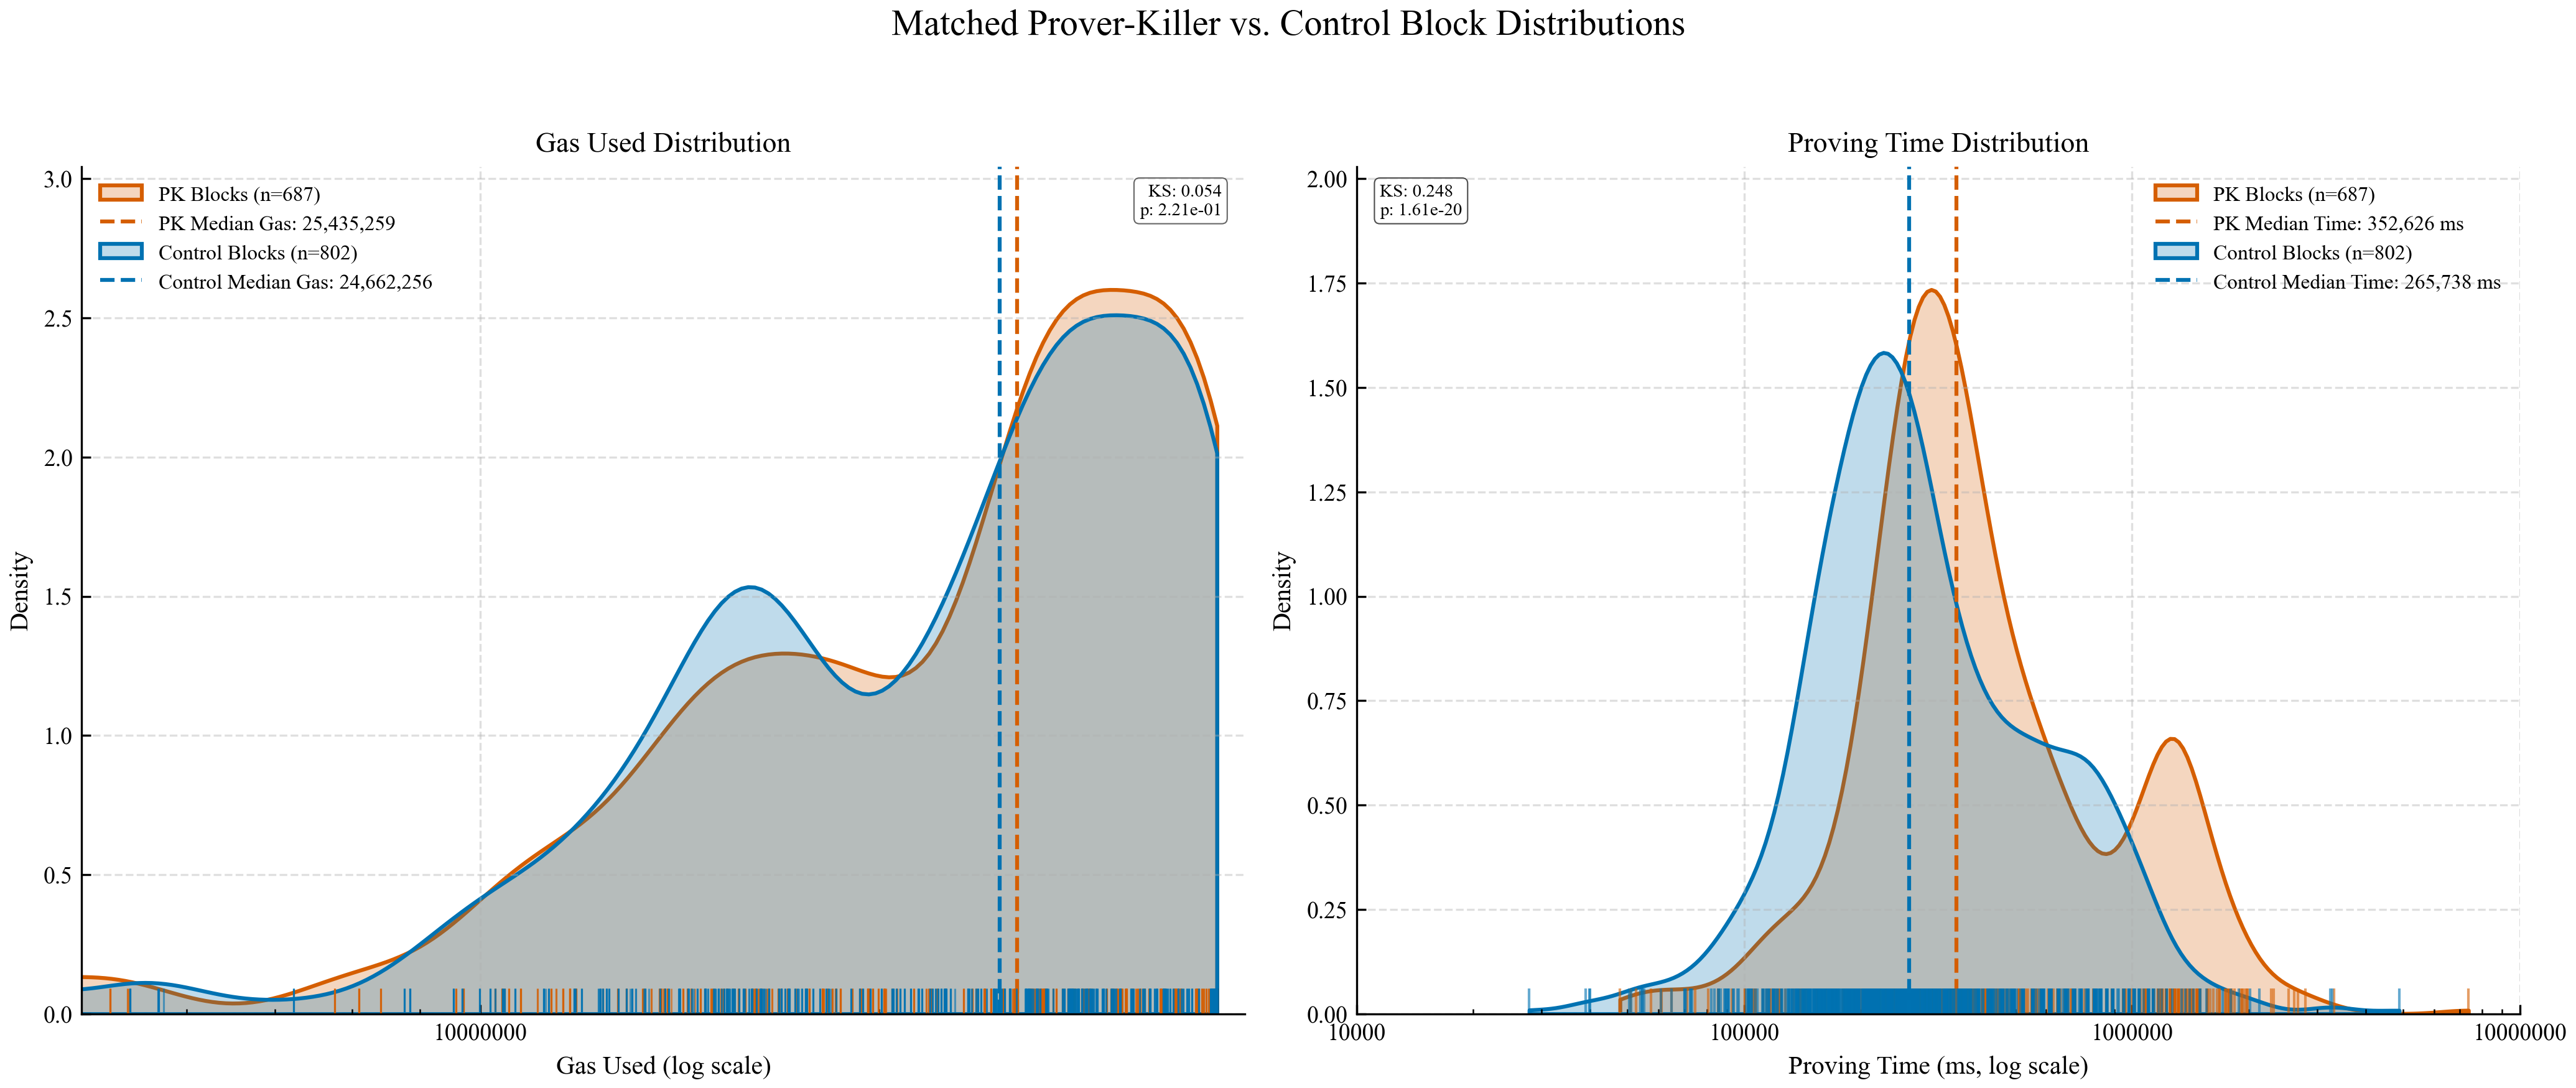
Figure 2: Kernel density estimate (KDE) plots of gas usage (left, log scale) and proving time (right, log scale) for Prover-Killer (PK) blocks (orange) and matched control blocks (blue). Dashed vertical lines represent medians, and inset Kolmogorov-Smirnov (KS) test p-values quantify distributional differences in each panel.
Results
After pairing every OPK block with a gas‑matched control we aggregated the gas consumed by each EVM operation (opcodes and precompiles) in every block. Because the total gas is held constant within each pair, any excess proving time must be explained by where that gas is spent. For each opcode and precompile we compared its mean gas in the OPK set with its mean gas in the control set, obtained the gas‑cost ratio (OPK ÷ Control), and calculated a Mann‑Whitney U p‑value together with Cohen’s d to measure statistical significance. If an OPK can’t be matched with a control, it is excluded from the analysis. We then ranked all operations by this ratio to spotlight those whose heavier usage correlates most strongly with the proving‑time spike. Figure 3 shows the 15 highest‑ranking EVM operations (features): bars are orange for opcodes or blue for precompiles when the difference is significant (p < 0.0005) and gray otherwise.
Gas Cost Analysis
To highlight EVM operations that impose disproportionately high proving complexity, we ranked every operation by the ratio of its mean gas cost in OPK blocks to the mean gas cost in matched controls (OPK ÷ Control). Figure 3 shows the top 15 features, ordered from highest to lowest ratio. Features with statistically significant differences (p < 0.0005) are highlighted in their standard colors (orange for opcodes, blue for precompiles), while non-significant features are shaded in gray.
Our analysis reveals that the precompiles point_evaluation, ecPairing, ecAdd, ecMul, and modexp, along with the opcodes MULMOD, ADDMOD, and BLOBHASH, consistently exhibit higher gas cost ratios and low p-values in OPK blocks. These operations dominate the gas mix inside OPKs and align with the highest proving‑time ratios, showing that where gas is spent (not how much) drives the extra proving work. Note this is based on real usage patterns. Note that appearing at the top of this list does not imply these operations are the absolute worst‑case attack vectors. Rather, they are the ones that surface most often in real‑world blocks and look systematically under‑priced; rare but even more pathological patterns might still exist outside our dataset.
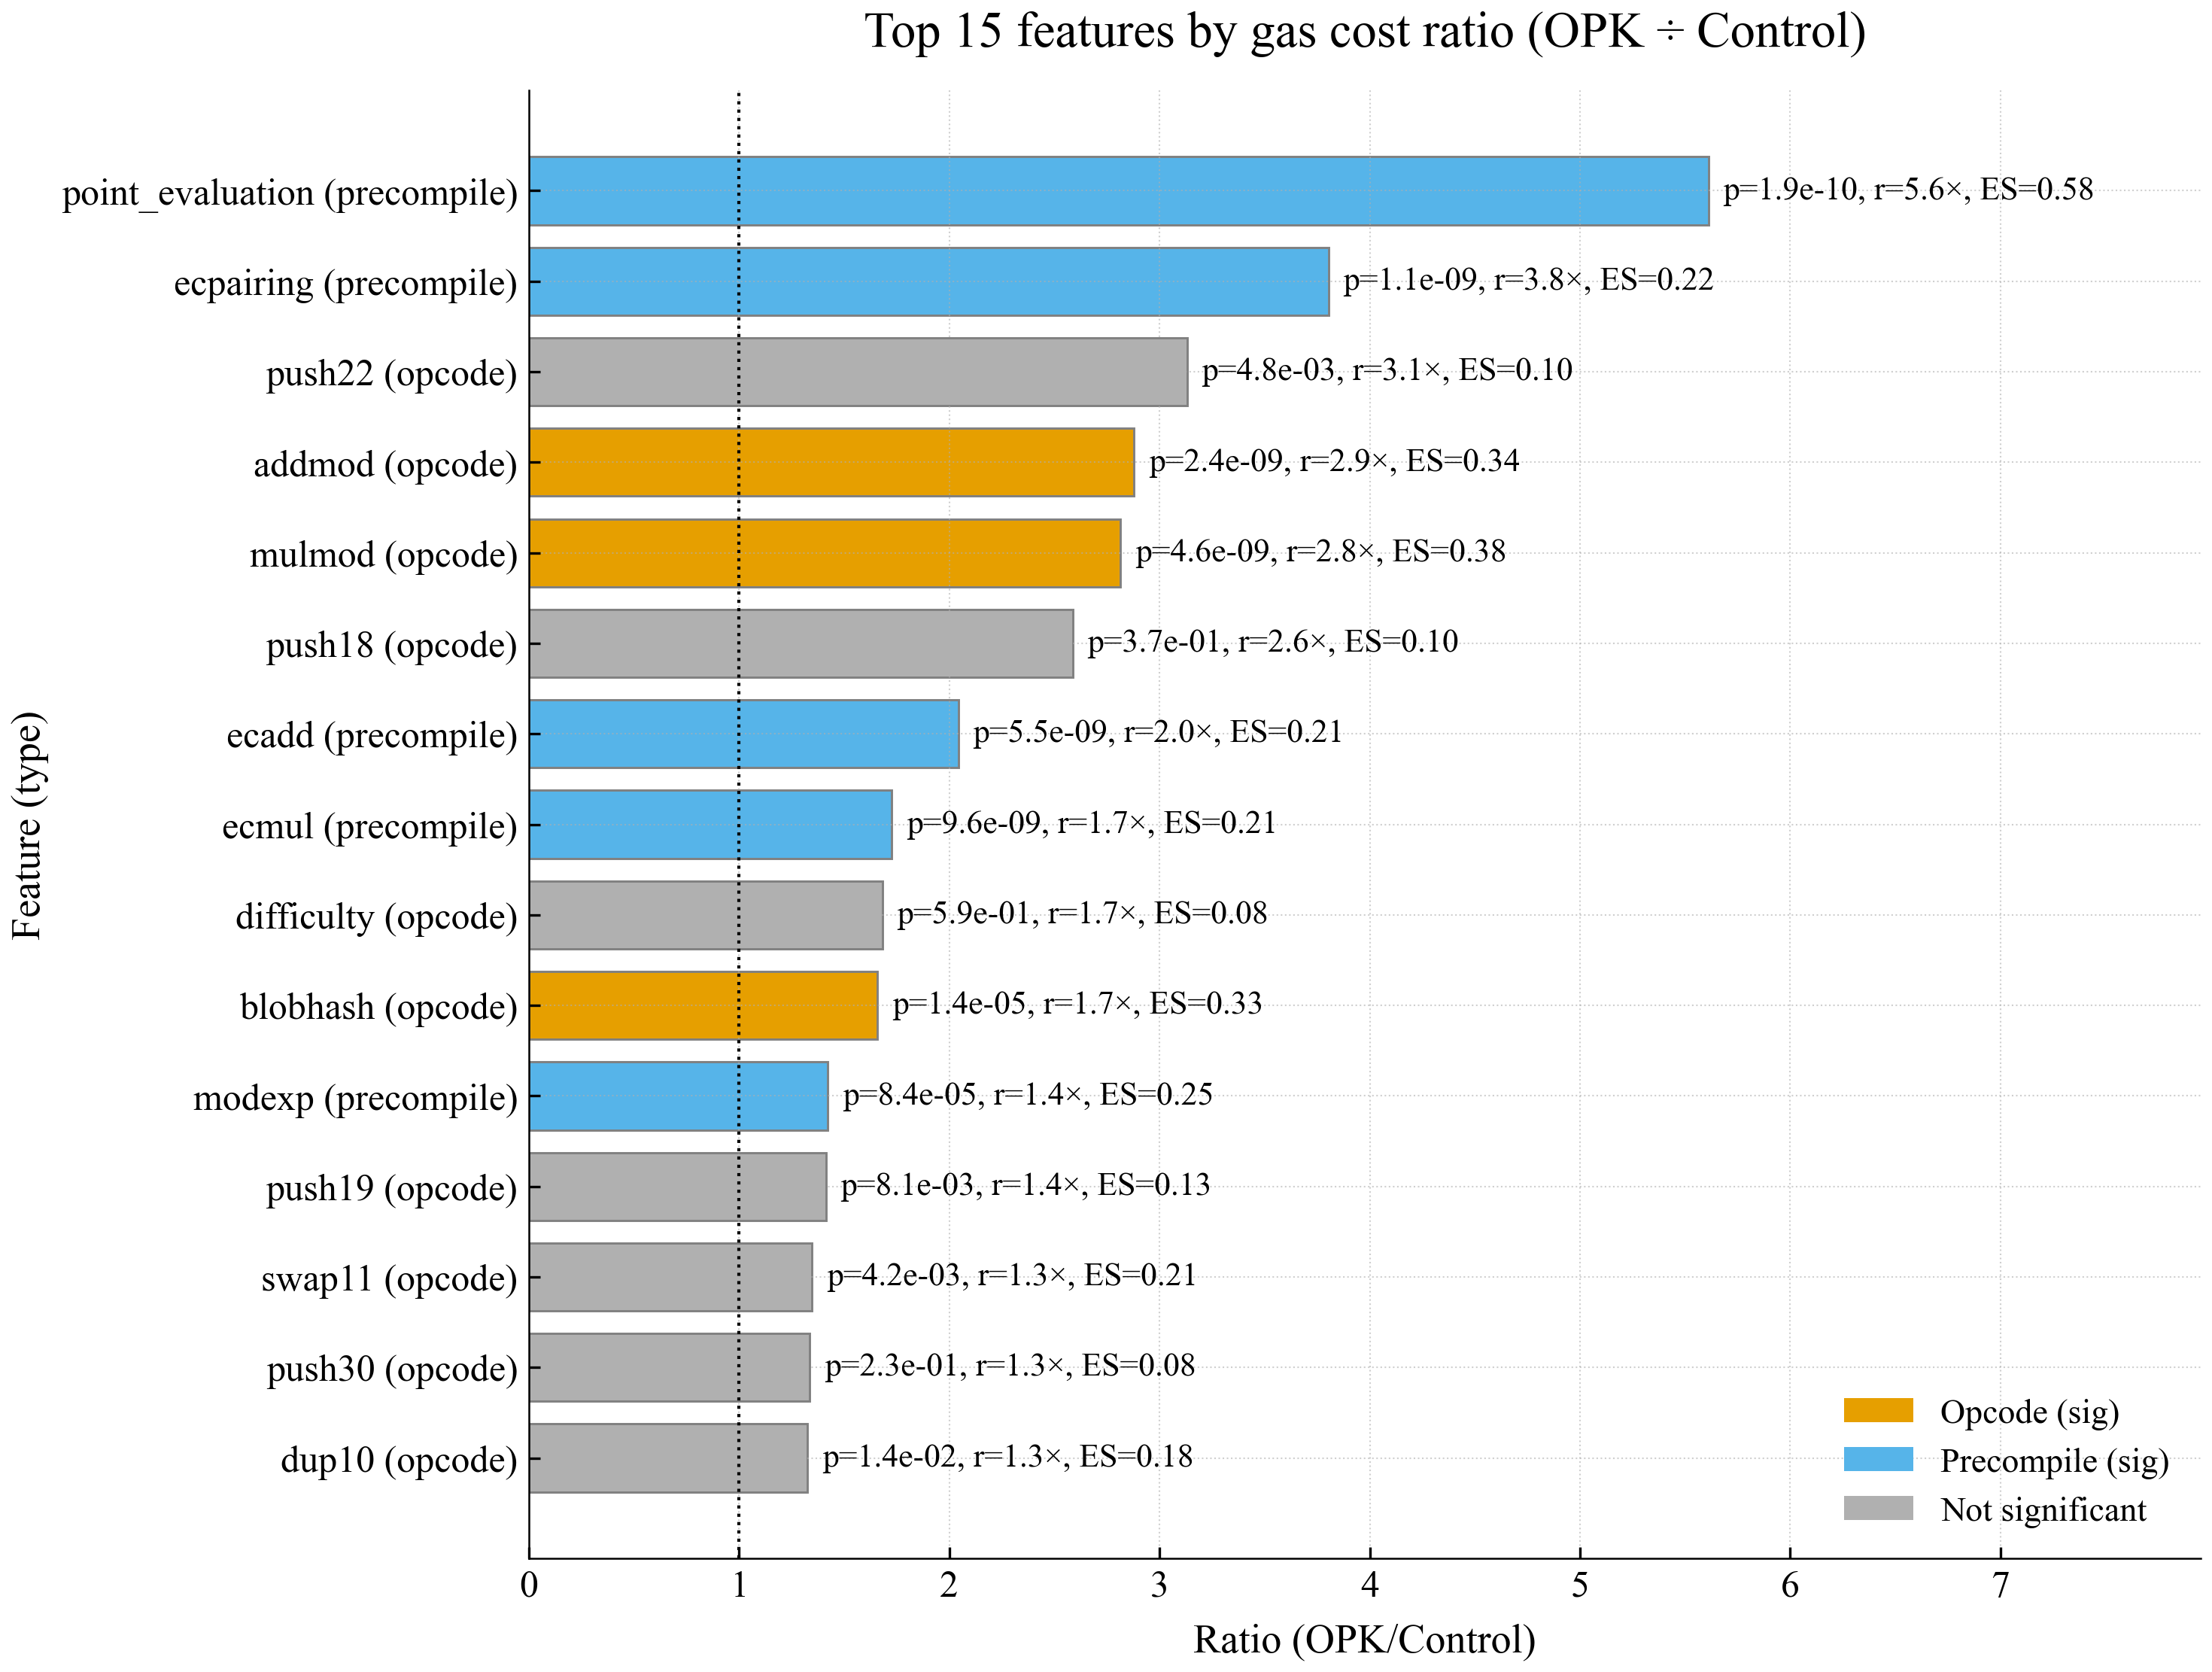
Figure 3. Bar chart displaying the top 15 features by gas‑cost ratio (OPK / Control) in OPK blocks relative to control blocks, ranked from highest to lowest. Bars represent the mean gas‑cost ratio, with colors indicating statistical significance (p < 0.0005): opcodes (orange), precompiles (blue), and non-significant features (gray). Data labels include p-value, ratio, and effect size (Cohen’s d).
Proving overhead over time
Next, we examined the temporal dynamics of the proving-time ratio between OPK blocks and matched controls for each prover team. Figure 4 shows that all teams consistently remain above the parity line (ratio = 1), typically between 2× and 4×, indicating that OPK blocks impose a steady overhead rather than representing occasional outliers. Interestingly, over the past month, each team’s curve has begun to trend downward, suggesting that prover-side optimizations may be taking effect, though additional data will be needed to confirm whether this trend persists.
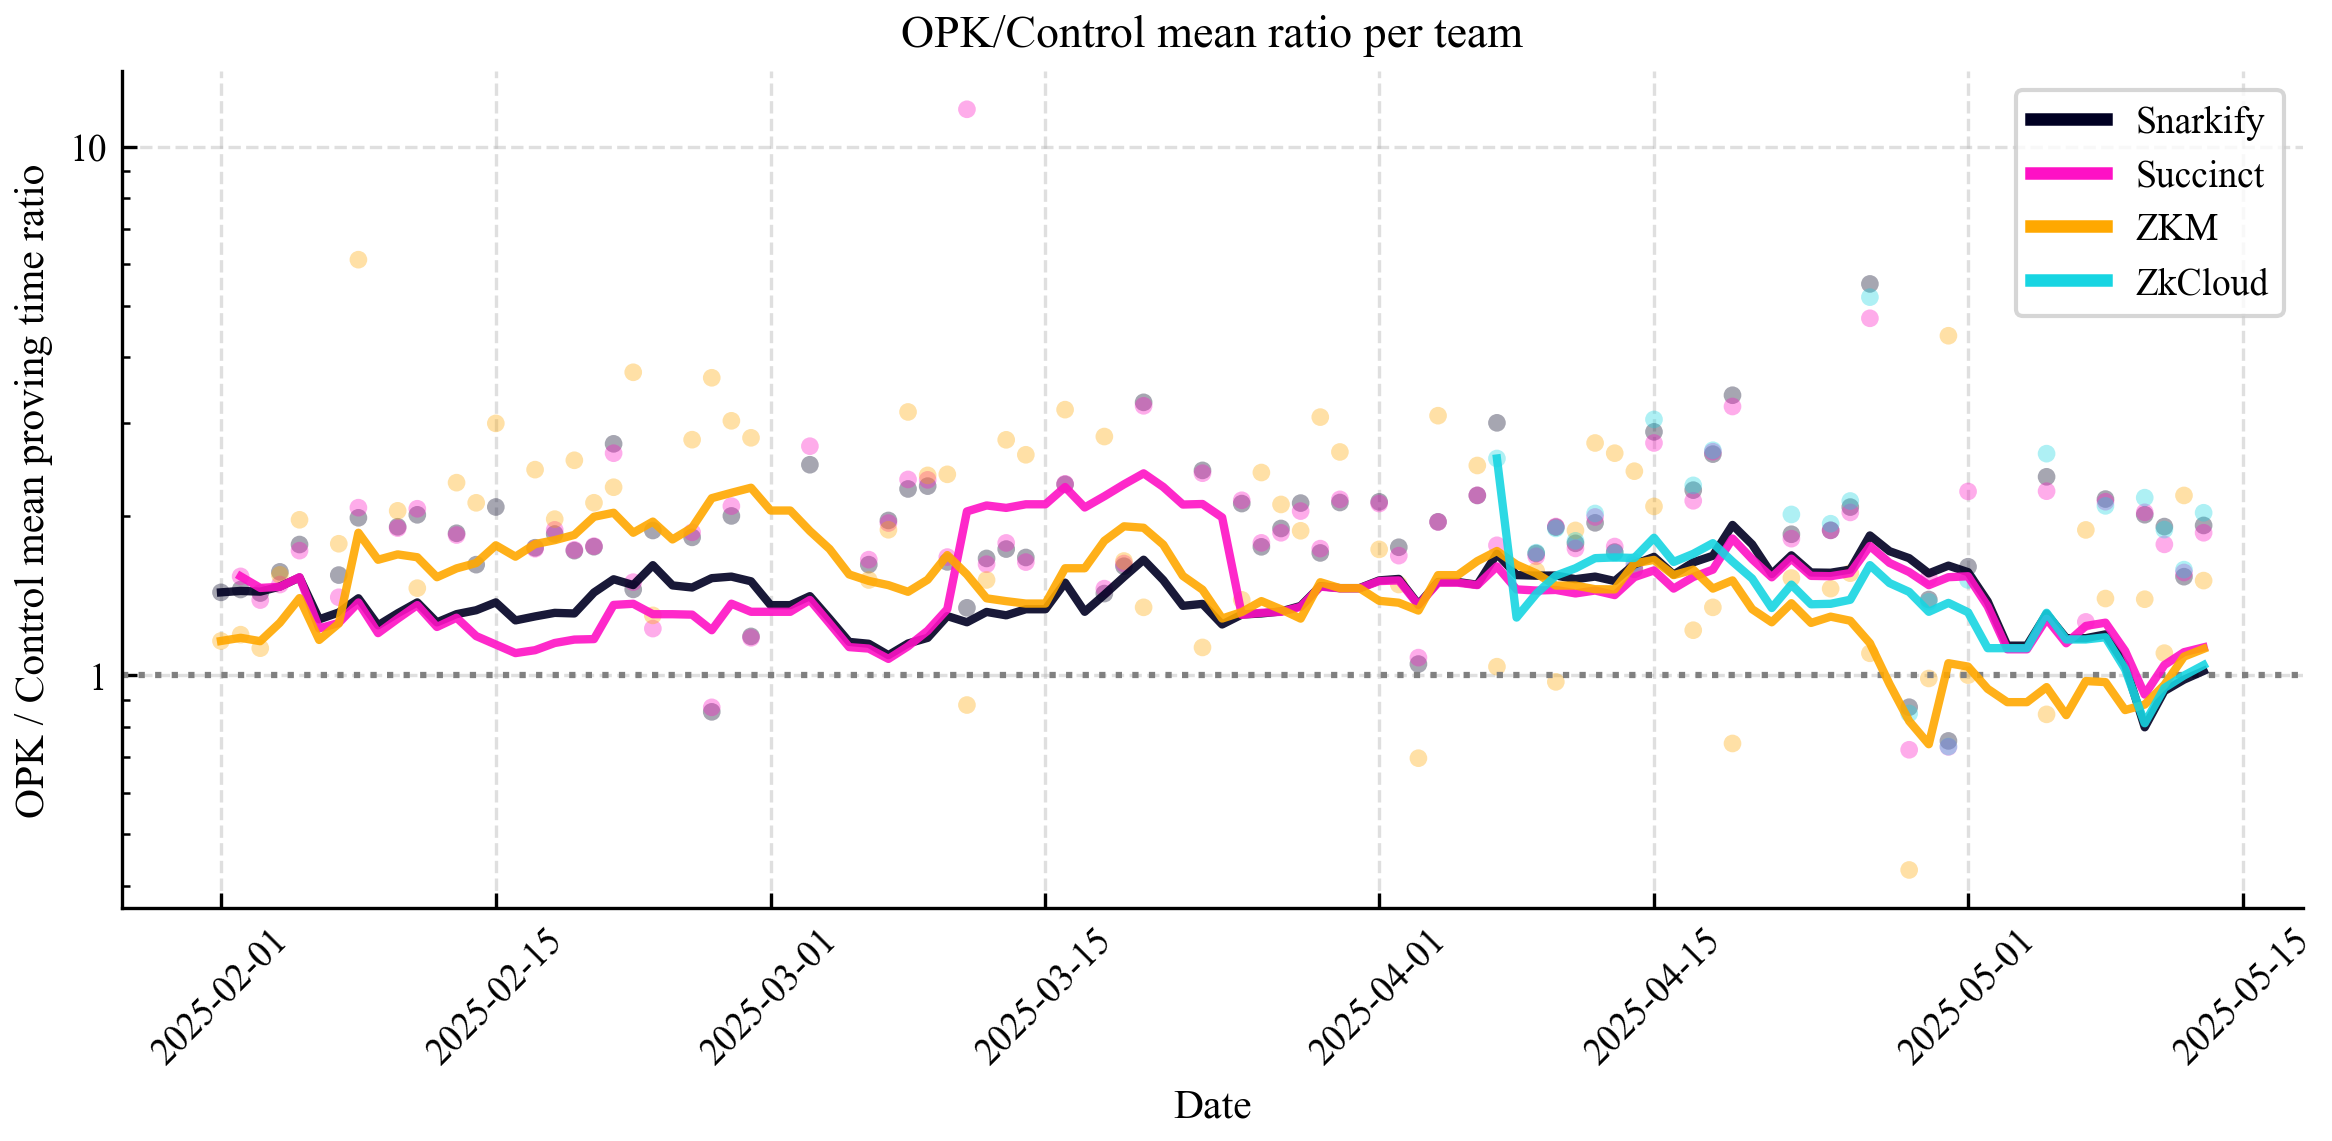
Figure 4 . Daily OPK / Control proving-time ratio by prover team. Faint dots represent each team’s daily ratio; solid curves show 14-day moving averages. The dashed horizontal line at y = 1 denotes parity (OPK and control blocks proving in equal time)
Potential Repricing Factors
Our analysis reveals that OPK blocks allocate a much larger share of their gas to a small set of EVM operations (Figure 3), resulting in higher proving times (Figure 4), and indicating under-pricing.
To guide repricing efforts, we can use gas-cost ratios as an initial signal. For example, point_evaluation registers a gas-cost ratio of about 5.6×, indicating its fee underestimates its true proving burden. MULMOD, ADDMOD, ecAdd, ecMul, and ecPairing show similarly high gas-cost ratios and are therefore prime candidates for repricing. However, these results are preliminary and should be further validated through thorough benchmarking analyses to avoid over-penalizing average blocks while effectively addressing worst-case scenarios.
Discussion
In this post, we analyzed organic prover-killer (OPK) blocks with real mainnet transactions where proving times significantly exceeded expectations based on gas usage (Figure 2). This highlights that proving complexity is not just determined by the amount of gas consumed but also by which specific operations are responsible for that consumption.
We then used statistical analyses (Figures 3) to show that specific EVM operations are overrepresented in OPK blocks in gas costs. Specifically, complex arithmetic operations (MULMOD, ADDMOD) and cryptographic precompiles (ecPairing, point_evaluation, modexp) appeared more frequently and consumed disproportionately high gas in OPKs. This finding aligns with the expectation that operations involving large field arithmetic and elliptic curve pairings impose significant computational burdens on ZK provers, and the high gas-to-proving-time ratios suggest that current gas pricing may not adequately reflect the true proving cost of these operations.
Several limitations should be considered:
- Data Scope: The findings are specific to zkEVMs currently posting data on ethproofs.org. Further analysis will be necessary as more zkEVM proofs become available to validate these observations.
- Causality and Broader Patterns: Statistical correlations do not imply direct causation. The opcode prevalence in OPKs may reflect broader usage patterns rather than isolated proving inefficiencies.
- Repricing Considerations: With multiple zkVMs contributing to the dataset, a critical question arises: how should gas repricing be determined given varying proving performance? Should it align with the fastest zkVM, the slowest, or perhaps a median representative from the top 5?
Addressing these considerations will be crucial in refining gas costs in zkEVM contexts, identifying operations that impose a higher proving burden than their current pricing suggests, and designing targeted prover-killer blocks for focused benchmarking.