This paper is authored by the MEV-X research team together with academic collaborators from MIPT, HSE University, and Skoltech.
This paper formalizes the MEV opportunity attribution problem: given an executed atomic arbitrage transaction T_{arb} that extracts profit \Pi, which preceding transaction created the price disbalance enabling that profit? We design and evaluate four attribution methods (bot-data-driven, simulation-based, coefficient-based, and Shapley-based) and apply them to 360,026 atomic arbitrage events on Polygon (March 2026, $334,799 in extracted value). Central finding: 96.7% of atomic arbitrage opportunities trace back to a single source transaction, consistent with the hypothesis that in competitive MEV markets, searchers extract value immediately when opportunities arise rather than waiting for multi-transaction sequences. MEV creation is highly concentrated: a small subset of protocols accounts for most opportunities, and concentrated-liquidity AMMs dominate despite not having the highest trading volume.
arXiv: 2604.27979
TLDR
-
The MEV literature has focused on extraction: how value is captured. The creation side - which on-chain transactions generate the conditions bots exploit - has no systematic treatment. We formalize it and build tooling to attribute it at scale.
-
We define a value distribution \{\phi_i\} over candidate source transactions satisfying \sum_{T_i \in C} \phi_i + \phi_{base} = \Pi, where \phi_{base} = \mathcal{M}(S_0, T_{arb}) is the profit attributable to pre-block state. EVM determinism makes this tractable: replaying a block without a candidate transaction yields an exact counterfactual, not a statistical estimate.
-
Single-source hypothesis validated: 96.7% of arbitrage events have one transaction accounting for >70% of positive Shapley value. Only 83 events (3.3%) show genuinely tied multi-source attribution.
-
Four methods, different trade-offs: bot-data (94.2% accuracy vs triangulated ground truth, 38.4% coverage, 8 ms/event), simulation (91.7%, 99.1%, 12.3 ms/event), Shapley MC (ground truth, 2.1 s/event). The coefficient method achieves 77.2% agreement with simulation at 0.8 ms/event. Recommended workflow: coefficient for screening, simulation as primary, Shapley when methods disagree or multi-source attribution is suspected.
-
MEV creation is concentrated: the top 1% of arbitrageurs capture 80% of extracted value; the top 1% of opportunity-creating transactions generate a similar proportion of MEV opportunities. Uniswap V3 (58.0% of opportunity transactions), Algebra (29.6%), and Uniswap V4 (28.9%) lead, despite Uniswap V2 having higher overall trading volume.
-
New efficiency metric: each opportunity-creating transaction attracts only ~1.6 successfully executed arbitrage transactions on average, standard multi-bid practice, not excessive competition. This ratio is only measurable via attribution.
1. The attribution problem
MEV research has focused on extraction mechanisms: how searchers capture value through arbitrage, liquidations, and sandwich attacks, and on mitigation. The creation side is underspecified. Which transactions generate the conditions extractors exploit? Which protocols generate the most arbitrage opportunities? Which users unintentionally create value for bots?
Without attribution, these questions have no systematic answer. Existing work either measures aggregate extraction (Qin et al., 2022) or locates approximate sources by scanning preceding swaps (Torres et al., 2024), but neither quantifies individual causal contributions to extracted value.
We formalize the problem as follows. A block B is an ordered sequence (T_1, \ldots, T_n) with sequential state evolution S_k = \Sigma(S_{k-1}, T_k). Let \mathcal{M}(S, T_{arb}) be the profit from executing T_{arb} in state S. Total extracted profit is \Pi = \mathcal{M}(S_{k-1}, T_{arb}). The candidate source set is all transactions T_i preceding T_{arb} that interact with the same liquidity pools. We seek \phi_i for each candidate T_i satisfying:
where \phi_{base} is the profit attributable to pre-block state. A source transaction may precede T_{arb} within the same block or up to D = 100 earlier blocks.
The key property that makes this well-posed is determinism: EVM state transitions are fully reproducible from an archive node. “What would \Pi be had T_i not executed?” is computable, not estimated. This distinguishes blockchain attribution from systems attribution work that operates under probabilistic assumptions.
We focus on atomic arbitrage, formally defined following Vostrikov et al.: transactions with at least two swaps (N \geq 2), non-negative net balance change for each asset (\Delta(A) \geq 0), and positive profit after fees \tau and prioritization bids \beta (\text{Profit} = \sum_{A} \Delta(A) \cdot P(A) - \tau - \beta > 0). This is the most frequent and fully observable MEV category, with the entire causal chain contained in the on-chain record.
2. Four attribution methods
We implement four methods spanning the accuracy/cost spectrum. Simulation, coefficient, and Shapley are retrospective, they analyze finalized blocks. Bot-data operates in real time on pending transactions and is used as external validation rather than primary attribution.
2.1 Simulation-based attribution (primary)
Counterfactual replay to isolate the causal impact of specific transactions on arbitrage profitability. Three phases:
Phase 1 — Candidate filtering. Eliminate transactions that do not interact with any pool in the arbitrage route.
Phase 2 — Binary search for the edge transaction. Binary search identifies T_{edge}: the boundary beyond which the profit of T_{arb} drops to 5% of \Pi. The search begins within the current block and extends backwards up to D blocks. This gives O(\log |C|) simulations for this phase.
Phase 3 — Backward impact calculation. Traverse backwards from T_{arb} to T_{edge}, computing the marginal impact of each transaction:
where \Pi(T_i) is the profit available if T_{arb} were executed immediately after T_i. The source is the transaction with maximum positive impact, ties broken by proximity to T_{arb}:
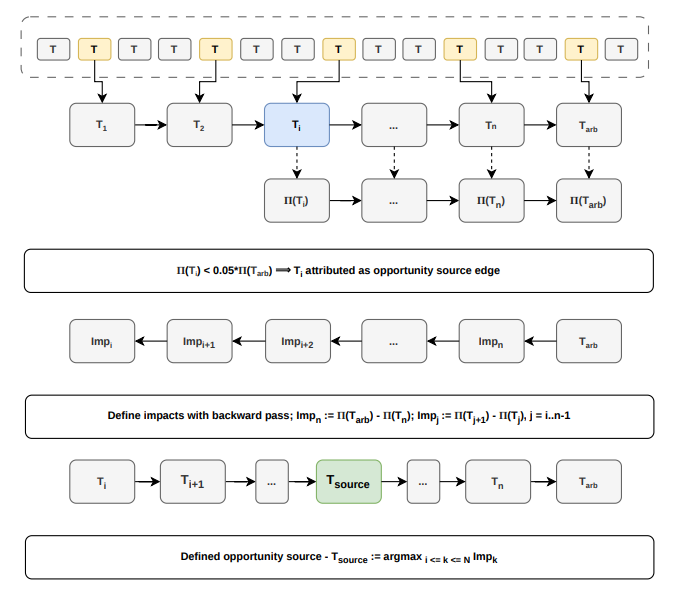
Simulation-based attribution pipeline. (1) Filter transactions by pool intersection (yellow). (2) Binary search backwards to find edge transaction 𝑇𝑒𝑑𝑔𝑒 where profit drops below 5% threshold (blue). (3) Compute marginal impacts via backward pass; select source transaction with maximum impact (green)
In our dataset, 99.3% of attributable opportunities have T_{edge} within 7 blocks of T_{arb}, making D = 100 a conservative bound.
2.2 Shapley-based attribution (ground truth)
Cooperative game theory applied to fair attribution when multiple transactions may jointly contribute. The candidate set C forms a cooperative game with value function V(S) = profit achievable after executing exactly the transactions in S. Shapley value:
This satisfies efficiency (\sum \phi_i = \Pi - \phi_{base}), symmetry, dummy, and additivity.
Exact computation is O(2^{|C|}), feasible only for |C| < 20. For |C| \geq 20, we use Monte Carlo: N random permutations of C, Shapley value estimated as the average marginal contribution. At N = 1000 samples, estimates stabilize within 5% of asymptotic values after approximately 500 samples.
2.3 Coefficient-based attribution (fast screening)
The K-value method: compute the price multiplier coefficient k representing theoretical profitability of the arbitrage cycle at infinitesimal size. Attribute the opportunity to the transaction maximizing the marginal coefficient change:
Requires only pool reserve data from transaction logs: O(1) per candidate, no archive node replay needed. Does not account for liquidity depth or slippage, degrades for large-volume opportunities. Suited for initial screening only.
2.4 Bot-data attribution (external validation)
Uses execution logs from production MEV searchers operated by the affiliated company as a proxy for ground truth. An RL agent (GNN encoder + MLP value head, trained via PPO on historical Polygon data, <10 ms inference) monitors pending transactions and, for each candidate T_i, computes the optimal arbitrage route and maximum bid yielding positive expected profit. When the bot submits a bid on a route triggered by T_i, this is interpreted as evidence that T_i was identified as the primary opportunity creator at submission time.
Coverage is limited to 38.4%: the bot’s real-time mempool visibility misses last-in-block arbitrage by design. Bot data reflects searcher intentions at submission time, not retrospective causal analysis of finalized blocks, which is why it serves as validation rather than primary attribution.
Note: the bot-data component relies on proprietary bidding infrastructure and will not be released as part of the open artifacts.
3. Empirical results
Datasets. Large-scale analysis: blocks 83,770,001–84,820,000 on Polygon, 360,026 atomic arbitrage events, $334,799 extracted (USD at execution-time oracle prices; internal computation in MATIC). Method comparison: blocks 82,546,747–82,567,395 (~12-hour window, February 4, 2026), 2,526 atomic arbitrage events, used for exhaustive Shapley computation and all four-method comparison. Ground truth coverage in the February dataset: bot consensus 38.4%, exact Shapley 12.0% (candidate sets with fewer than 20 transactions, where exact computation is feasible), 23% attributed to pre-block state (opportunities pre-existing before the block, accounting for less than 4% of total profit). Implementation: modified Geth archive node, Rust for performance-critical components, Python for statistical analysis; 32-core cluster (Intel Xeon Platinum, 128 GB RAM).
| Method | Metric | Coverage | Mean time/event |
|---|---|---|---|
| Bot-data | 94.2% accuracy* | 38.4% | 8 ms |
| Simulation | 91.7% accuracy* | 99.1% | 12.3 ms |
| Coefficient | 77.2% agreement with simulation** | 88.4% | 0.8 ms |
| Shapley (exact) | 100% accuracy* | 98.1% | ~5 min |
| Shapley (MC, 1k) | 100% accuracy* | 98.1% | 2.1 s |
*Accuracy measured against triangulated ground truth (bot consensus + exact Shapley + manual review of 200 stratified events).
**Not evaluated independently against ground truth; measured as agreement with simulation output.
Simulation processed the full March 2026 dataset (360,026 events) in ~80 hours, consistent with 12.3 ms/event.
3.1 Shapley case study: block 82,563,006
Figure shows Shapley attribution for a representative event. Four candidate transactions interact with the arbitrage route: a non-arbitrage swap (index 129), two competing arbitrageurs (indices 130, 168), and the executed arbitrage (index 199). The non-arbitrage swap at index 129 receives the largest positive attribution: +32.58 MATIC, it created the price disbalance. The competing arbitrageurs receive negative Shapley values: positive values indicate opportunity creation; negative values indicate profit consumption by competing arbitrageurs.
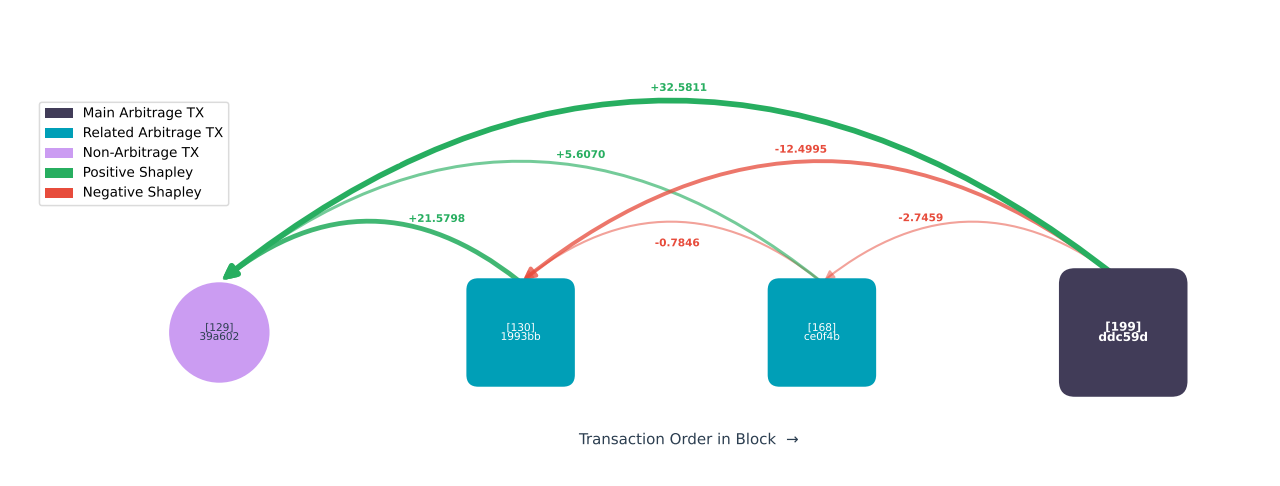
Shapley attribution for an arbitrage event (block 82,563,006). Positive values indicate opportunity creation; negative values indicate profit consumption by competing arbitrageurs. The non-arbitrage transaction at index 129 is the primary source (+32.58 MATIC).
3.2 Monte Carlo convergence
For |C| \geq 20, exact Shapley is computationally intractable. Figure shows convergence for transaction 0xb1f2a5bb... in block 82,554,874, which has 16 candidates (|C| < 20, so exact values are available and shown as dashed lines). Four representative candidates with varying Shapley values: one near-zero, one exactly zero, two negative. Estimates stabilize within 5% of exact values after approximately 500 samples, validating the default of 1,000 samples.
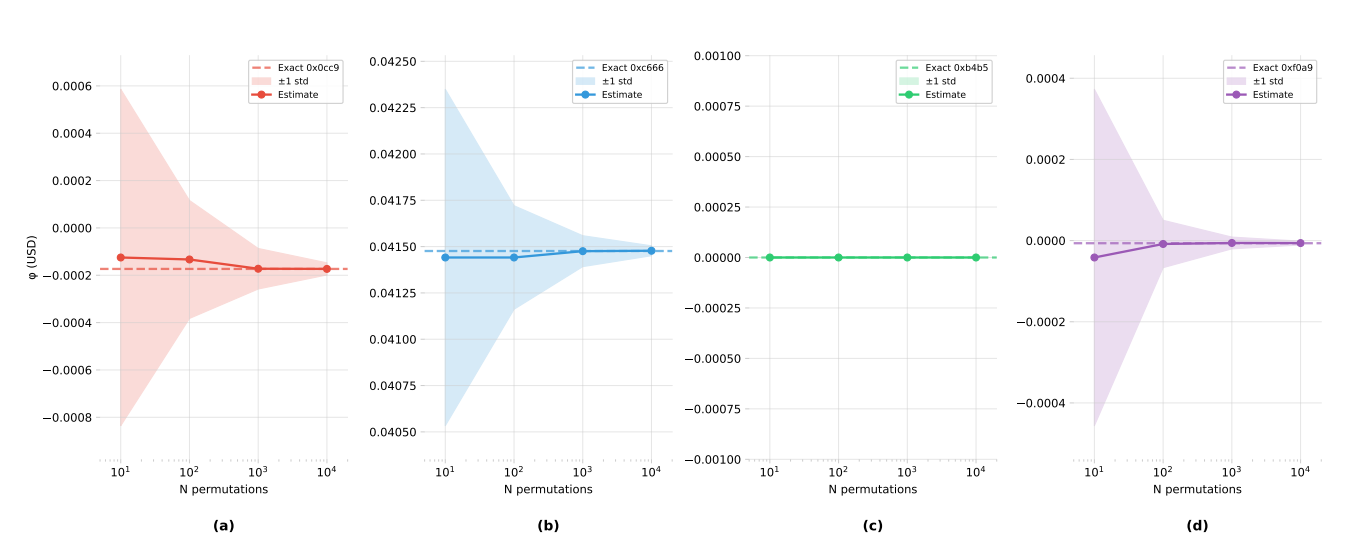
Monte Carlo Shapley convergence for transaction 0xb1f2a5bb.. (block 82,554,874). Four subplots show convergence for candidates with varying Shapley values (one near-zero, one exactly zero, two negative). Exact Shapley values shown as horizontal dashed lines; Monte Carlo estimates (mean ±1 std over 100 runs) shown as points with shaded regions. Estimates stabilize within 5% after ∼500 samples.
3.3 Single-source hypothesis
Figure shows a complex case from the same block (transaction 0xb1f2a5bb, block 82,554,874): 17 transactions with non-zero Shapley values, including the arbitrage transaction itself. Attribution is still dominated by a single source.
Across the February 2026 dataset (2,526 events): 83 events (3.3%) exhibit tied maximum Shapley values indicating genuine multi-source creation. Among these, 71 have 2 tied sources, 8 have 3, and 2 events have 4 or 6 tied sources. 42 of 83 (50.6%) are “blind” last-in-block arbitrage where all positive contributors share equal Shapley values; the remaining 33 involve cascades of interdependent arbitrageurs. For the dominant 96.7% single-source cases, one transaction accounts for >70% of total positive Shapley value.
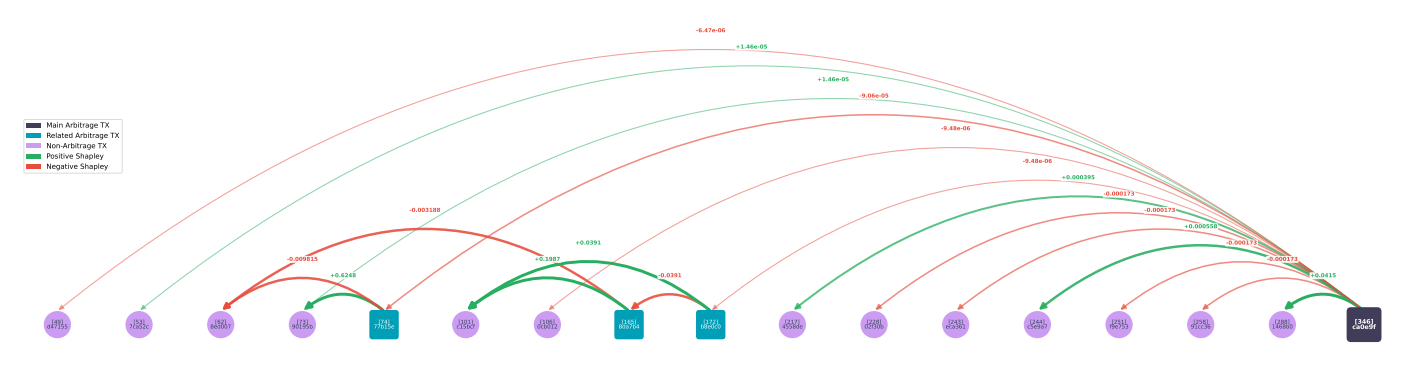
Shapley attribution for complex arbitrage (block 82,554,874, transaction 0xb1f2a5bb..). Seventeen transactions connected by non-zero Shapley values. Despite multiple participants, attribution remains dominated by a single source
3.4 Concentration and protocol distribution
Concentration (February 2026 dataset, Figure 6): the top 1% of arbitrageurs capture 80% of extracted value; the top 1% of opportunity-creating transactions generate a similar proportion of MEV opportunities. Each opportunity-creating transaction attracts only ~1.6 successfully executed arbitrage transactions on average, reflecting standard multi-bid practice rather than excessive competition. This ratio is only measurable via attribution.
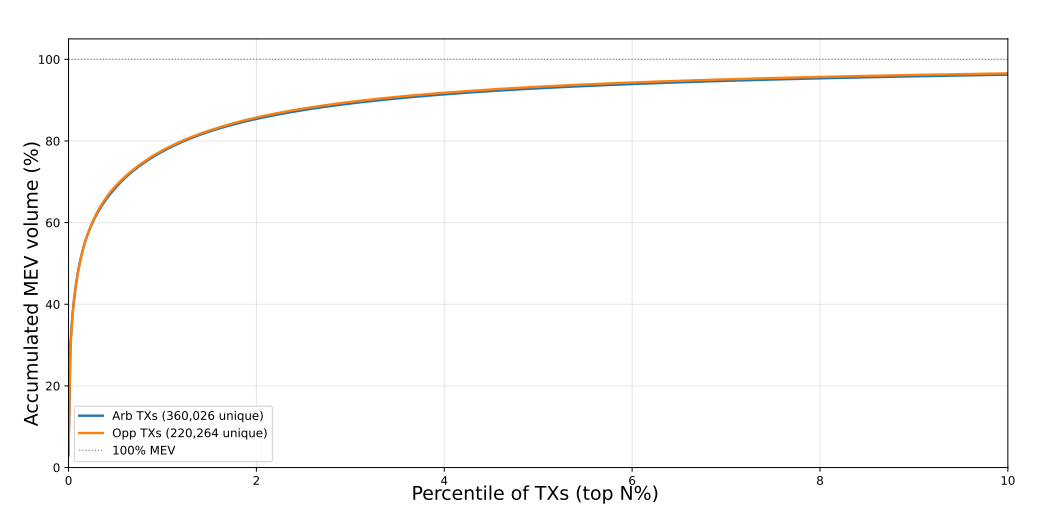
MEV concentration: accumulated MEV value by percentile of top arbitrageurs (blue) vs. opportunity-creating transactions (orange). Top 1% of each group accounts for 80% of extracted value, yet the executed arbitrage-to-opportunity ratio remains ∼1.6:1. Analysis based on 220,262 opportunitycreating transactions from February 2026 dataset.
Protocol distribution (February 2026 comparison dataset, 220,262 opportunity-creating transactions): 96.5% involve identifiable AMMs across 18 unique protocols. Participation frequencies sum >100% because individual transactions often interact with multiple AMMs:
| Protocol | Participation frequency |
|---|---|
| Uniswap V3 | 58.0% |
| Algebra | 29.6% |
| Uniswap V4 | 28.9% |
| Uniswap V2 | 23.2% |
| DODO | 8.2% |
Uniswap V3 and Algebra lead despite Uniswap V2 having higher overall trading volume. The paper notes that concentrated liquidity mechanisms, “while capital-efficient, create more frequent price disbalances exploitable by arbitrageurs.”
23% of events in the validation dataset are attributed to pre-block state: the opportunity pre-existed at block start and was not created by any in-block transaction in the search window. These account for <4% of total extracted profit.
4. Design implications
Protocol designers. Attribution identifies which protocols generate the most MEV leakage. The data shows that concentrated liquidity mechanisms, while capital-efficient, create more frequent exploitable disbalances, a concrete per-protocol signal for MEV risk.
Validators. Transaction ordering policy has been analyzed from the extractor’s perspective. Attribution adds the creator’s: a transaction creating a large attributable opportunity imposes a measurable externality on other users. The paper suggests ordering policies could account for opportunity creation to reduce aggregate MEV leakage.
MEV risk assessment. The ~1.6:1 executed arbitrage-to-opportunity ratio, measurable via attribution, provides a per-protocol observable for evaluating competitive intensity and market efficiency over time.
5. Limitations
Three primary limitations stated in the paper: (1) ground truth relies on triangulation rather than direct observation, causal relationships are not directly observable on-chain, introducing potential bias if validation sources share systematic errors; (2) evaluation is limited to Polygon (February–March 2026) network-specific factors (block time, searcher competition, gas pricing) may affect attribution dynamics on other chains; (3) scope is limited to atomic arbitrage, liquidations, sandwich attacks, and top-of-block opportunities have distinct causal structures requiring adapted models.
Future directions: real-time attribution, extension to other MEV categories, multi-chain comparison including Ethereum mainnet and L2s, attribution-aware ordering protocols.
Full paper: arXiv:2604.27979.
Authors: Andrei Seoev (MEV-X), Dmitry Belousov (MIPT), Anastasiia Smirnova (MEV-X), Ksenia Kurinova (MIPT), Aleksei Smirnov (MEV-X), Denis Fedyanin (HSE University), Yury Yanovich (Skoltech). Submitted to SIGCOMM’26.