There’s a much better way to visualize this article (with dynamic figures that explain some of the conceptual stuff and benchmark results visually clearer. If you prefer it, check it at: Binary Trie Group-Depth Benchmark — Narrower Than Expected
S1 – Executive Summary
The binary trie is on the Ethereum protocol strawman as a future state tree replacement. No binary trie implementation has been benchmarked at scale – not group depth, not anything else. With this transition on the roadmap, assessing performance characteristics is a prerequisite for informed prototyping. The geth implementation (EIP-7864) exposes a --bintrie.groupdepth parameter that controls how binary levels are packed into on-disk nodes; this study benchmarks eight configurations to determine the optimal setting.
Bottom line: The sweet spot is GD-5 or GD-6, depending on workload. GD-5 wins writes by 7% over GD-4 (6.94 vs 6.47 Mgas/s, p \lt 1e-9). GD-6 leads reads (6.39 Mgas/s) and mixed workloads (+19% over GD-4, p \lt 1e-3). GD-7 confirms performance degrades past GD-6.
What we tested
Eight group-depth configurations (GD-1 through GD-8) on identical 360 GB databases with ~400 million state entries. Five benchmark types – two synthetic (raw SLOAD/SSTORE) and three ERC20 contract workloads – each run 9 times under a cold-cache protocol. All results use medians with Mann-Whitney U significance tests.
What we found
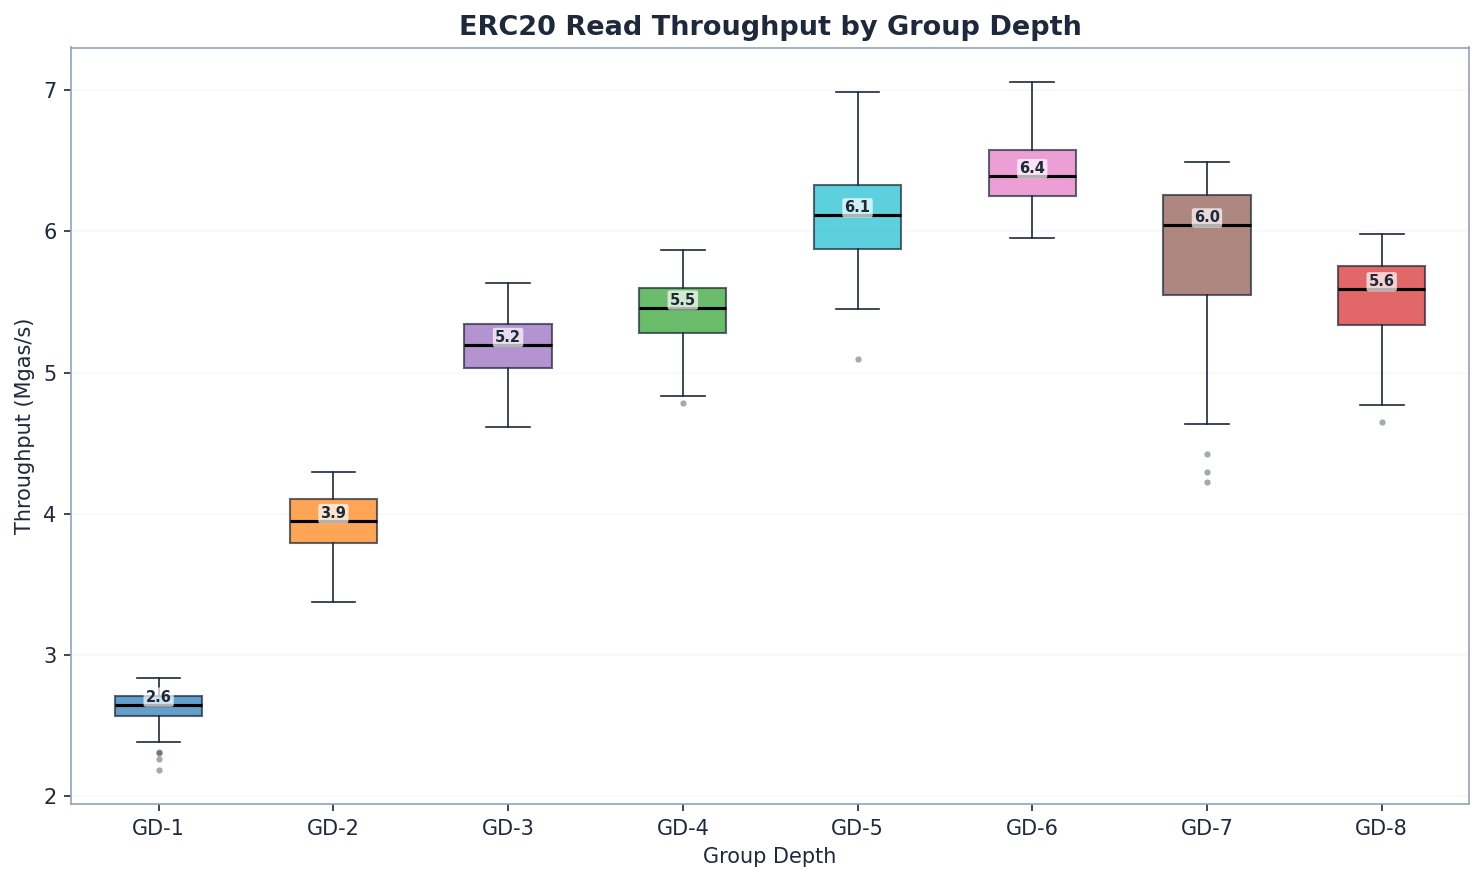
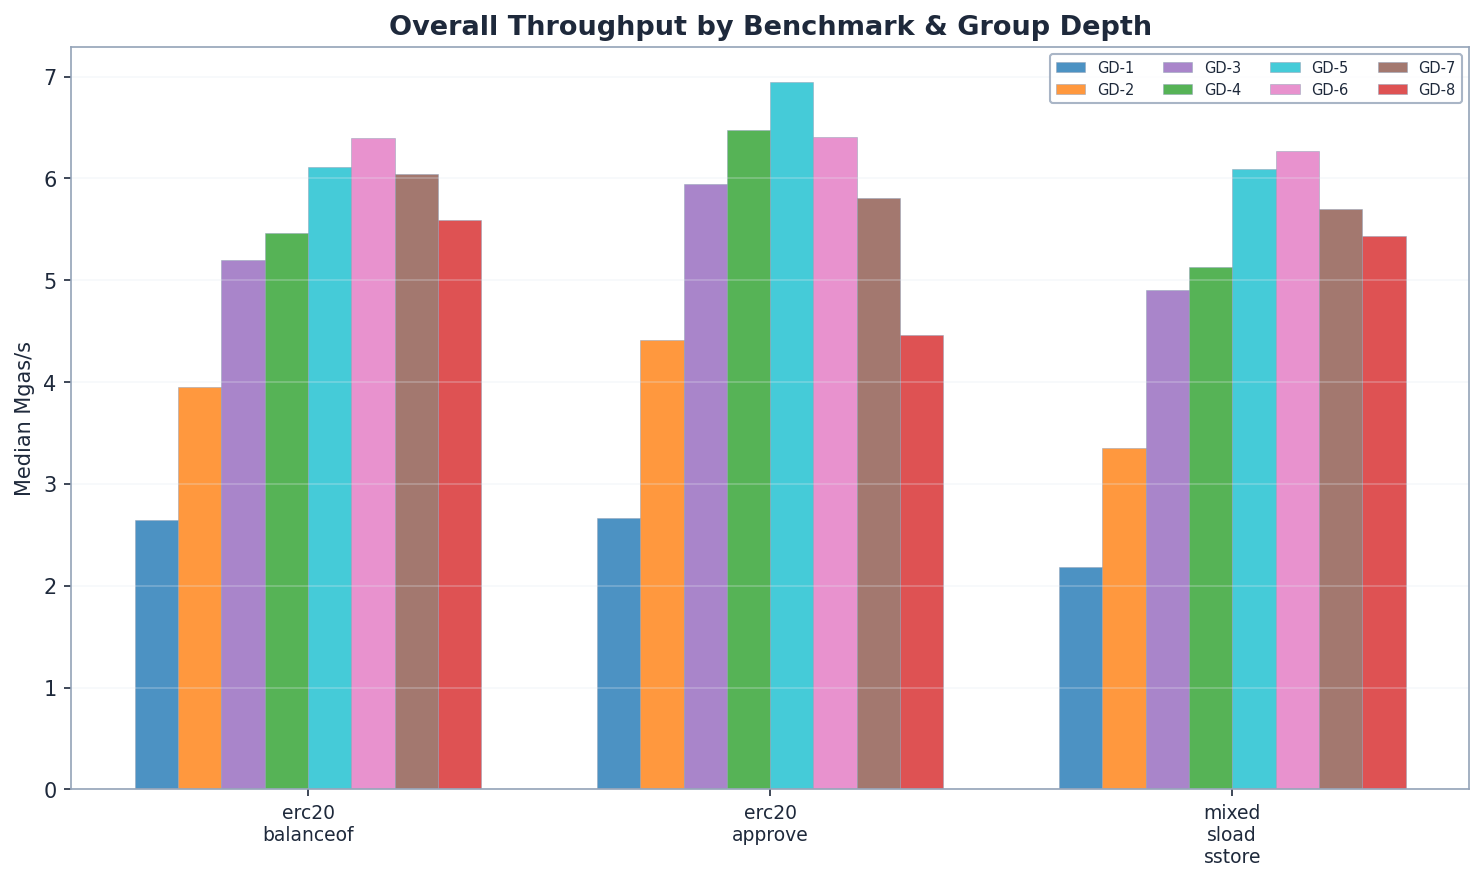
- Reads confirm the intuition (Section 4): Wider trees read faster. GD-8 achieves more than double the read throughput of GD-1 (5.59 vs 2.65 Mgas/s). GD-6 achieves the highest read throughput (6.39 Mgas/s), followed by GD-5 (6.11) and GD-7 (6.04). GD-3 through GD-8 range from 5.2 to 6.4 Mgas/s by throughput.
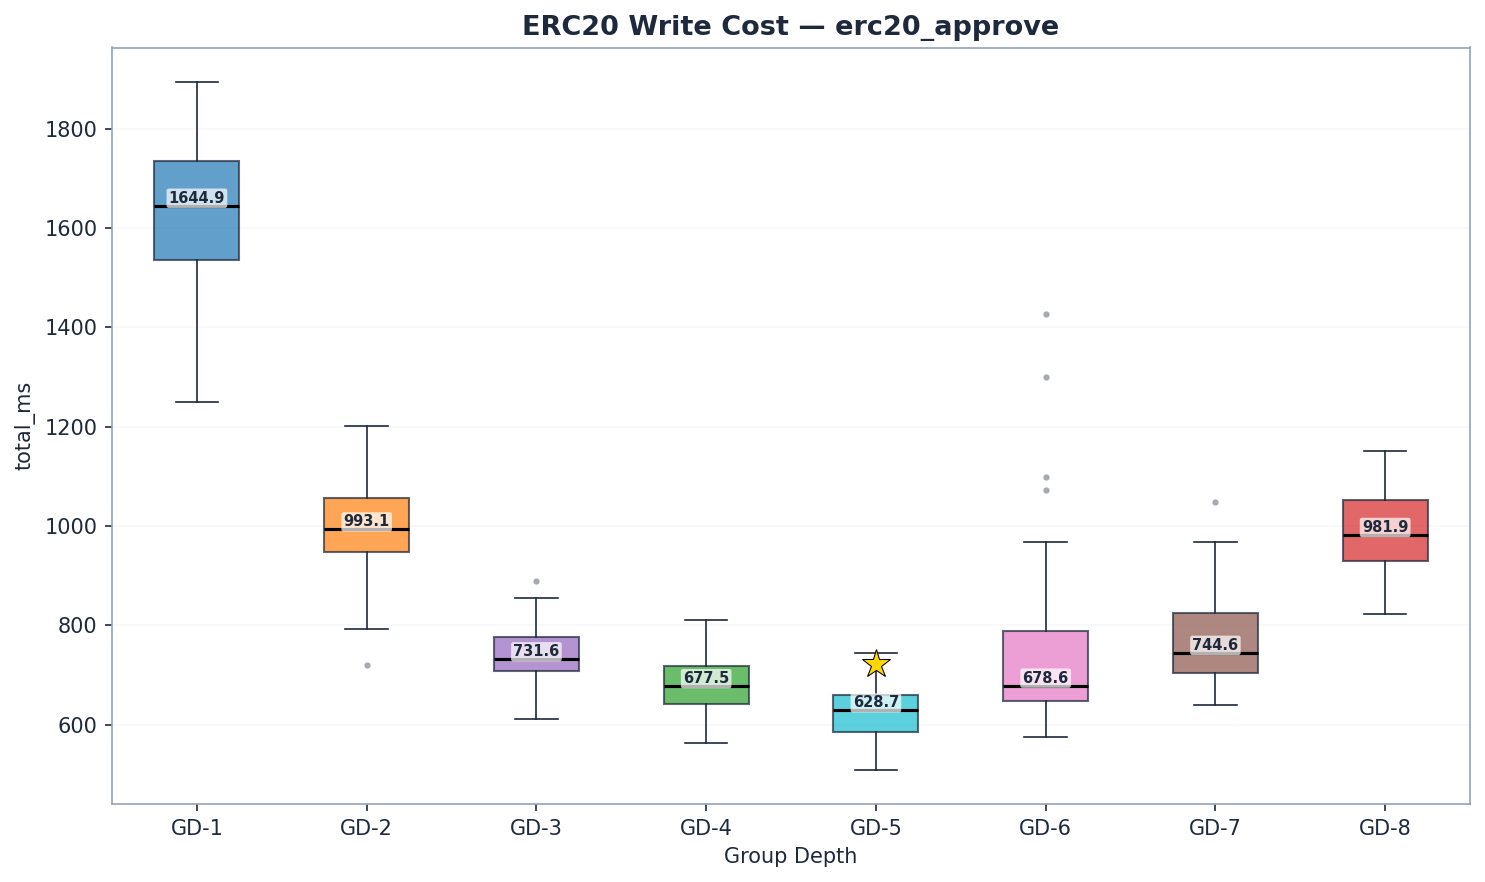
- Writes reveal a sharper optimum (Section 5): GD-5 is the write champion at 629 ms (6.94 Mgas/s) – 7% faster than GD-4 (678 ms, 6.47 Mgas/s) and 55% faster than GD-8 (982 ms, 4.47 Mgas/s). The write inflection lies between GD-5 and GD-6 (hash/read ratio crosses 1.0).
- Node size hits the Pebble block boundary at GD-7 (Section 5): Each GD-7 node serializes to ~4 KB (128 × 32 bytes) – exactly the Pebble block size. Below this boundary (GD-6: ~2 KB), each node fits within one block. Above it, reads may require two blocks per node. Gary Rong’s NVMe benchmarks show random 8 KB reads cost 54% more latency than 4 KB at QD=1 (77.8 vs 50.6 µs). This per-node I/O penalty compounds across ~37 path nodes, explaining why GD-7 reads slower than GD-6 despite a shorter path.
- The sweet spot is GD-5 or GD-6 (Section 6): GD-5 wins writes by 7% over GD-4, while GD-6 leads reads (+5% over GD-5) and mixed workloads (+19% over GD-4). GD-7 confirms the inflection – worse than GD-6 on all benchmarks. Since Ethereum is read-heavy, GD-6 may be the preferred default.
How to read this post
- Section 2 (Background) covers the binary trie and group depth concept.
- Section 3 (Methodology) details the benchmark setup.
- Sections 4–6 present the results in a narrative arc: reads, writes, then the trade-off.
- Section 7 (Patterns) examines cross-cutting observations.
- Section 8 (Conclusions) gives the dual recommendation and open questions.
Short on time? Start with Section 4’s “ERC20 Reads: Where Depth Matters” – it’s the section where group depth differences become most visible and sets up the rest of the analysis.
S2 – Background
What is the Binary Trie?
EIP-7864 proposes replacing Ethereum’s Merkle Patricia Trie (MPT) with a binary trie. The binary trie unifies the account trie and all storage tries into a single tree, uses SHA-256 for hashing instead of Keccak-256, and stores 32-byte stems that map to groups of 256 values. This design simplifies witness generation for stateless clients and enables more efficient proofs.
The transition from MPT to a binary trie is one of the most consequential changes to Ethereum’s state layer. Performance characteristics of the new structure will directly affect block processing time, sync speed, and validator economics.
What is Group Depth?
The trie is always binary at the fundamental level – every internal node has exactly two children (left for bit 0, right for bit 1). Group depth controls how many binary levels are bundled into a single on-disk node. At GD-N, each stored node encapsulates an N-level binary subtree, so it appears to have 2^N children when viewed from the outside:
- GD-1: 1 binary level per node → 2 child pointers, 256 nodes on the path to a leaf
- GD-2: 2 binary levels per node → 4 child pointers, 128 nodes on path
- GD-3: 3 binary levels per node → 8 child pointers, ~86 nodes on path
- GD-4: 4 binary levels per node → 16 child pointers, 64 nodes on path
- GD-5: 5 binary levels per node → 32 child pointers, ~52 nodes on path
- GD-6: 6 binary levels per node → 64 child pointers, ~43 nodes on path
- GD-7: 7 binary levels per node → 128 child pointers, ~37 nodes on path
- GD-8: 8 binary levels per node → 256 child pointers, 32 nodes on path
Think of it like a zip code: GD-1 reads your address one digit at a time (256 steps), while GD-8 reads 8 digits at once (32 steps). Fewer steps means fewer disk reads – but each “bundled node” is larger and more expensive to update, because the binary subtree inside it must be rehashed.
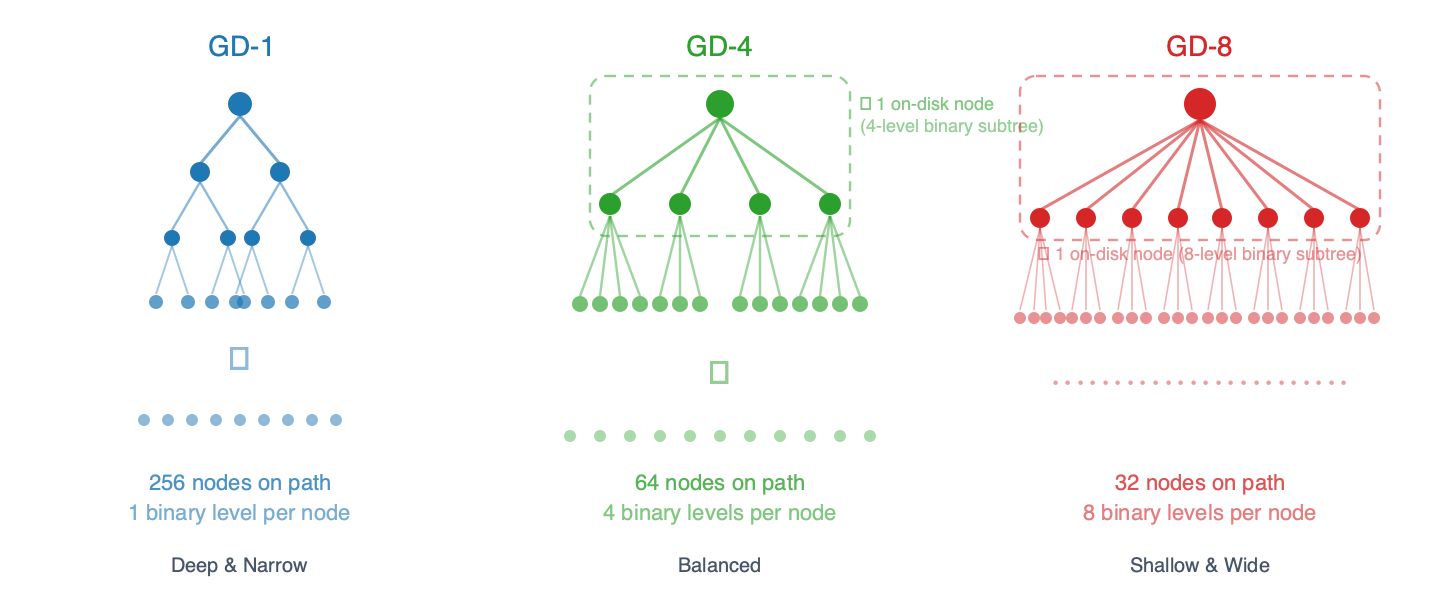
Figure 1 – Tree shape at different group depths. Each node bundles N binary levels internally, reducing the number of on-disk nodes on the path to a leaf.
The trade-off is straightforward in theory: reads benefit from shallow trees (fewer disk I/O operations to reach a leaf), while writes suffer from wide nodes (more internal hashing when a node is modified). The question is where the crossover point lies.
S3 – Methodology
Summary
Benchmark Setup
| Parameter | Value |
|---|---|
| Machine | QEMU VM – 8 vCPUs, 30 GB RAM, 3.9 TB SSD, Ubuntu 24.04 LTS |
| Database | ~360 GB, ~400M accounts + storage slots |
| Configurations | GD-1, GD-2, GD-3, GD-4, GD-5, GD-6, GD-7, GD-8 (Pebble, the LSM-tree storage engine used by geth, 4KB block size) |
| Protocol | Cold cache (OS page cache dropped + Pebble cache=0 between runs) |
| Runs | 10 per benchmark per config; run 1 excluded (residual warmth) |
| Gas target | 100M gas per block |
Statistical Approach
- Per-run block medians aggregated across 9 retained runs
- Mann-Whitney U test for pairwise comparisons (non-parametric)
- Effect sizes reported as percentage difference from baseline (GD-1)
- Coefficient of variation (CV%) for consistency assessment
Benchmark Taxonomy
a) Synthetic benchmarks – sstore_variants (writes) and sload_benchmark (reads). These use EIP-7702 delegations with sequential storage slots. Keys are numerically sequential, causing heavy prefix sharing in the trie.
b) ERC20 benchmarks – balanceof (reads), approve (writes), and mixed. These use real ERC-20 contract code. Storage keys are keccak hashes of random addresses, producing uniformly distributed access patterns across the trie.
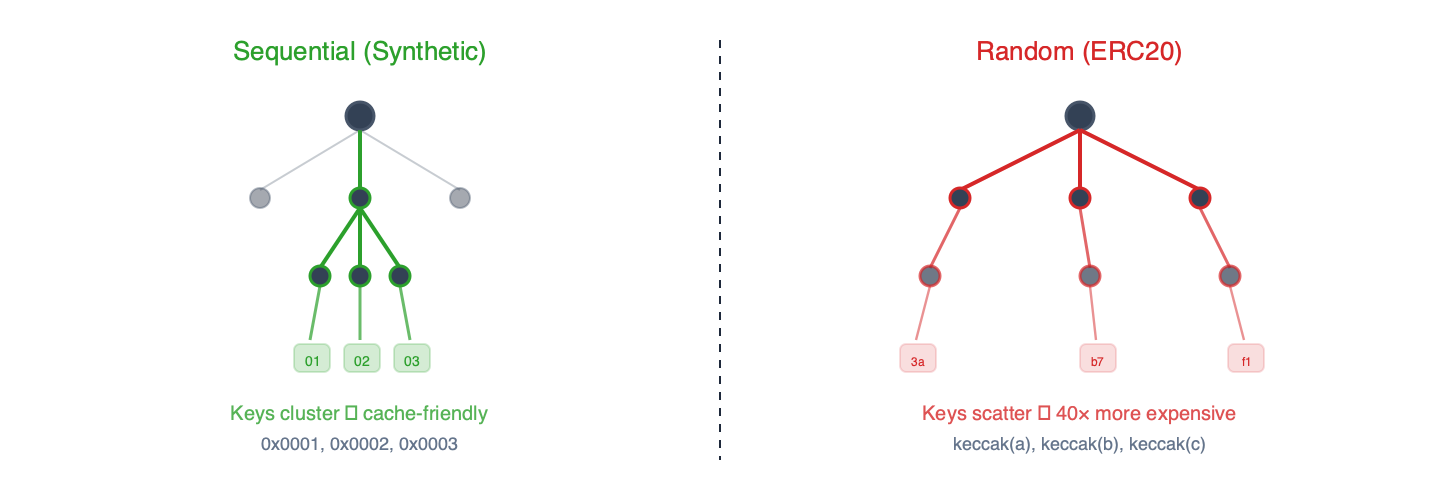
Figure 2 – Sequential keys share trie prefixes and benefit from caching. Keccak-hashed keys scatter uniformly, forcing cold reads at every level.
Block Composition Note
The execution-specs harness sends all benchmark transactions to geth’s mempool at once (within \lt 1 second). Geth’s dev mode miner (dev.period=10) then processes transactions sequentially from this pool during a 10-second block-building window – when the timer expires, it mines whatever it managed to process. The bottleneck is trie operation time, not gas capacity: each ERC20 approve tx uses only ~4.4M gas (the 100M block gas limit could fit ~22), but trie operations (traverse, update, hash, commit) consume nearly the entire window for just 1 tx on slower configs. Setup transactions (simple ETH transfers) process 7 txs in 77ms, confirming that trie cost – not transaction overhead – is the limiting factor.
With verified cold-cache drops (Phase 3), all configs now process 1 tx/block (median tx_count=1). The mechanistic explanation remains valid – the 10-second dev.period acts as a time budget, and trie operation cost determines how many transactions fit. Mgas/s (throughput) is the correct comparison metric as it normalizes for any gas differences across configs. Where raw ms is shown, it reflects the actual block processing time for that config’s block composition.
S4 – Act I: Reads Confirm the Intuition
ERC20 Reads: Where Depth Matters
| GD | state_read (ms) | total (ms) | Mgas/s | vs GD-1 (Mgas/s) |
|---|---|---|---|---|
| 1 | 5,878 | 6,284 | 2.65 | baseline |
| 2 | 3,840 | 4,231 | 3.95 | +49% |
| 3 | 2,866 | 3,213 | 5.20 | +96% |
| 4 | 2,677 | 3,067 | 5.46 | +106% |
| 5 | 2,370 | 2,733 | 6.11 | +131% |
| 6 | 2,248 | 2,623 | 6.39 | +141% |
| 7 | 2,339 | 2,693 | 6.04 | +128% |
| 8 | 2,598 | 2,977 | 5.59 | +111% |
~2.4x read throughput from GD-1 to GD-6. GD-6 achieves the highest read throughput (6.39 Mgas/s), followed by GD-5 (6.11) and GD-7 (6.04). Read performance increases monotonically from GD-1 through GD-6 before tapering off – GD-4 (5.46) beats GD-3 (5.20) as expected from shorter paths. GD-7 and GD-8 show diminishing returns as nodes become large enough to offset the shorter paths.
Why the dramatic difference from synthetic? Keccak scatters keys uniformly, forcing a full traversal from root to leaf. GD-1 must descend 256 levels; GD-8 only 32. Every level is a potential disk seek. Random access exposes the full depth penalty.
GD-3 (3,213 ms, 5.20 Mgas/s) and GD-4 (3,067 ms, 5.46 Mgas/s) perform closely on reads, with GD-4 slightly ahead as expected from its shorter path (64 vs ~86 nodes). GD-3’s smaller node serialization (~256 bytes vs ~512 bytes for GD-4) interacts favorably with Pebble’s 4KB block size, keeping the two within 5% despite very different tree shapes. The Pebble block-size interaction remains worth exploring (Open Question #3).
Per-slot cost: synthetic reads cost ~0.02 ms/slot. ERC20 reads cost ~0.4–1.0 ms/slot (computed as state_read_ms / storage_slots_read per block) – a 40x penalty from random access patterns.
This 40x ratio aligns with raw NVMe measurements: Gary Rong’s disk page-read benchmarks show random 4KB reads at 77 MB/s vs 3,306 MB/s sequential (43x), confirming the penalty is dominated by I/O access patterns rather than Pebble overhead.
Why random access is the baseline, not the exception. The binary trie unifies all accounts and storage into a single tree. Every key – whether an account balance, a storage slot, or a code chunk – is SHA256-hashed into the 256-bit keyspace. A single contract’s storage slots scatter across completely different tree paths. This makes random access the fundamental access pattern of the binary trie, not a pathological case. The synthetic sequential benchmarks represent an unrealistic best case that cannot occur in a unified trie deployment.
So far, wider is better – up to a point. GD-6 leads on reads, with GD-7 and GD-8 showing diminishing returns. Then we tested writes.
S5 – Act II: The Write Surprise
This is the most important finding in the study.
| GD | state_read | trie_updates | commit | Total | Mgas/s |
|---|---|---|---|---|---|
| 1 | 812 | 691 | 77 | 1,645 | 2.67 |
| 2 | 483 | 393 | 61 | 993 | 4.42 |
| 3 | 349 | 287 | 44 | 732 | 5.95 |
| 4 | 313 | 254 | 53 | 678 | 6.47 |
| 5 | 271 | 242 | 57 | 629 | 6.94 |
| 6 | 272 | 283 | 76 | 679 | 6.41 |
| 7 | 264 | 328 | 103 | 745 | 5.81 |
| 8 | 313 | 433 | 158 | 982 | 4.47 |
trie_updates = state_hash_ms (AccountHashes + AccountUpdates + StorageUpdates) — covers the full trie mutation and rehash phase, not just hashing. All configs run with verified cold-cache protocol (OS page cache drops between runs). Phase 3 CVs are mostly \lt 10% on Mgas/s, confirming reliable measurements.
GD-5 is the write champion. 6.94 Mgas/s – 7% faster than GD-4 (6.47 Mgas/s, p \lt 1e-9) and 55% faster than GD-8 (4.47 Mgas/s). GD-6 (6.41 Mgas/s) ranks 3rd, closely trailing GD-4. GD-7 (5.81 Mgas/s) confirms the inflection continues past GD-6.
The component breakdown tells the story:
- Reads: GD-5 (271 ms) is 13% faster than GD-4 (313 ms). GD-6 (272 ms) is comparable to GD-5, and GD-7 (264 ms) is the fastest reader – but raw ms must be paired with Mgas/s for fair comparison since gas per block can vary.
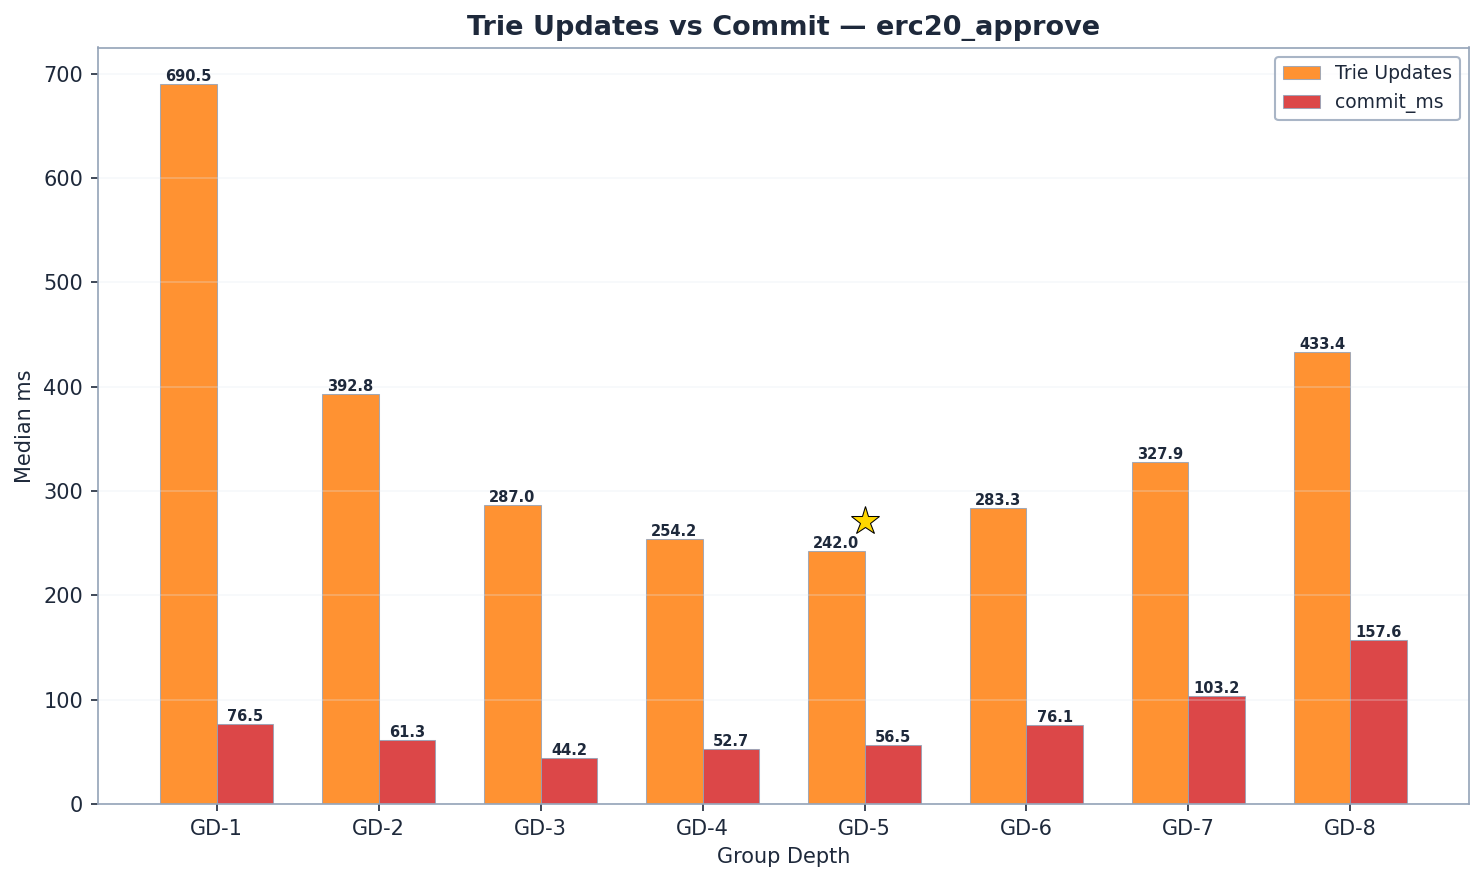
- Trie updates: GD-5 (242 ms) is 5% less than GD-4 (254 ms). GD-6 rises moderately to 283 ms (+17% over GD-5), not the dramatic cliff older data suggested. GD-7 (328 ms) and GD-8 (433 ms) confirm the inflection continues.
- Commit: GD-5 (57 ms) is slightly higher than GD-4 (53 ms). GD-6 (76 ms, +33% over GD-5) and GD-7 (103 ms) show moderate increases. The real commit cliff is at GD-8 (158 ms) due to ~8 KB nodes x 32 path nodes = ~256 KB serialization per write.
The write inflection lies between GD-5 and GD-6: the hash/read cost ratio crosses 1.0 at GD-6 (283/272 = 1.04), meaning trie updates begin to exceed read costs. By Mgas/s, GD-5 (6.94) leads GD-4 (6.47) by 7% and GD-6 (6.41) by 8%.
Why? The Internal Subtree
Each trie node at group depth g contains an internal binary subtree with 2^g - 1 nodes that must be rehashed on every write.
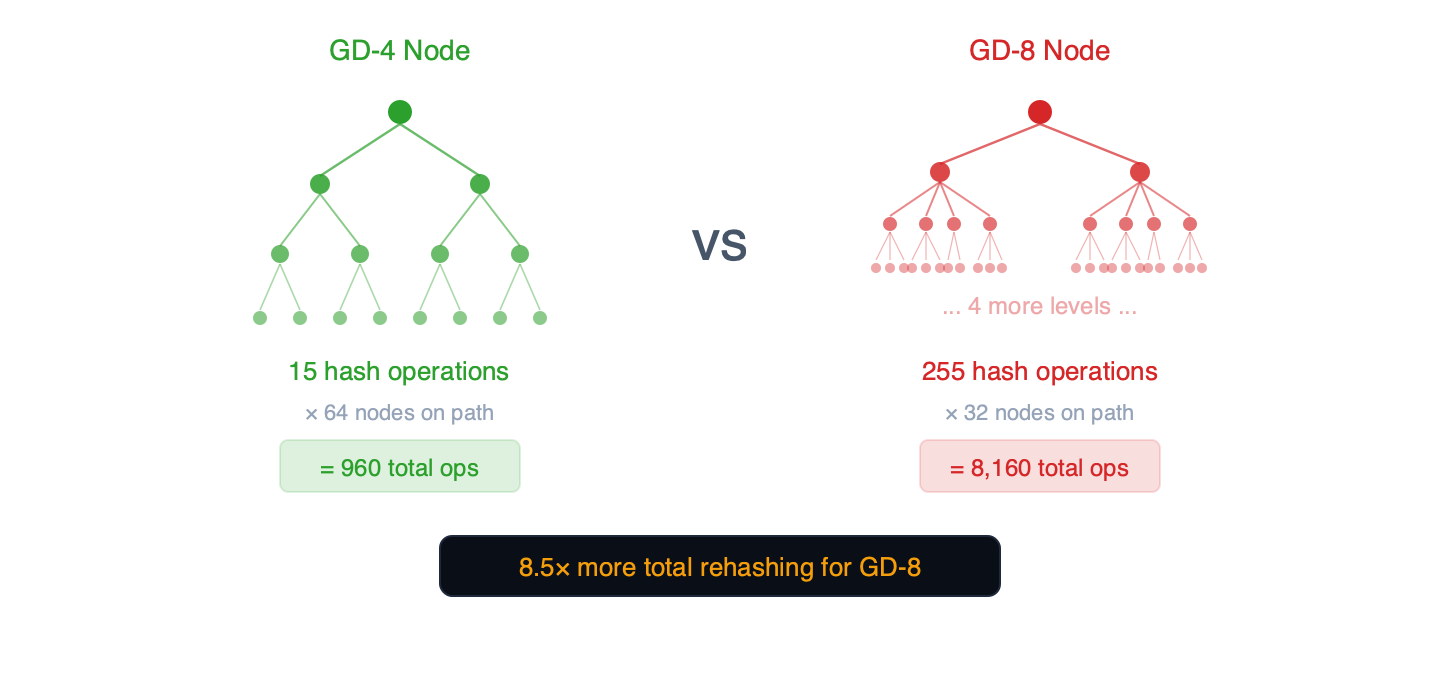
Figure 3 – Each trie node contains an internal binary subtree. Wider nodes mean exponentially more hashing per write.
- GD-4 node: 15 internal hash operations x 64 nodes on path = 960 total ops
- GD-5 node: 31 internal hash operations x ~52 nodes on path = ~1,612 total ops
- GD-8 node: 255 internal hash operations x 32 nodes on path = 8,160 total ops
GD-5 finds the write sweet spot: its path is 19% shorter than GD-4 (~52 vs 64 nodes), and each node’s 31 internal operations remain manageable. At GD-6 (63 internal nodes per node), rehashing costs rise moderately – 283 ms vs 242 ms for GD-5 (+17%). GD-7 (328 ms hash, 103 ms commit) confirms the inflection continues past GD-6. The write inflection point lies between GD-5 and GD-6, where the hash/read ratio crosses 1.0.
Note: The 17× ratio (255 vs 15 internal hash operations) is the theoretical upper bound from the data structure. Our benchmarks support the mechanism: GD-8 trie update costs are 1.71× more than GD-4 (433ms vs 254ms), consistent with random writes modifying a fraction of each node’s internal subtree. The geth implementation is the authoritative source for the exact rehashing algorithm.
Node Serialization Size
Each trie node stores up to 2^N child pointers (32 bytes each). A GD-4 node: 16 × 32 = ~512 bytes. A GD-7 node: 128 × 32 = ~4 KB – exactly the Pebble block size. A GD-8 node: 256 × 32 = ~8 KB. The size differences have cascading effects:
- Pebble block boundary: GD-6 nodes (~2 KB) fit within a single 4 KB Pebble block. GD-7 nodes (~4 KB) saturate the block – with key overhead, they likely span two blocks, potentially doubling I/O per node fetch. This partly explains GD-7’s read reversal: despite 14% fewer path nodes than GD-6 (37 vs 43), GD-7 reads ~148 KB total per lookup (37 × 4 KB) vs GD-6’s ~86 KB (43 × 2 KB).
- Pebble cache efficiency: Fewer GD-8 nodes fit in a given cache budget
- Write amplification: Larger serialized nodes increase LSM compaction overhead
- Commit cost: The 198% commit penalty (158ms vs 53ms) partly reflects serializing 16× more data per modified node
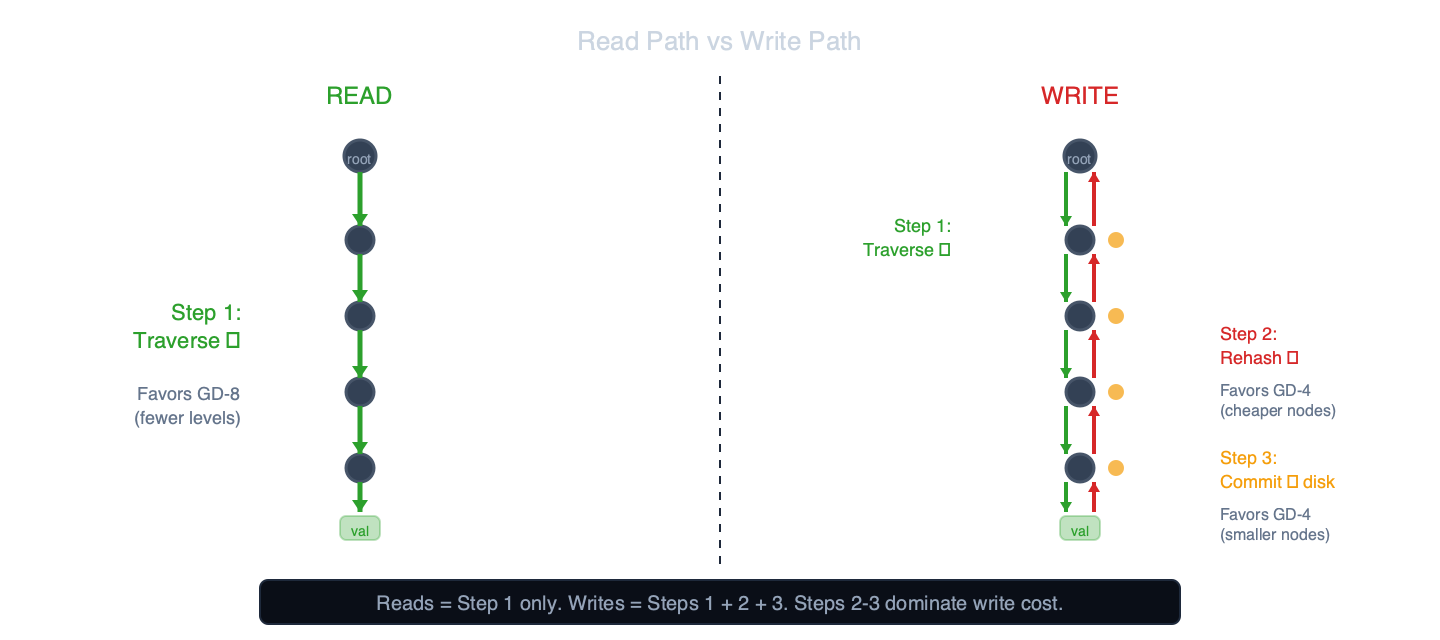
Figure 4 – For reads, only the downward traversal matters (favors GD-8). For writes, rehashing and commit dominate (favors GD-4). Reads = Step 1 only. Writes = Steps 1 + 2 + 3.
S6 – Act III: The Trade-off
The Verdict
| Criterion | GD-4 | GD-5 | GD-6 | GD-7 | GD-8 |
|---|---|---|---|---|---|
| Reads (Mgas/s) | 5.46 | 6.11 | 6.39 | 6.04 | 5.59 |
| Writes (Mgas/s) | 6.47 | 6.94 | 6.41 | 5.81 | 4.47 |
| Mixed (Mgas/s) | 5.13 | 6.09 | 6.27 | 5.87 | 5.43 |
| Category wins | 0/3 | 1/3 | 2/3 | 0/3 | 0/3 |
GD-6 wins reads and mixed; GD-5 wins writes. GD-5 leads writes by 7% over GD-4 (p \lt 1e-9). GD-6 leads reads by 5% over GD-5 and mixed by 19% over GD-4 (p \lt 1e-3). GD-7 is past the inflection – worse than GD-6 on all three benchmarks. Since Ethereum workloads are read-heavy, GD-6 may be the preferred default, with GD-5 optimal for write-heavy scenarios.
Mixed Workloads
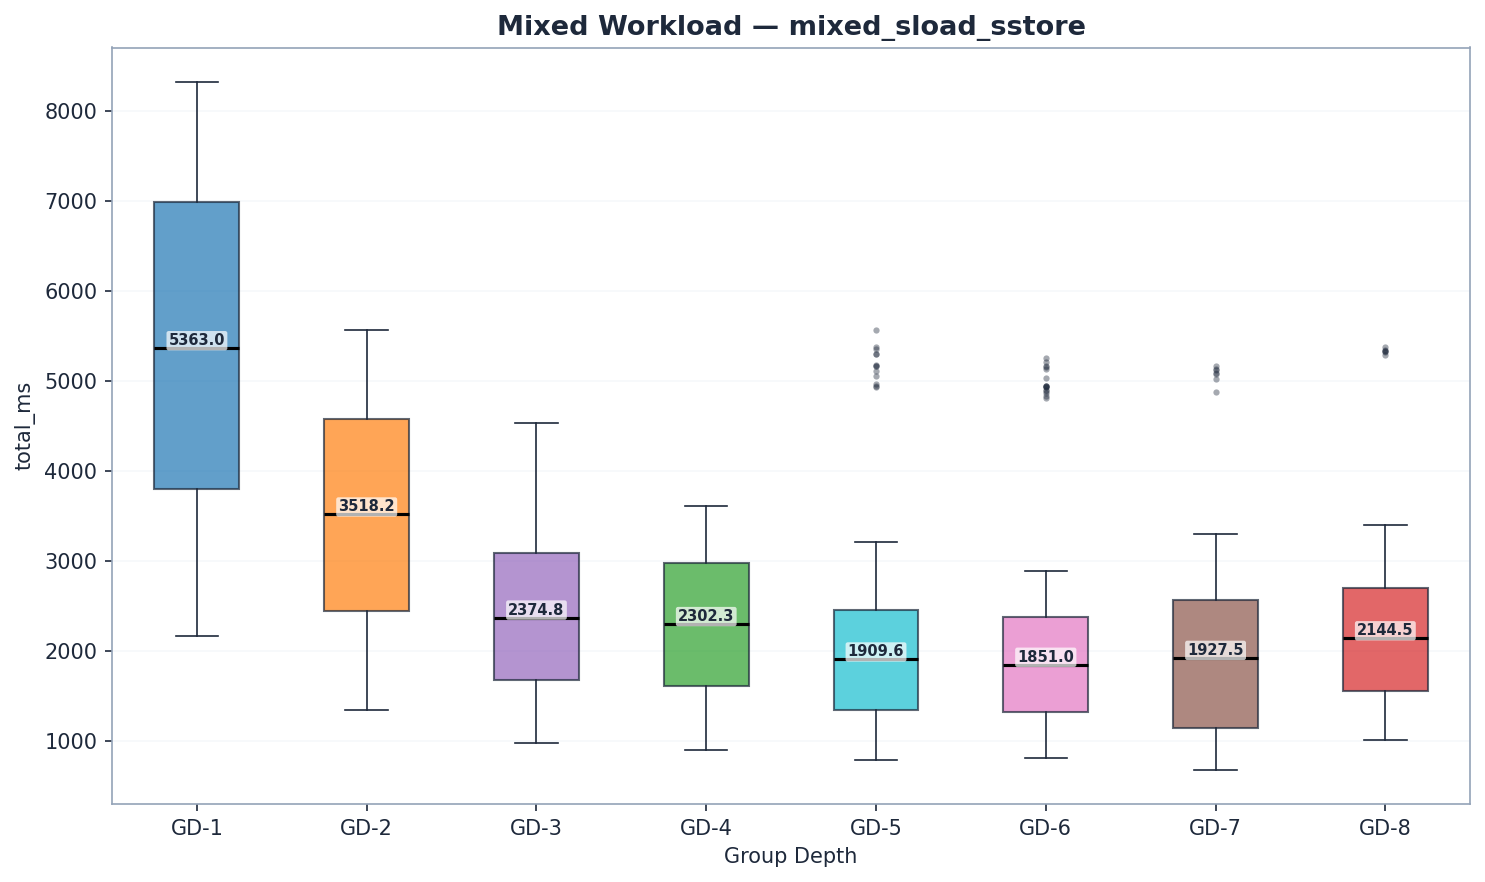
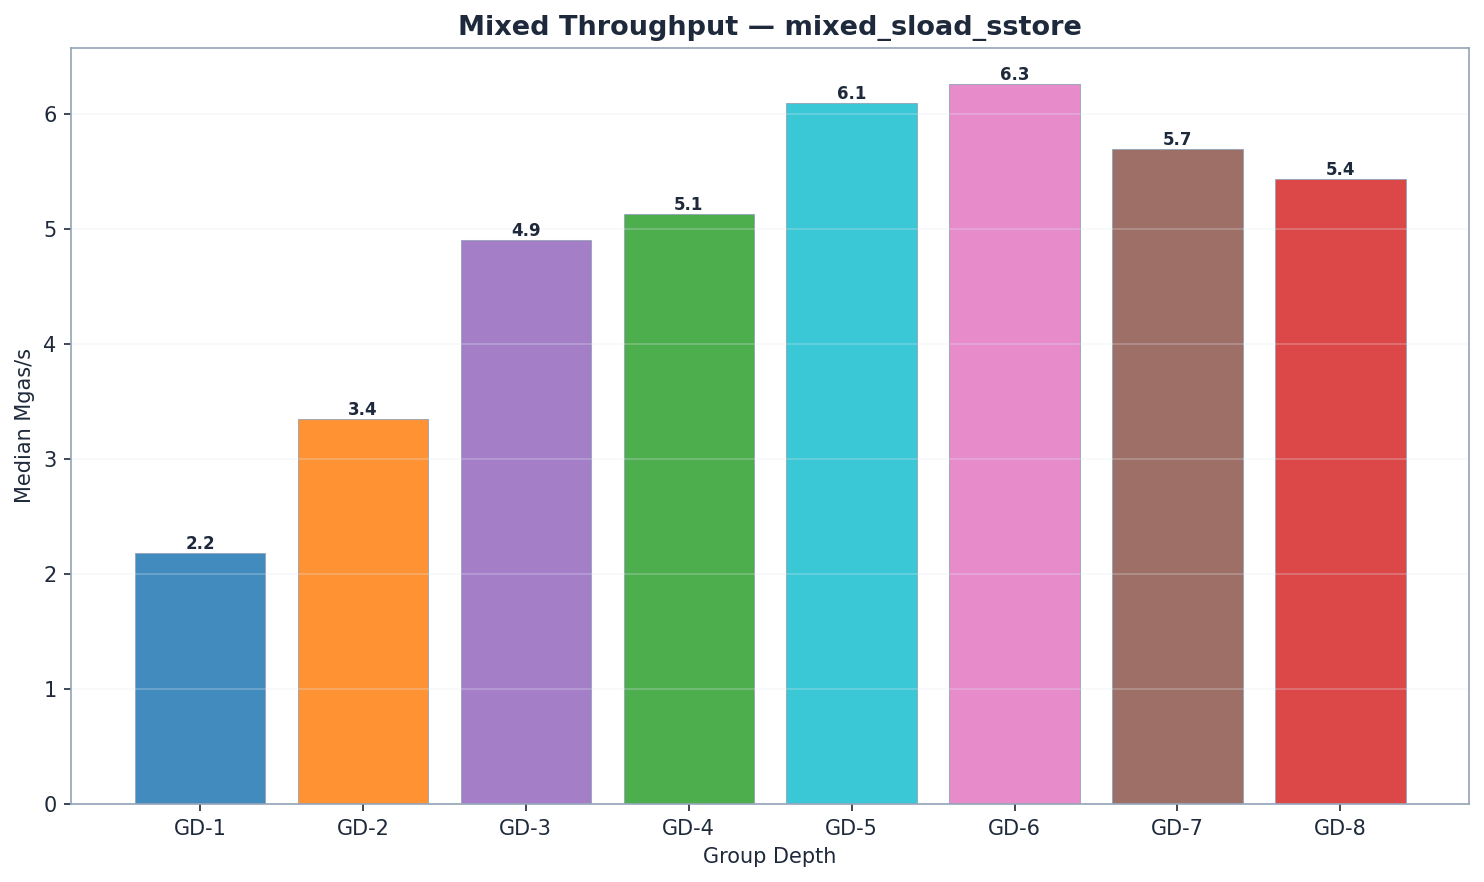
| GD | state_read | trie_updates | commit | total_ms | Mgas/s |
|---|---|---|---|---|---|
| 1 | 4,711 | 345 | 53 | 5,363 | 2.18 |
| 2 | 3,003 | 217 | 44 | 3,518 | 3.35 |
| 3 | 1,981 | 145 | 39 | 2,375 | 4.90 |
| 4 | 1,893 | 138 | 43 | 2,302 | 5.13 |
| 5 | 1,512 | 124 | 48 | 1,910 | 6.09 |
| 6 | 1,440 | 141 | 54 | 1,851 | 6.27 |
| 7 | 1,055 | 218 | 73 | 1,529 | 5.87 |
| 8 | 1,612 | 221 | 87 | 2,145 | 5.43 |
GD-7’s mixed benchmark processed fewer transactions per block (8.84M vs ~11.80M gas). Mgas/s normalizes for this difference, so throughput comparisons remain valid. Raw ms values for GD-7 mixed are not directly comparable to other configs.
GD-6 leads mixed workloads at 6.27 Mgas/s, followed closely by GD-5 (6.09 Mgas/s, +3%). Both outperform GD-4 (5.13 Mgas/s) by 19–22%. GD-6’s read advantage (1,440 ms state_read vs 1,512 ms for GD-5) outweighs its slightly higher trie updates (141 ms vs 124 ms) and commit (54 ms vs 48 ms). GD-7 (5.87 Mgas/s) trails GD-6 by 6%, confirming the inflection. Note: GD-7 mixed uses 8.84M gas/block vs 11.80M for all others; Mgas/s is the valid comparison, not raw ms.
Open question: The optimal group depth ultimately depends on the read/write ratio of real Ethereum blocks. While state reads clearly dominate block processing time in our benchmarks, the exact mainnet split has not been systematically measured. A historical analysis of mainnet read vs write access patterns would further inform this recommendation.
The component breakdown reveals the familiar pattern:
- Reads: GD-7 has the lowest raw read time (1,055 ms), but at lower gas/block. By Mgas/s, GD-6 (6.27) leads. GD-5 (1,512 ms) and GD-6 (1,440 ms) outperform GD-4 (1,893 ms) on reads.
- Trie updates: GD-5 leads (124 ms), followed by GD-4 (138 ms) and GD-6 (141 ms). GD-7 (218 ms) and GD-8 (221 ms) trail due to larger internal subtrees.
- Commit: GD-3 wins (39 ms), with GD-4 (43 ms) and GD-5 (48 ms) close behind. GD-7 (73 ms) and GD-8 (87 ms) show the serialization penalty of wider nodes.
S7 – Cross-Cutting Patterns
Where Does Time Go?
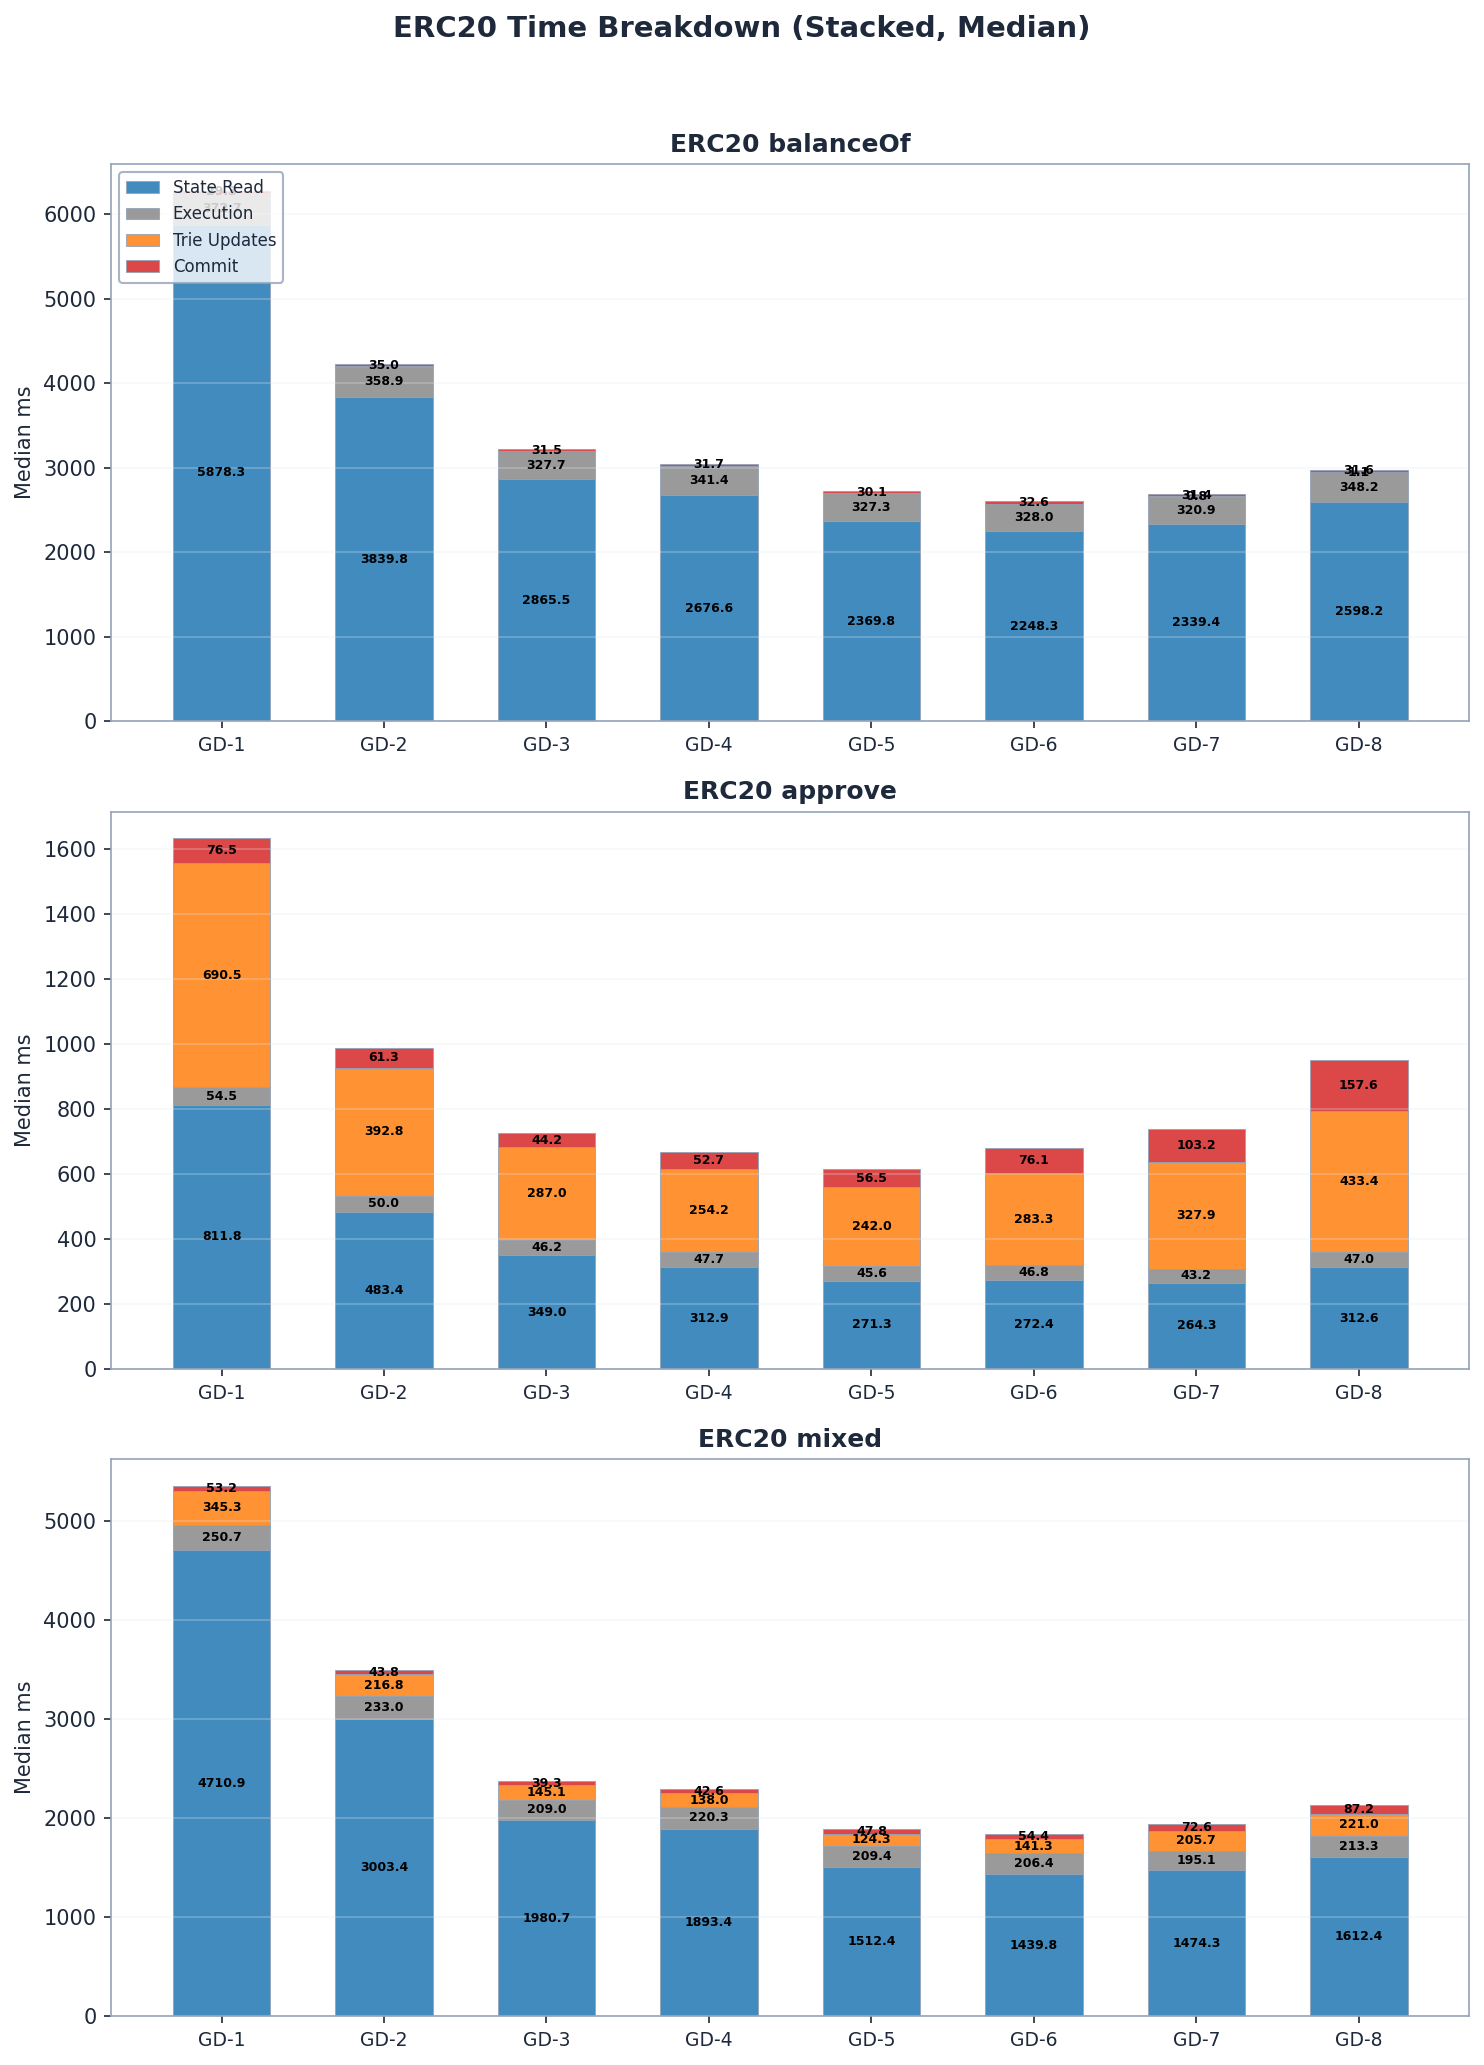
State reads dominate ERC20 block processing time across all group-depth configurations, accounting for 50–85% of total time. Trie update and commit costs are negligible for read-only benchmarks (balanceOf) but become the dominant cost component for writes (approve) – especially at higher group depths where internal subtree rehashing is most expensive.
Overall Throughput
Hardware Context: NVMe I/O Characteristics
Disk page-read benchmarks by Gary Rong on NVMe (Samsung 990 Pro) provide hardware context for interpreting our results:
- Random vs sequential: 4KB random reads = 77 MB/s (50.6 µs) vs 3,306 MB/s sequential – a 43x gap that closely matches our 40x per-slot penalty.
- Page size matters: Random 16KB reads achieve 2.3x throughput of 4KB (174 vs 77 MB/s) with only 1.8x latency. Wider group depths produce larger nodes that could benefit from larger Pebble block sizes.
- Queue depth is transformative: QD=1 to QD=8 improves random 4KB throughput by 8.7x (77 to 673 MB/s). Parallel EVM could unlock this, compressing read latency differences between configs.
- Sublinear latency growth: 4KB to 64KB = 16x data, but only 2.3x latency (50.6 to 117.3 µs). NVMe’s internal parallelism means larger I/O requests are disproportionately efficient.
These measurements use direct page reads bypassing filesystem caches – analogous to our cold-cache protocol. The benchmark hardware (Samsung 990 Pro) differs from our QEMU VM’s virtual disk, so absolute numbers won’t match, but the ratios reveal fundamental NVMe characteristics relevant to group depth optimization.
S8 – Conclusions
Recommendation: GD-5 or GD-6 (Workload-Dependent)
The optimal depth is GD-5 or GD-6, depending on the workload profile:
- Read-heavy / mixed workloads (default recommendation): GD-6. Wins reads by 5% over GD-5 (6.39 vs 6.11 Mgas/s) and mixed by 3% (6.27 vs 6.09 Mgas/s). Since Ethereum is read-heavy, GD-6 is the preferred default.
- Write-heavy workloads: GD-5. Wins writes by 7% over GD-4 (6.94 vs 6.47 Mgas/s) and 8% over GD-6 (6.94 vs 6.41 Mgas/s).
- GD-7 confirms the inflection. Worse than GD-6 on all three benchmarks (reads -5%, writes -9%, mixed -6%), validating that the sweet spot is GD-5 or GD-6.
The recommendation rests on a three-step mechanism that governs every state access in the binary trie:
- Traverse – descend from root to leaf. Cost proportional to tree depth. Favors wider trees (GD-8: 32 levels vs GD-5: ~52 vs GD-4: 64 levels).
- Rehash – recompute the internal subtree of every node on the path back to root. Cost proportional to 2^g - 1 per node. Favors narrower trees (GD-4: 15 ops/node, GD-5: 31 ops/node, GD-8: 255 ops/node).
- Commit – serialize and write modified nodes to disk. Cost proportional to node size. Favors narrower trees.
GD-5 finds the minimum of the traversal x rehashing trade-off for writes. Its path is 19% shorter than GD-4 (~52 vs 64 nodes), and each node’s 31 internal operations remain manageable. At GD-6, rehashing costs rise moderately – 283 ms vs 242 ms for GD-5 (+17%) – but reads and mixed workloads still improve. The write-specific inflection point lies between GD-5 and GD-6 (hash/read ratio crosses 1.0), while reads peak at GD-6.
Five Patterns That Hold Across All Group Depths
Pattern 1: State reads dominate. 50–85% of block processing time is spent reading state from disk, regardless of group depth or benchmark type.
state_read_msincludes account and code lookups in the unified trie, not just storage slot reads.
Pattern 2: Random access is ~40x more expensive per slot. Keccak-hashed keys (ERC20) cost 0.4–1.0 ms/slot vs 0.02 ms/slot for sequential access (synthetic). The gap is driven by Pebble block cache misses on keccak-scattered keys.
Independent NVMe page-read benchmarks confirm that random vs sequential I/O explains nearly all of this penalty (see Section 7 Hardware Context for details).
Pattern 3: Cache hit rates plateau at ~37–39%. Despite increasing group depth, the storage cache hit rate never exceeds ~39% for keccak-hashed workloads. The 256-bit keyspace is too sparse for meaningful cache reuse beyond shared upper-level trie nodes.
Pattern 4: Trie updates are negligible for reads, dominant for writes. balanceOf (pure reads): trie_updates \lt 1.3 ms. approve (reads + writes): trie_updates up to 691 ms (GD-1). This asymmetry means the node-width trade-off only matters for write workloads.
Pattern 5: Run-to-run CV mostly \lt 10% on Mgas/s. Phase 3 verified cold-cache drops (120+ successful, 0 failures) produce reproducible results across all eight configurations. The improvement from earlier phases validates the cold-cache methodology.
Open Questions
-
Pebble block size interaction. All tests used 4KB blocks. NVMe page-read benchmarks show that random 16KB reads achieve 2.3x the throughput of 4KB reads (174 vs 77 MB/s) with only 1.8x the latency (89.7 vs 50.6 µs). Larger Pebble blocks could significantly benefit wider group depths whose serialized nodes exceed 4KB.
-
Concurrent block processing. These benchmarks process blocks sequentially. Parallel execution engines might amortize trie updates across cores, reducing the per-node rehashing penalty of wider group depths. NVMe queue depth benchmarks show that QD=8 improves random 4KB throughput 8.7x over QD=1 (673 vs 77 MB/s). If parallel execution increases effective I/O queue depth, read latency differences between group depths may compress significantly.
Benchmarks run on the Ethereum execution-specs framework. Methodology, raw data, and reproducibility scripts available in the execution-specs repository.