The Shape of Ethereum: A Six-Year Study of Topological Anomalies
Authors: Matan Prasma (@KanExtension), Uri Yacobi Keller (@urihamster)
What if we could associate a shape to Ethereum’s transaction graph each day, not just track its volume or price—would that shape change in recognizable ways around real-world shocks? We analyzed six years of data to find out.
The Idea, in One Paragraph
We applied Topological Data Analysis (TDA)—a method from algebraic topology relatively new to data science—to Ethereum’s daily transaction data, including smart contract execution. Each day’s transactions are split into four layers:
-
Small / Medium / Large smart contract calls
-
Plain ETH transfers
Each layer’s addresses are turned into a growing sequence of geometric shapes, one per distance scale. As that sequence grows, connected components merge, loops open up and close, and voids appear and disappear—every one of those births and deaths gets recorded in a persistence diagram.
Comparing one day’s diagram to the next (via a Wasserstein distance) gives a single number per layer, per day: how much did the shape of the network change? Track that number for six years, run it through standard time-series anomaly detection, and see what falls out.
The full mathematical treatment—the Vietoris-Rips construction, persistent homology, persistence diagrams, and why Wasserstein distance is the right way to compare them—is in the companion article. Our aim throughout is less to hand over a finished monitoring tool than to show what a topological lens can reveal that price and volume alone can’t. This post contains the headline results.
What We Found
Running this pipeline over 2020–2025 turned up 86 anomalous days (more precisely, anomaly clusters, after merging adjacent flagged days). We then checked which real-world events sat near each one: 73 of the 86 (85%) correspond to a real-world event, with either an internal or external relation to the chain.
Key Examples:
-
Black Thursday (Mar 12, 2020): The
highInputlayer (zero-ETH transactions with calldata ≥ 500 bytes) registers its largest single-day spike of the year on the exact same day, at the 100th percentile—consistent with the actual failure mode (liquidation cascades, oracle contracts buckling under load) rather than just the price crash itself. -
Russia’s Invasion of Ukraine (Feb 2022): The
medInputlayer (zero-ETH transactions with calldata in the 100–499 byte range) fires two days later—exactly the lag expected once markets reopened after the weekend and DeFi repositioning caught up with the news. -
The Bybit Hack (Feb 2025):
medInputfires the next day—not the day of the theft itself (a single transaction, invisible to a structural distance metric), but the day after, once stolen funds began fanning out through DeFi bridges and mixers.
Structural Breaks & Layer Rotation
-
Unsupervised Change-Point Detection: With no knowledge of price or news, just the shape of the four-layer signal, unsupervised detection finds six structural breaks in the six-year record. Every single one lands within two weeks of an identifiable catalyst (e.g., the end of DeFi Summer, the Merge, BlackRock’s ETF filing).
-
Layer Rotation Over Time: In 2024, the
nonFactorylayer (governance, ERC-20 transfers, custody flows) drives 11 of 16 flagged events, while simple ETH transfers barely register. In 2025, that nearly inverts—plain transfers become the most active anomaly source while complex contract calls go quiet. Something fundamental about who is using Ethereum, and how, shifted between those two years without being visible on a standard price chart.
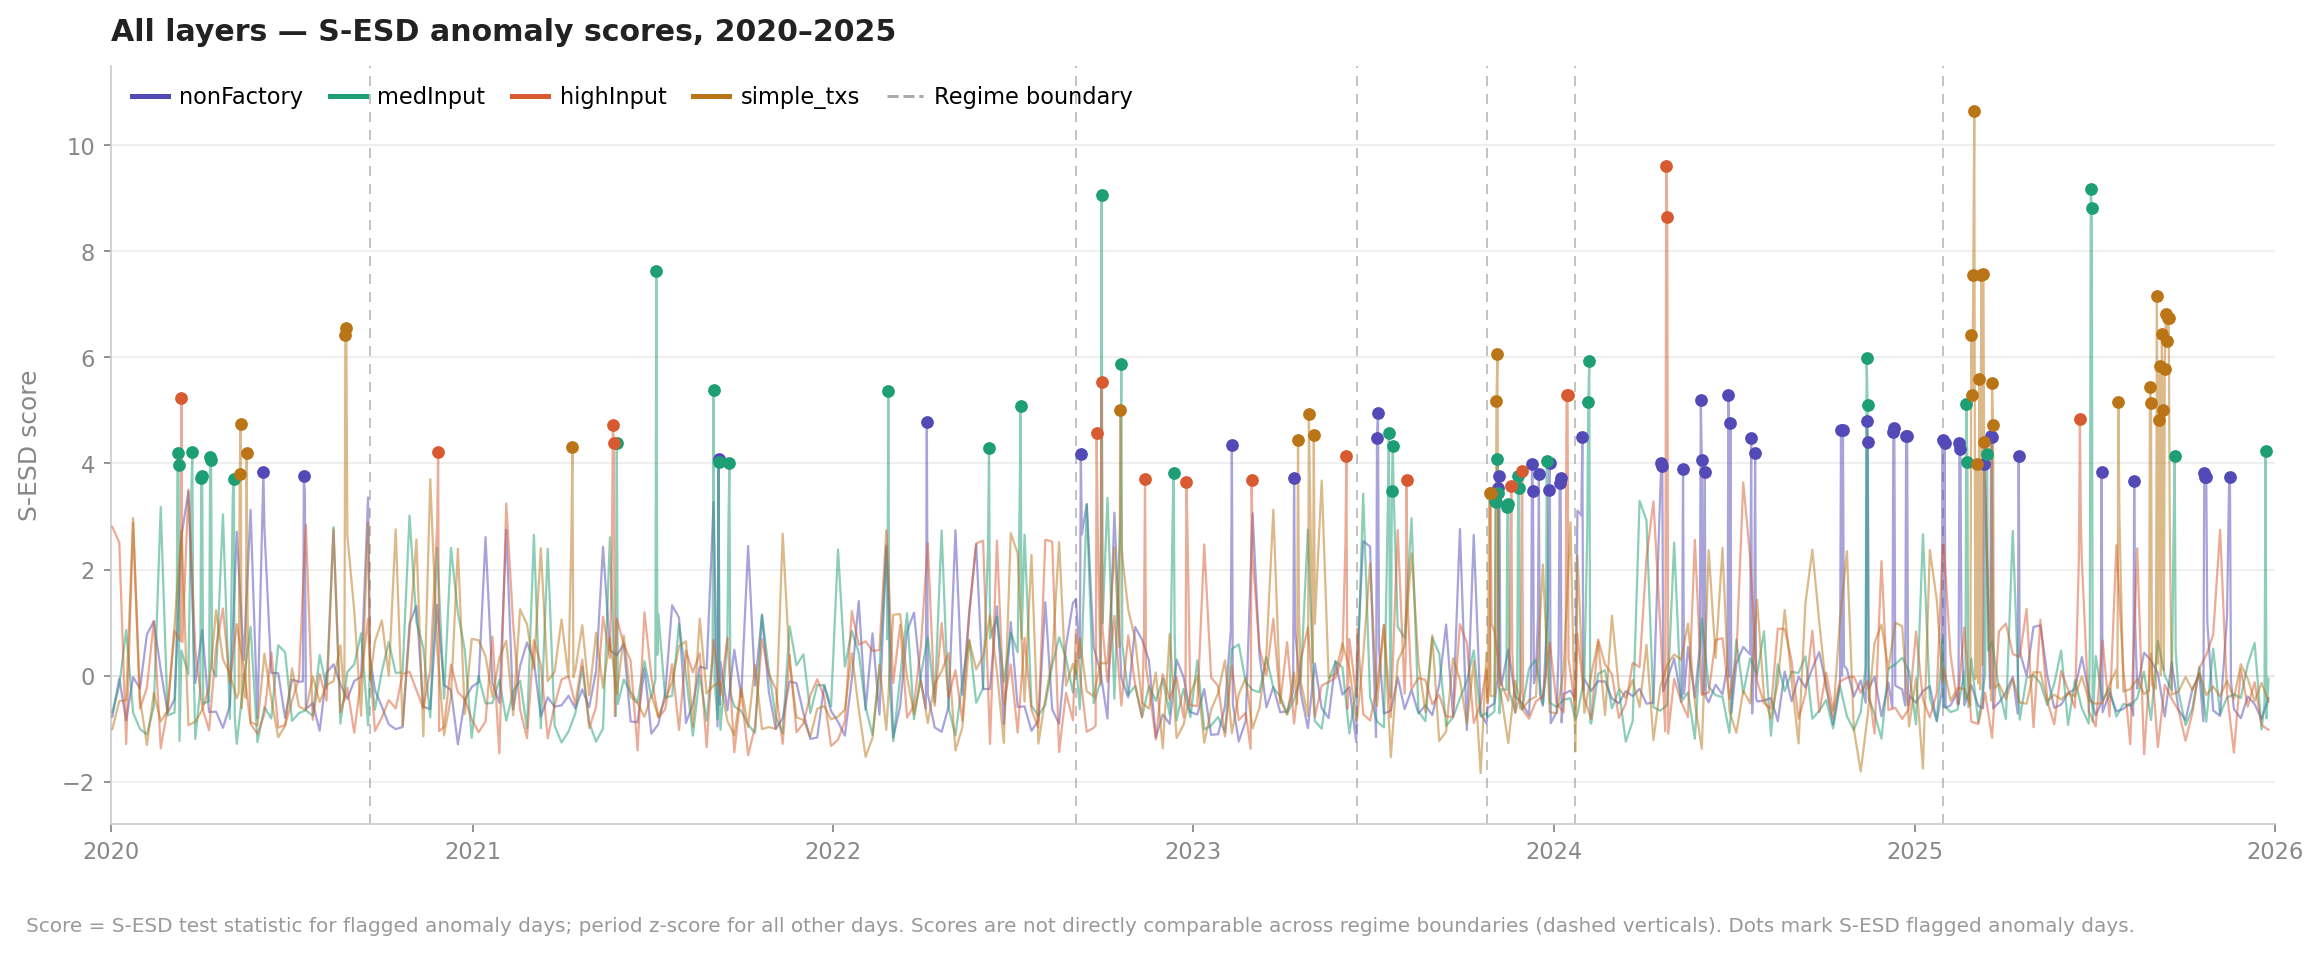
(All-layers S-ESD score overlay, 2020–2025)
Beyond Anomalies: A Look at Volatility Prediction
The same pipeline also hints at a broader application: using on-chain topology to inform market forecasts. In a preliminary experiment, TDA features added predictive information for 7-day-ahead ETH volatility beyond standard financial features, including a GARCH (Off-the-shelf standard model for volatility prediction) baseline. The effect was statistically robust and survived a temporal-shuffle placebo test. We see this as an encouraging indication that blockchain topology may contain market-relevant information not captured by conventional financial signals — a direction we leave for future work.
A Caveat, Up Front
We don’t have ground truth for what counts as a “meaningful, chain-altering” event—there’s no labeled dataset to score ourselves against. What we can say is that most of the matches above are, in our judgment, plausibly chain-altering, and we’d genuinely like readers to look through the full event list themselves and form their own view. This project is meant to showcase what TDA can do on this kind of data, more than to stake out a specific, well-defined use case.
Read More
Everything is in the repository:
-
The Article: Full methodology (with worked examples and illustrations), pipeline details, the change-point table, per-layer breakdowns, and a discussion of next steps (cross-chain comparison, finer-grained homological splitting, live monitoring). Read the Full Article on GitHub / Download PDF.
-
The Appendix: The complete list of all 86 anomaly events with attribution tiers, three additional case studies, and the full event-matching methodology. Read the Appendix on GitHub.
-
The Code: The full pipeline, from raw transaction data to persistence diagrams to anomaly flags: https://github.com/Simplex-TDA/ETH-Anomaly-Detection.
-
Volatility Prediction: A report on the preliminary results of volatility prediction: Full Results On Github.
We’d love feedback on the method, on which matched events you find convincing or not, and on where you think this is most likely to be useful.