TL;DR
- There were almost ~300K Type 3 transactions (t3tx) in the first month (7K epochs) after Pectra.
- They come from about 85 different senders, from which the top 25 send over 93% of them.
- About 84% of t3tx have at least two slots of distance with the next t3tx from the same sender.
Introduction
The Ethereum ecosystem has undergone significant advancements in data availability solutions for Layer‑2 rollups. One pivotal innovation is Type 3 transactions (t3tx), introduced by EIP‑4844 as part of the Deneb-Cancun upgrade in March 2024. These transactions carry “blobs” — temporary binary large objects (~128 KB each) held by the consensus layer for roughly 4,096 epochs (~18 days). Blobs aren’t accessible by EVM code, but contracts can refer to them via BLOBHASH and KZG-coded hash commitments, enabling a secure, yet lightweight, proof-of-availability mechanism.
Blobs serve as short-term storage for rollup transaction batches, decoupling heavy data use from the execution layer. T3tx wrap these blobs, embedding them into blocks without gumming up long-term Ethereum storage. A new fee market (blob gas) incentivizes efficient blob usage.
Each Ethereum block originally targeted 3 blobs (max 6). Building on EIP‑4844, the Pectra upgrade (Prague + Electra) was launched on May 7, 2025 (10:05:11 UTC, epoch 364 032), making waves as the most extensive Ethereum upgrade since the Merge with 11 EIPs. Central to Pectra is EIP‑7691, which doubles blob capacity—raising the target from 3 → 6 and max from 6 → 9 per block. Pectra’s capacity doubling ensures more blob space per block, reducing congestion, flattening fee spikes, and offering rollups dramatically increased throughput.
Motivation of this study
The introduction of t3tx in Ethereum via EIP‑4844, and the subsequent capacity expansion under the Pectra upgrade, marks a significant step toward scalable and cost-efficient data availability for Layer‑2 (L2) rollups. While much of the discourse has centered on the impact of blobs on throughput and gas economics, an equally critical aspect remains underexplored: the temporal and structural distribution of t3tx across blocks and slots, particularly from the perspective of emerging mempool sharding designs.
In prior research, we explored mempool sharding — a proposed solution to parallelize transaction processing across multiple shards. This might be impacted by the behavior of high-frequency senders. Specifically, batching behavior by infrastructure actors (e.g., rollup sequencers and blob submitters) could influence how likely transactions from the same sender are to land in the same or neighboring slots.
This study aims to fill that gap by conducting an analysis of slot distances between consecutive t3tx, using one month of post-Pectra data (Epochs 364033–371032). By quantifying how frequently t3tx are posted in tight succession, we assess:
- The prevalence of back-to-back posting by large infrastructure senders (e.g., Coinbase, Taiko, Arbitrum).
- The potential for intra-sender transaction collisions.
- The implications for future mempool architectures, blob propagation, and block inclusion policies.
Methodology
To evaluate the behavior of t3tx after the Pectra upgrade, we analyze Ethereum mainnet activity over a fixed one-month window following the upgrade.
- Start Epoch: 364033 (May 7, 2025 — the first epoch after Pectra activation)
- End Epoch: 371032 (June 7, 2025)
- Total Epochs Analyzed: 7,000
- Total t3tx Observed: 295,170
- Unique Senders Identified: 85
- Average Posting Rate: ~1.3 t3tx per slot
Our primary focus is on same-sender slot distance analysis — measuring the number of slots between consecutive t3tx from the same sender. We define:
We define slot distance as:
where \text{slot}_i is the slot of a t3tx by a sender, and \text{slot}_{i-1} is the slot of the same sender’s previous t3tx. To compute this, we first group all t3tx by sender, sort them by slot within each group, and then calculate the difference between consecutive slots. This metric allows us to measure how closely in time a sender is submitting t3tx. A smaller slot distance indicates a higher chance of transactions obstructing one another if they land into different shards.
All analysis was conducted using the Xatu Data which is publicly available.
Evaluation
Top 10 t3tx Senders Distribution
We analyzed the distribution of t3tx across all 85 unique sender addresses observed in the one-month post-Pectra window.
The pie chart below provides a visual breakdown of t3tx across the top 10 most active senders over the one-month period after the Pectra upgrade. Each slice represents the percentage of total t3tx submitted by a particular sender. The Others segment (in brown color) includes all remaining 75+ unique senders that individually do not contribute significantly to the overall volume. Collectively, they account for 16% of all t3tx. The top 3 senders (Base1, WorldChain, and Taiko1) alone are responsible for ~56.6% of all t3tx.
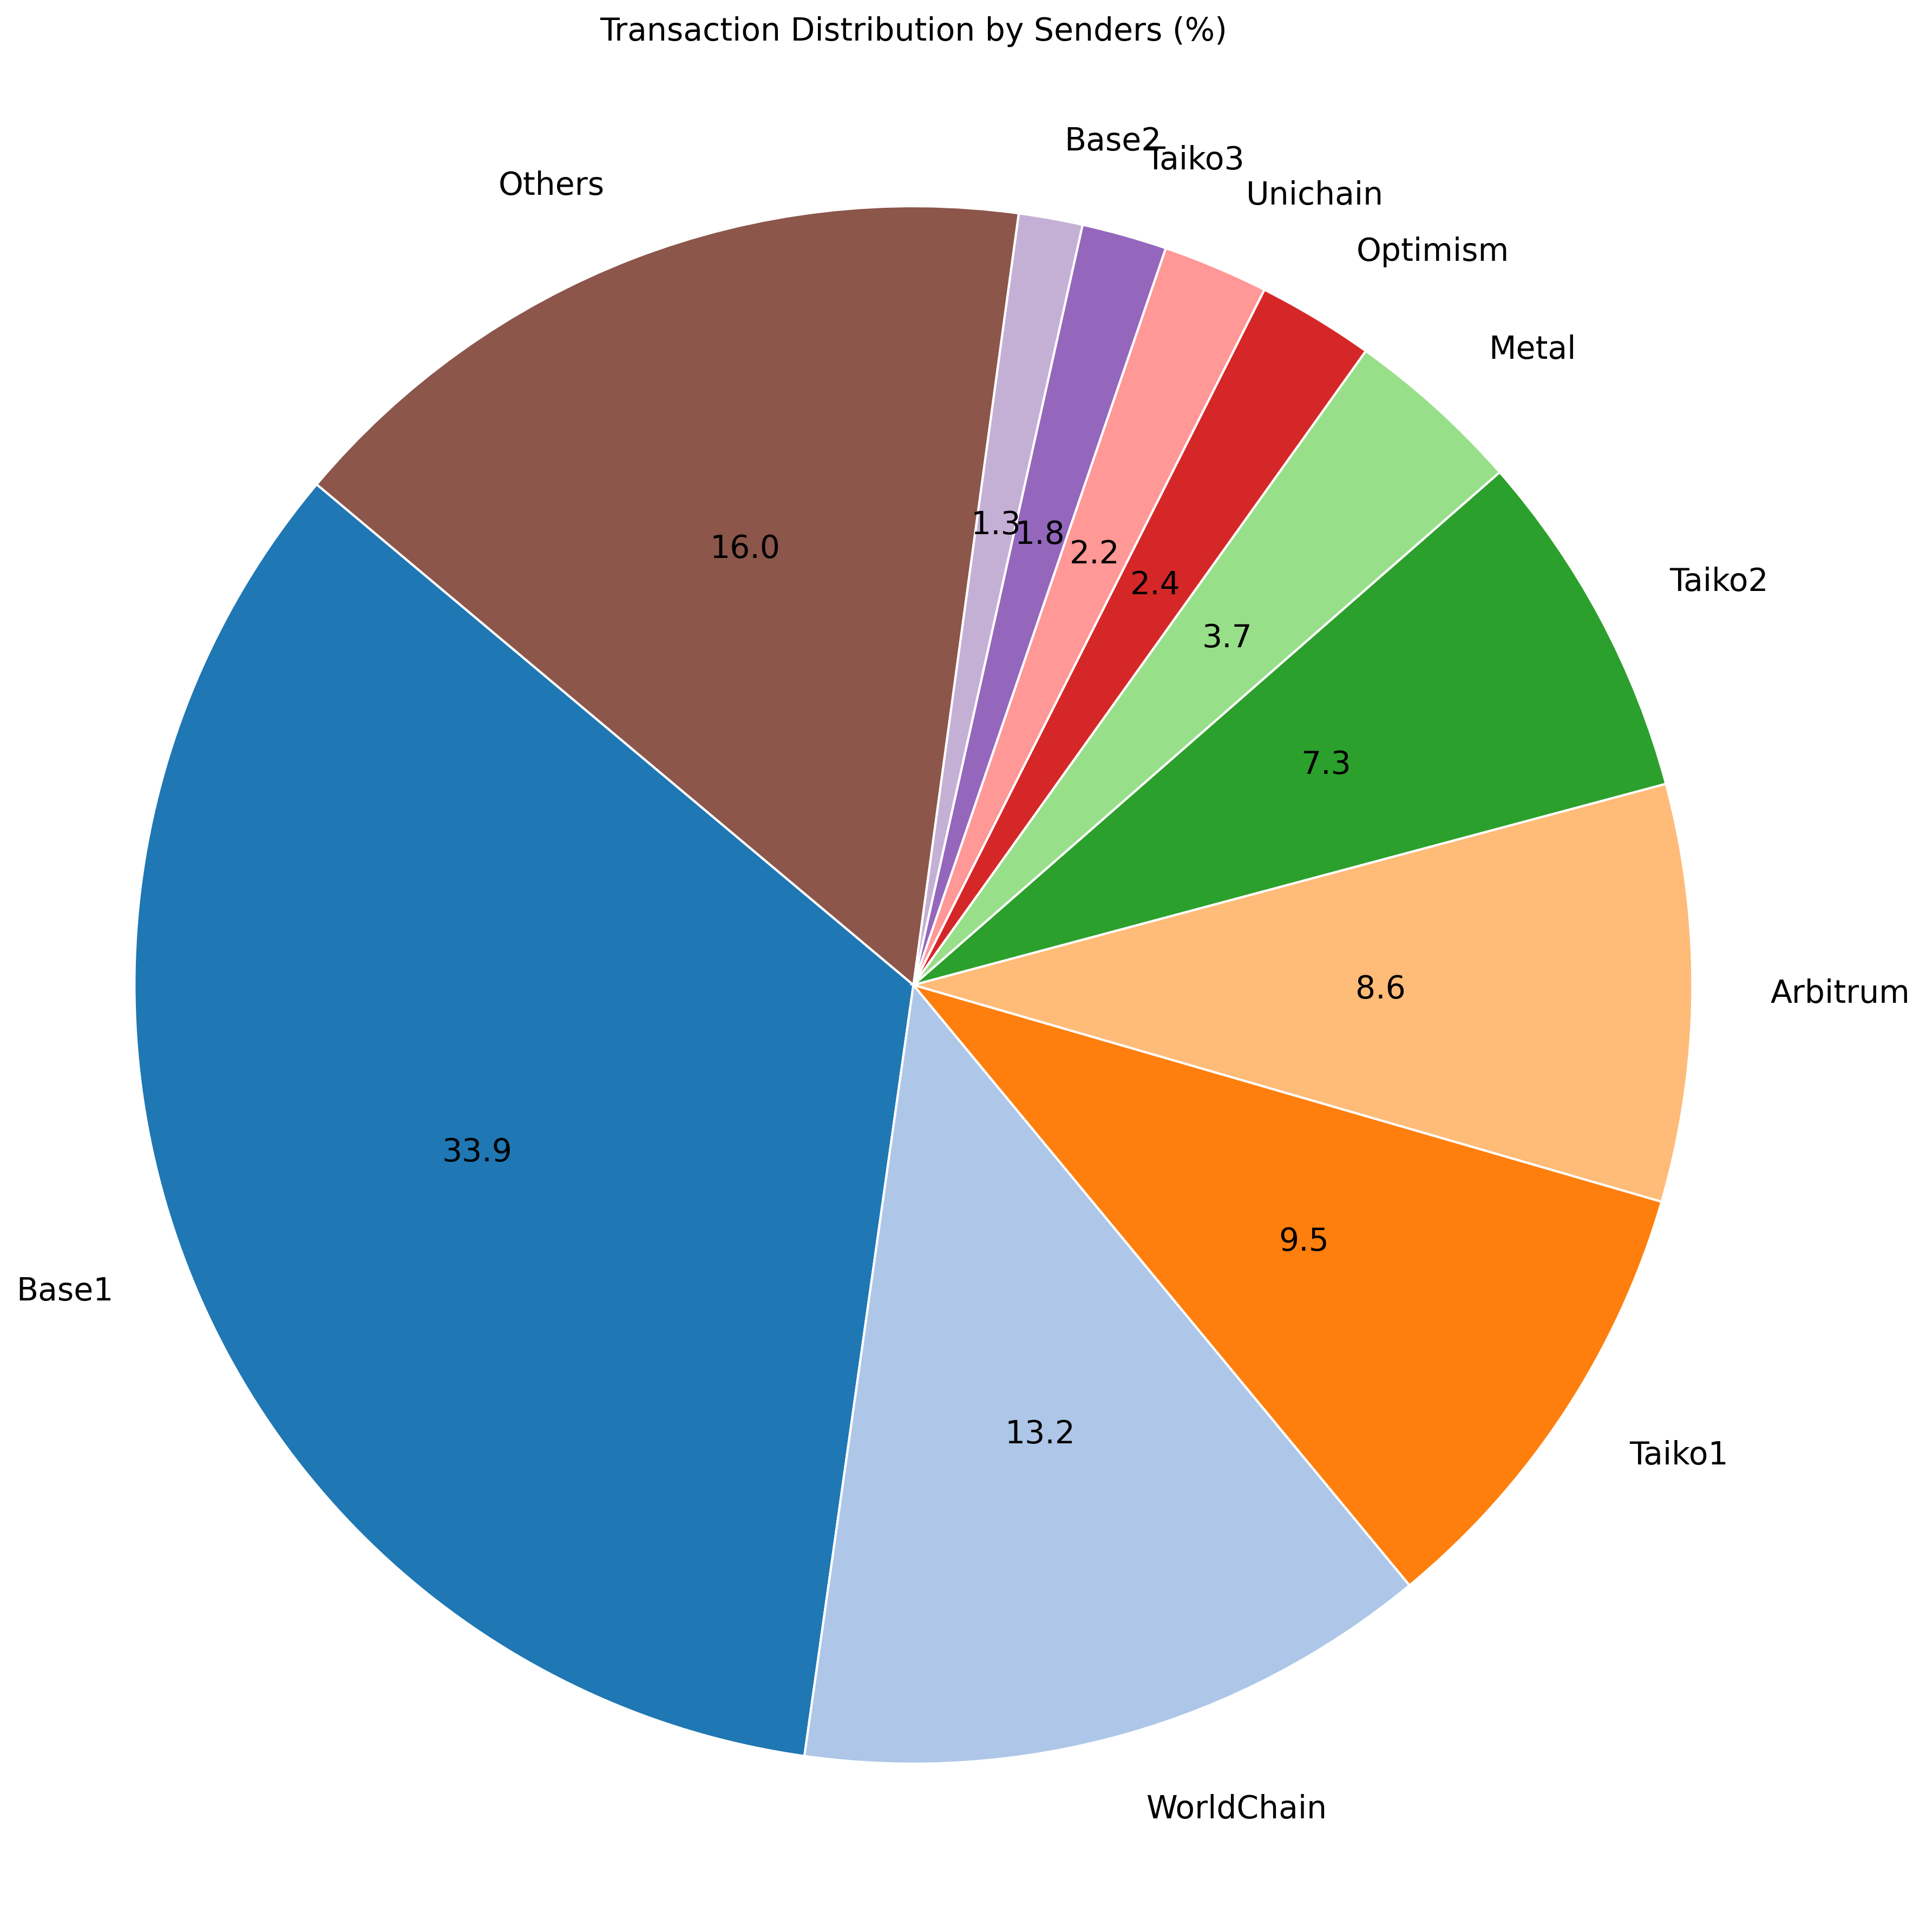
The top 10 senders that dominate the landscape are:
| Sender Address | Affiliation | Number of Transactions Sent |
|---|---|---|
0x5050F69a9786F081509234F1a7F4684b5E5b76C9 |
Base (Coinbase) – Batch Sender | 99,994 |
0xdBBE3D8c2d2b22A2611c5A94A9a12C2fCD49Eb29 |
World Chain (Metis) – Batch Submitter | 39,032 |
0x000000633b68f5D8D3a86593ebB815b4663BCBe0 |
Taiko – LabProver Proposer | 28,105 |
0xC1b634853Cb333D3aD8663715b08f41A3Aec47cc |
Arbitrum – Infrastructure Node | 25,525 |
0x41F2F55571f9e8e3Ba511Adc48879Bd67626A2b6 |
Taiko – Infrastructure Node | 21,490 |
0xC94C243f8fb37223F3EB2f7961F7072602A51B8B |
Metal – Commit Blob Sender | 10,918 |
0x6887246668a3b87F54DeB3b94Ba47a6f63F32985 |
Optimism – Sequencer | 7,152 |
0x2F60A5184c63ca94f82a27100643DbAbe4F3f7Fd |
Unichain – Sequencer | 6,460 |
0x7A853a6480F4D7dB79AE91c16c960dBbB6710d25 |
Taiko – Prover | 5,213 |
0xFBC0dcd6c3518cB529bC1B585dB992A7d40005fa |
Base – Batch Sender | 3,905 |
Distribution of t3tx accross senders:
- Top 10 senders send 84% of all t3tx
- Top 25 senders send 93% of all t3tx
- Top 50 senders send 98.16% of all t3tx
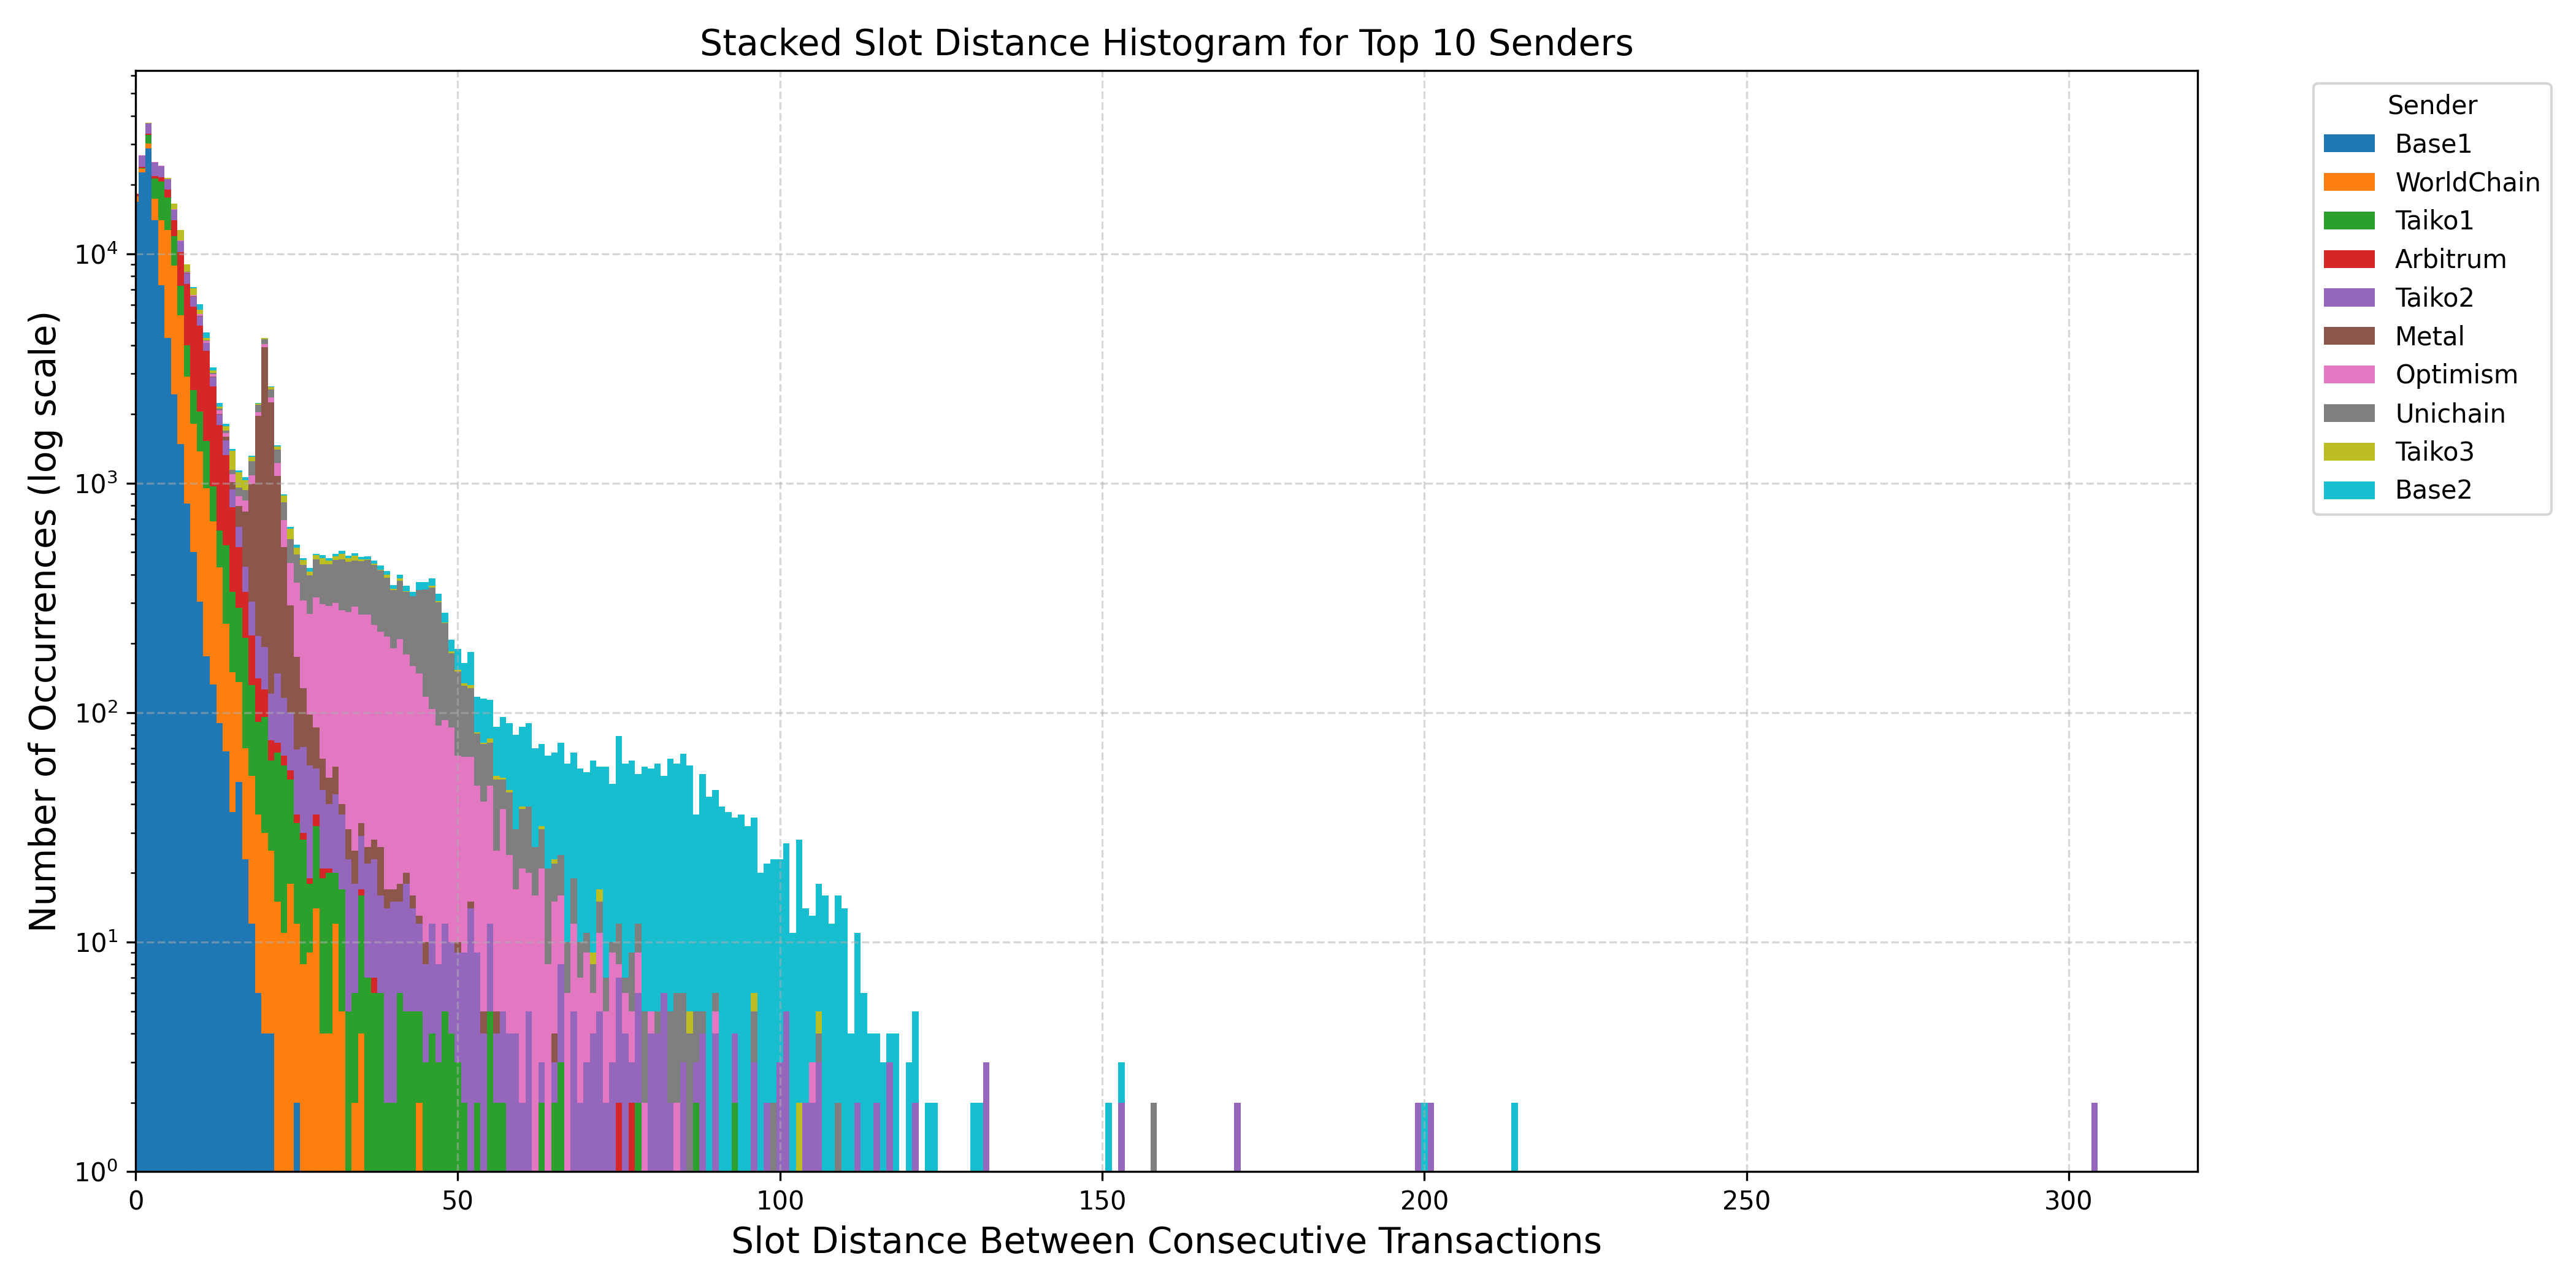
Slot Distance Analysis
To maintain relevance, we restrict our analysis to slot distances ≤ 320. This cutoff is chosen based on the fact that:
- Each epoch spans 32 slots (~6.4 minutes).
- A slot distance of 320 corresponds to 10 full epochs, or approximately 64 minutes.
- Transactions posted more than an hour apart are unlikely to obstruct one another.
The stacked histogram below illustrates the frequency distribution of slot distances between consecutive t3tx submitted by the same sender. Each colored segment in the histogram represents a specific high-volume sender among the top ten. The x-axis denotes the slot distance between t3tx from the same sender, while the y-axis shows how frequently those distances occur. The data reveals a pronounced skew toward short slot distances and the frequency drops off exponentially (note the logarithmic scale of the y axis) later as the slot distances increase.
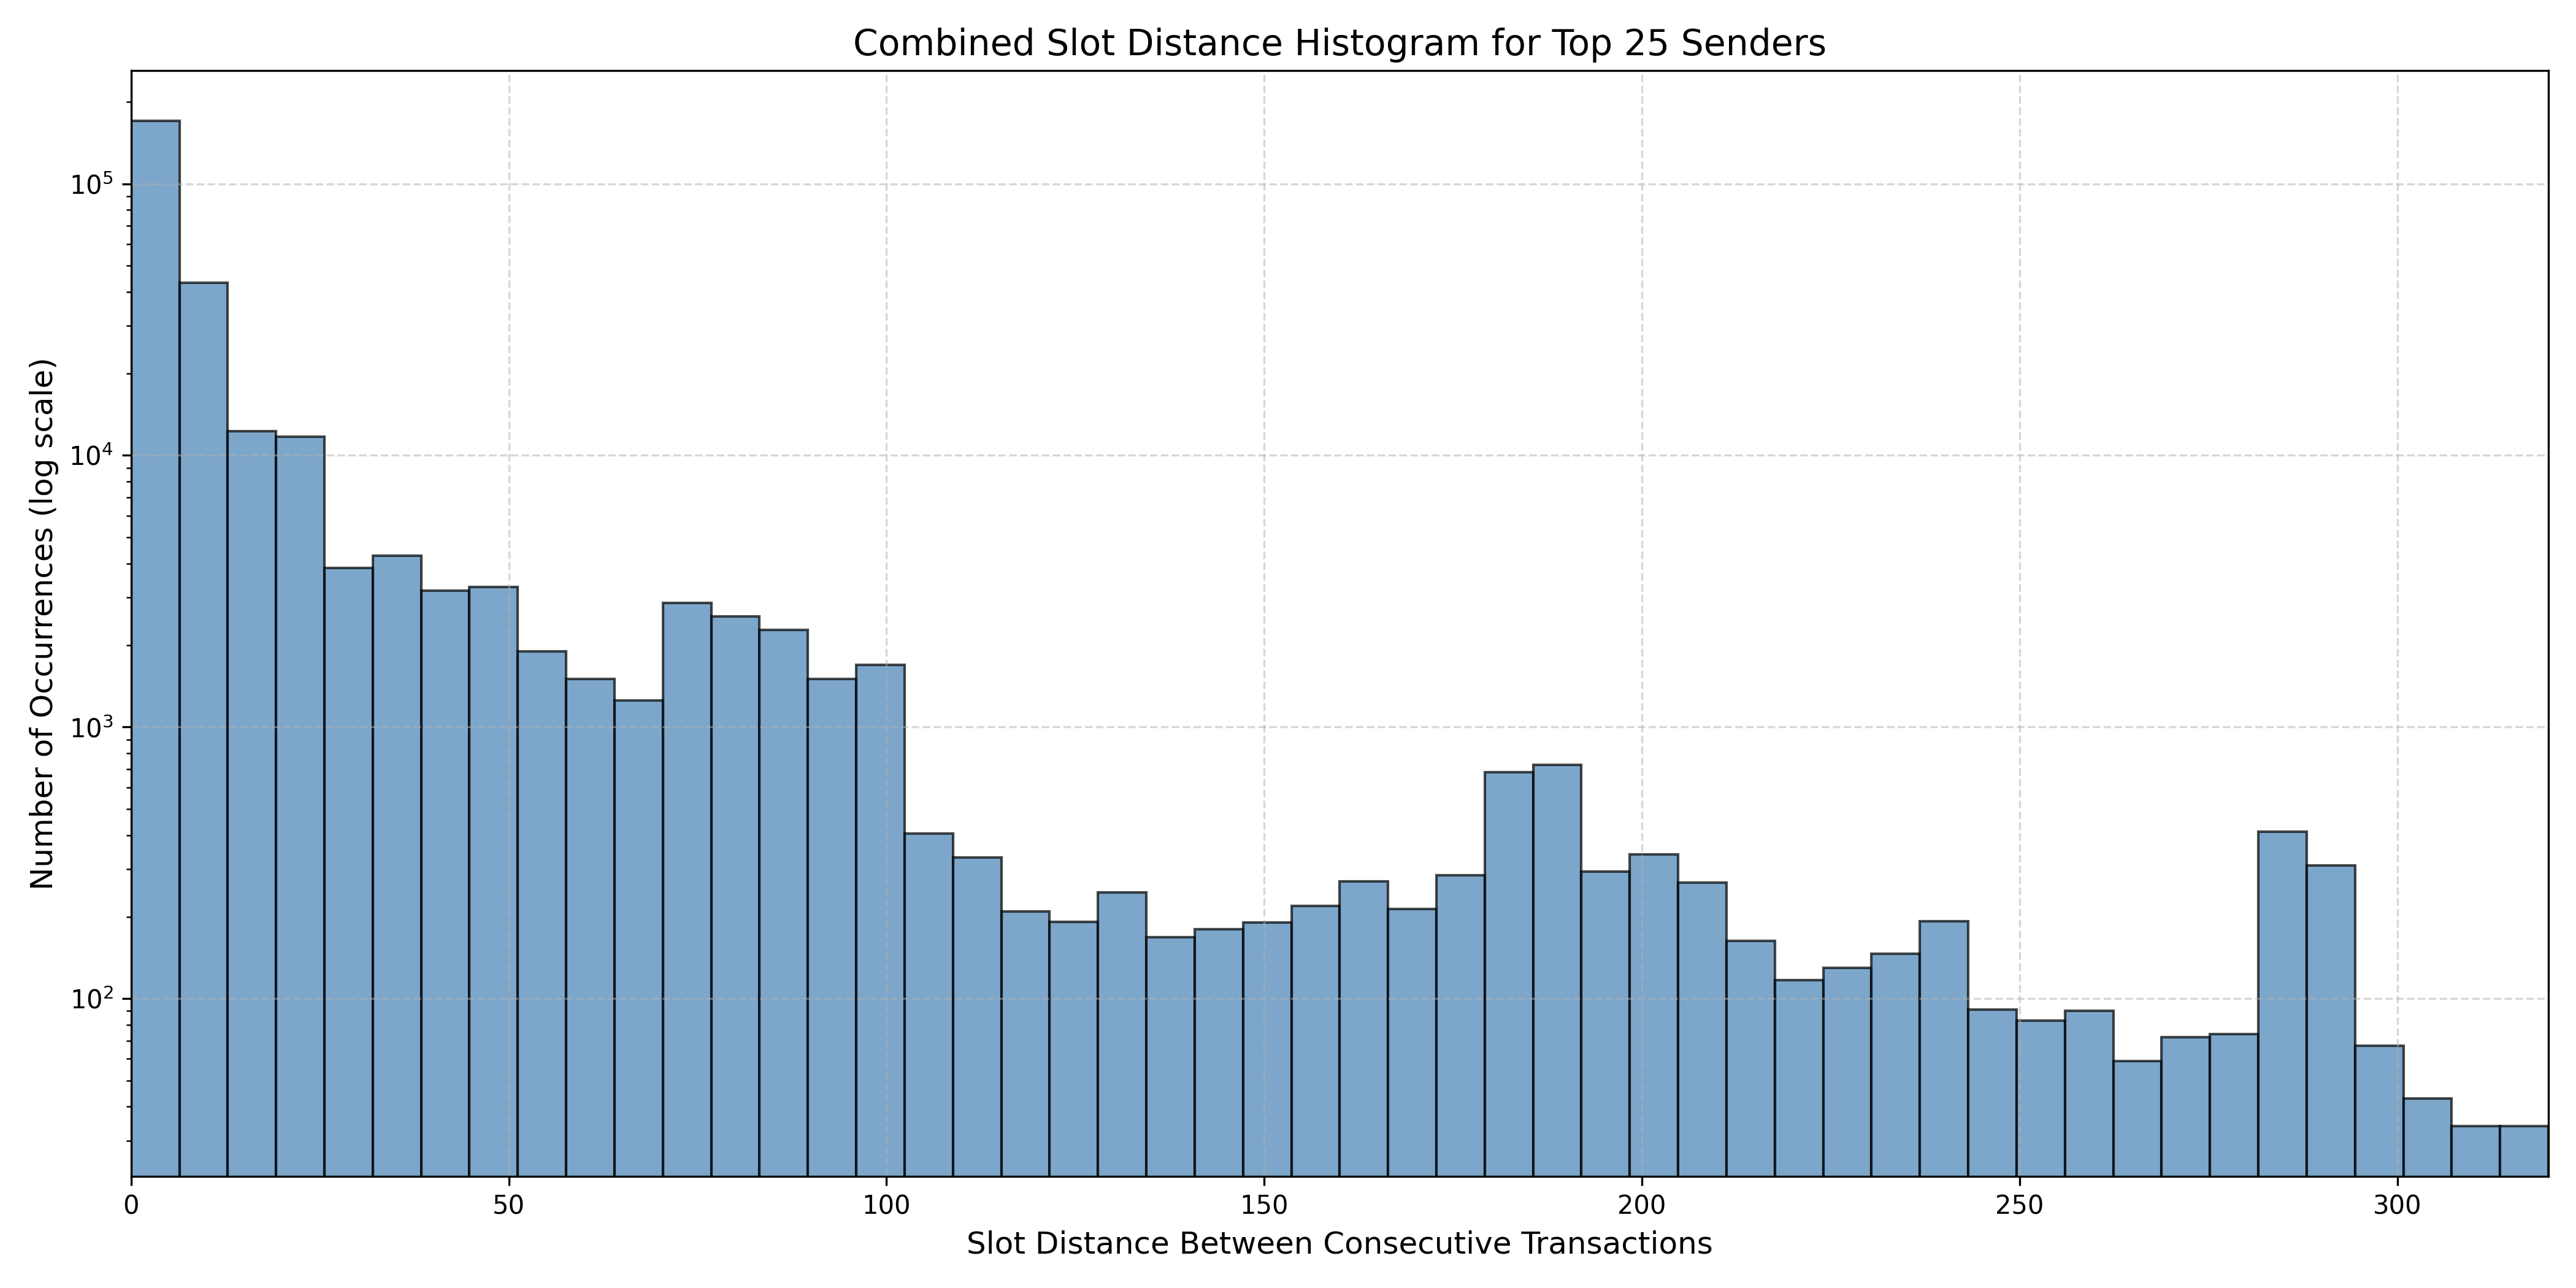
The top 10 senders represent only 84% of all t3tx. To get a wider picture we look at the agregate slot distance for the top 25 senders in the figure below. The x-axis represents the number of slots separating two consecutive t3tx by the same sender, and the y-axis indicates how frequently each slot distance occurs across the dataset. The distribution shows a clear peak at very small slot distances, highlighting that many of the top senders frequently submit transactions in rapid succession. As the slot distance increases, the frequency gradually declines but does not vanish, with noticeable fluctuations and some minor spikes.
Expanding the analysis to include the top 50 senders offers a broader view. The overall shape is similar to the top 25 senders slot distance distribution, with a dominant cluster at low slot distances and a gradual tapering off.
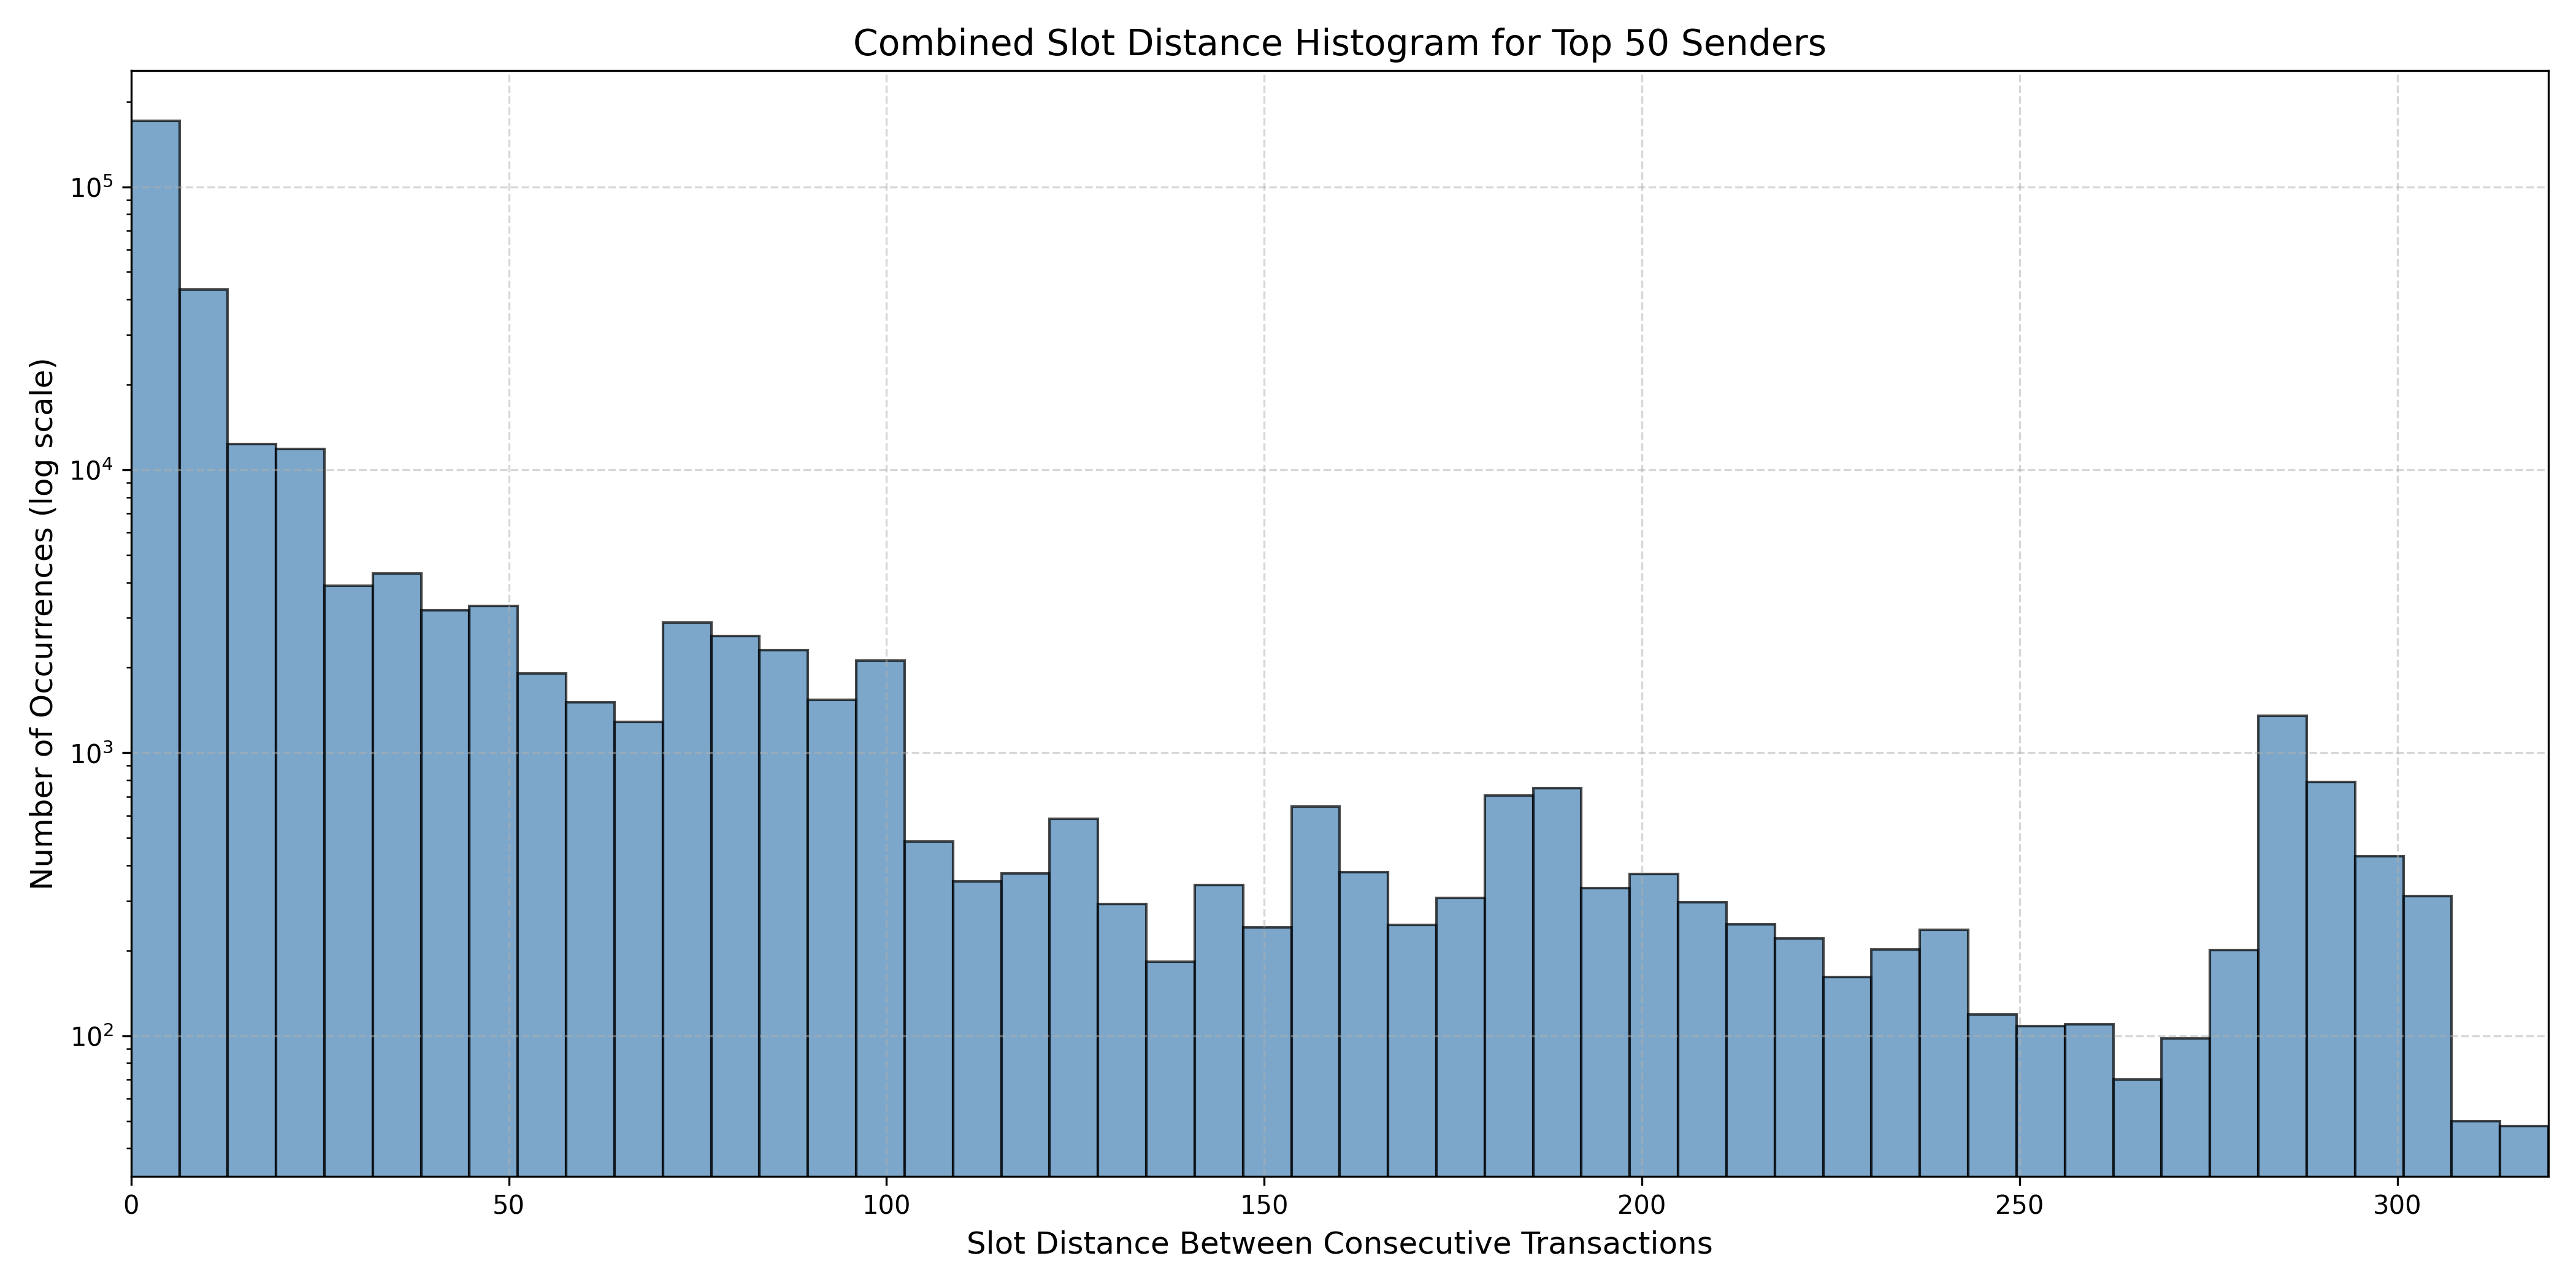
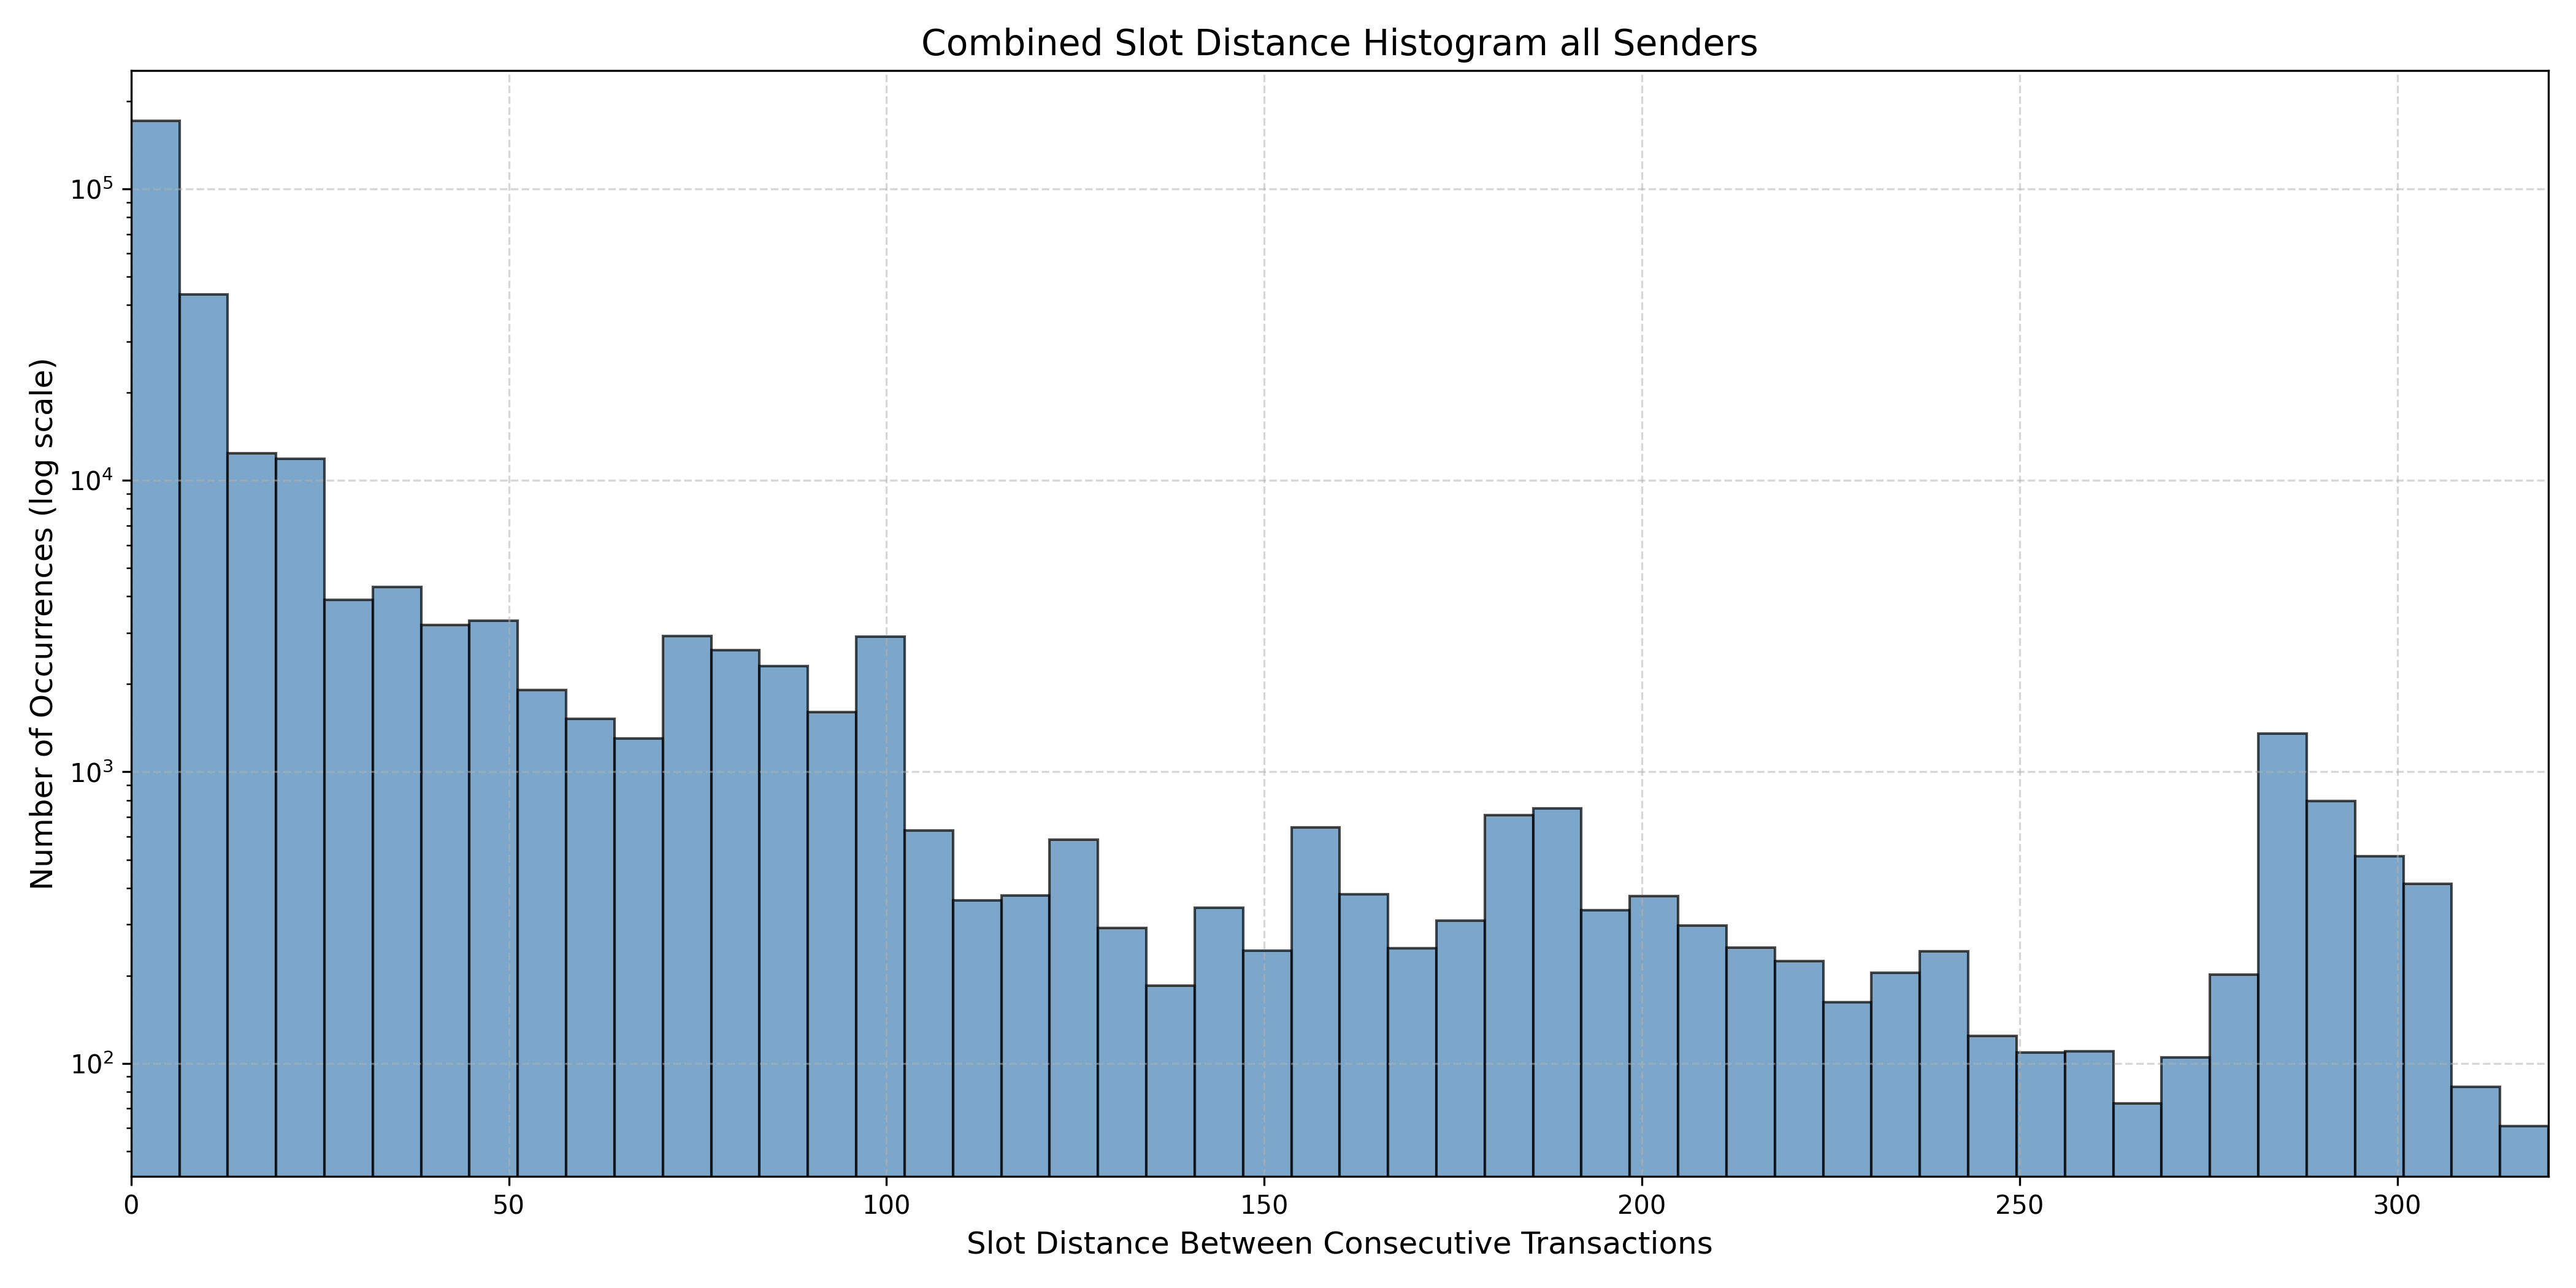
The histogram below shows the slot distance for all senders combined. The distribution is the same overall, but we do notice some significant peaks near the 75, 150 and 300 slots (i.e., 15, 30 and 60 minutes respectively), which could suggest that some rollups try to maintain a defined cadence when submitting data to the L1.
While the histograms are nice to visualize the detailed distribution, it is hard to get a clear vision of the real proportions. Thus, we plot the pie chart below which shows the slot distance distribution for all senders an all t3tx, including those with a distance over 10 epochs. We separate them in four categories depending on the distance N between consecutive t3tx from the same sender, where N can take the folllowing values:
- Next t3tx included in the same or next slot (Green)
- Next t3tx included within the next 32 slots (Orange)
- Next t3tx included between 1 to 10 epochs later (Purple)
- Next t3tx included more than 10 epochs later (Pink)
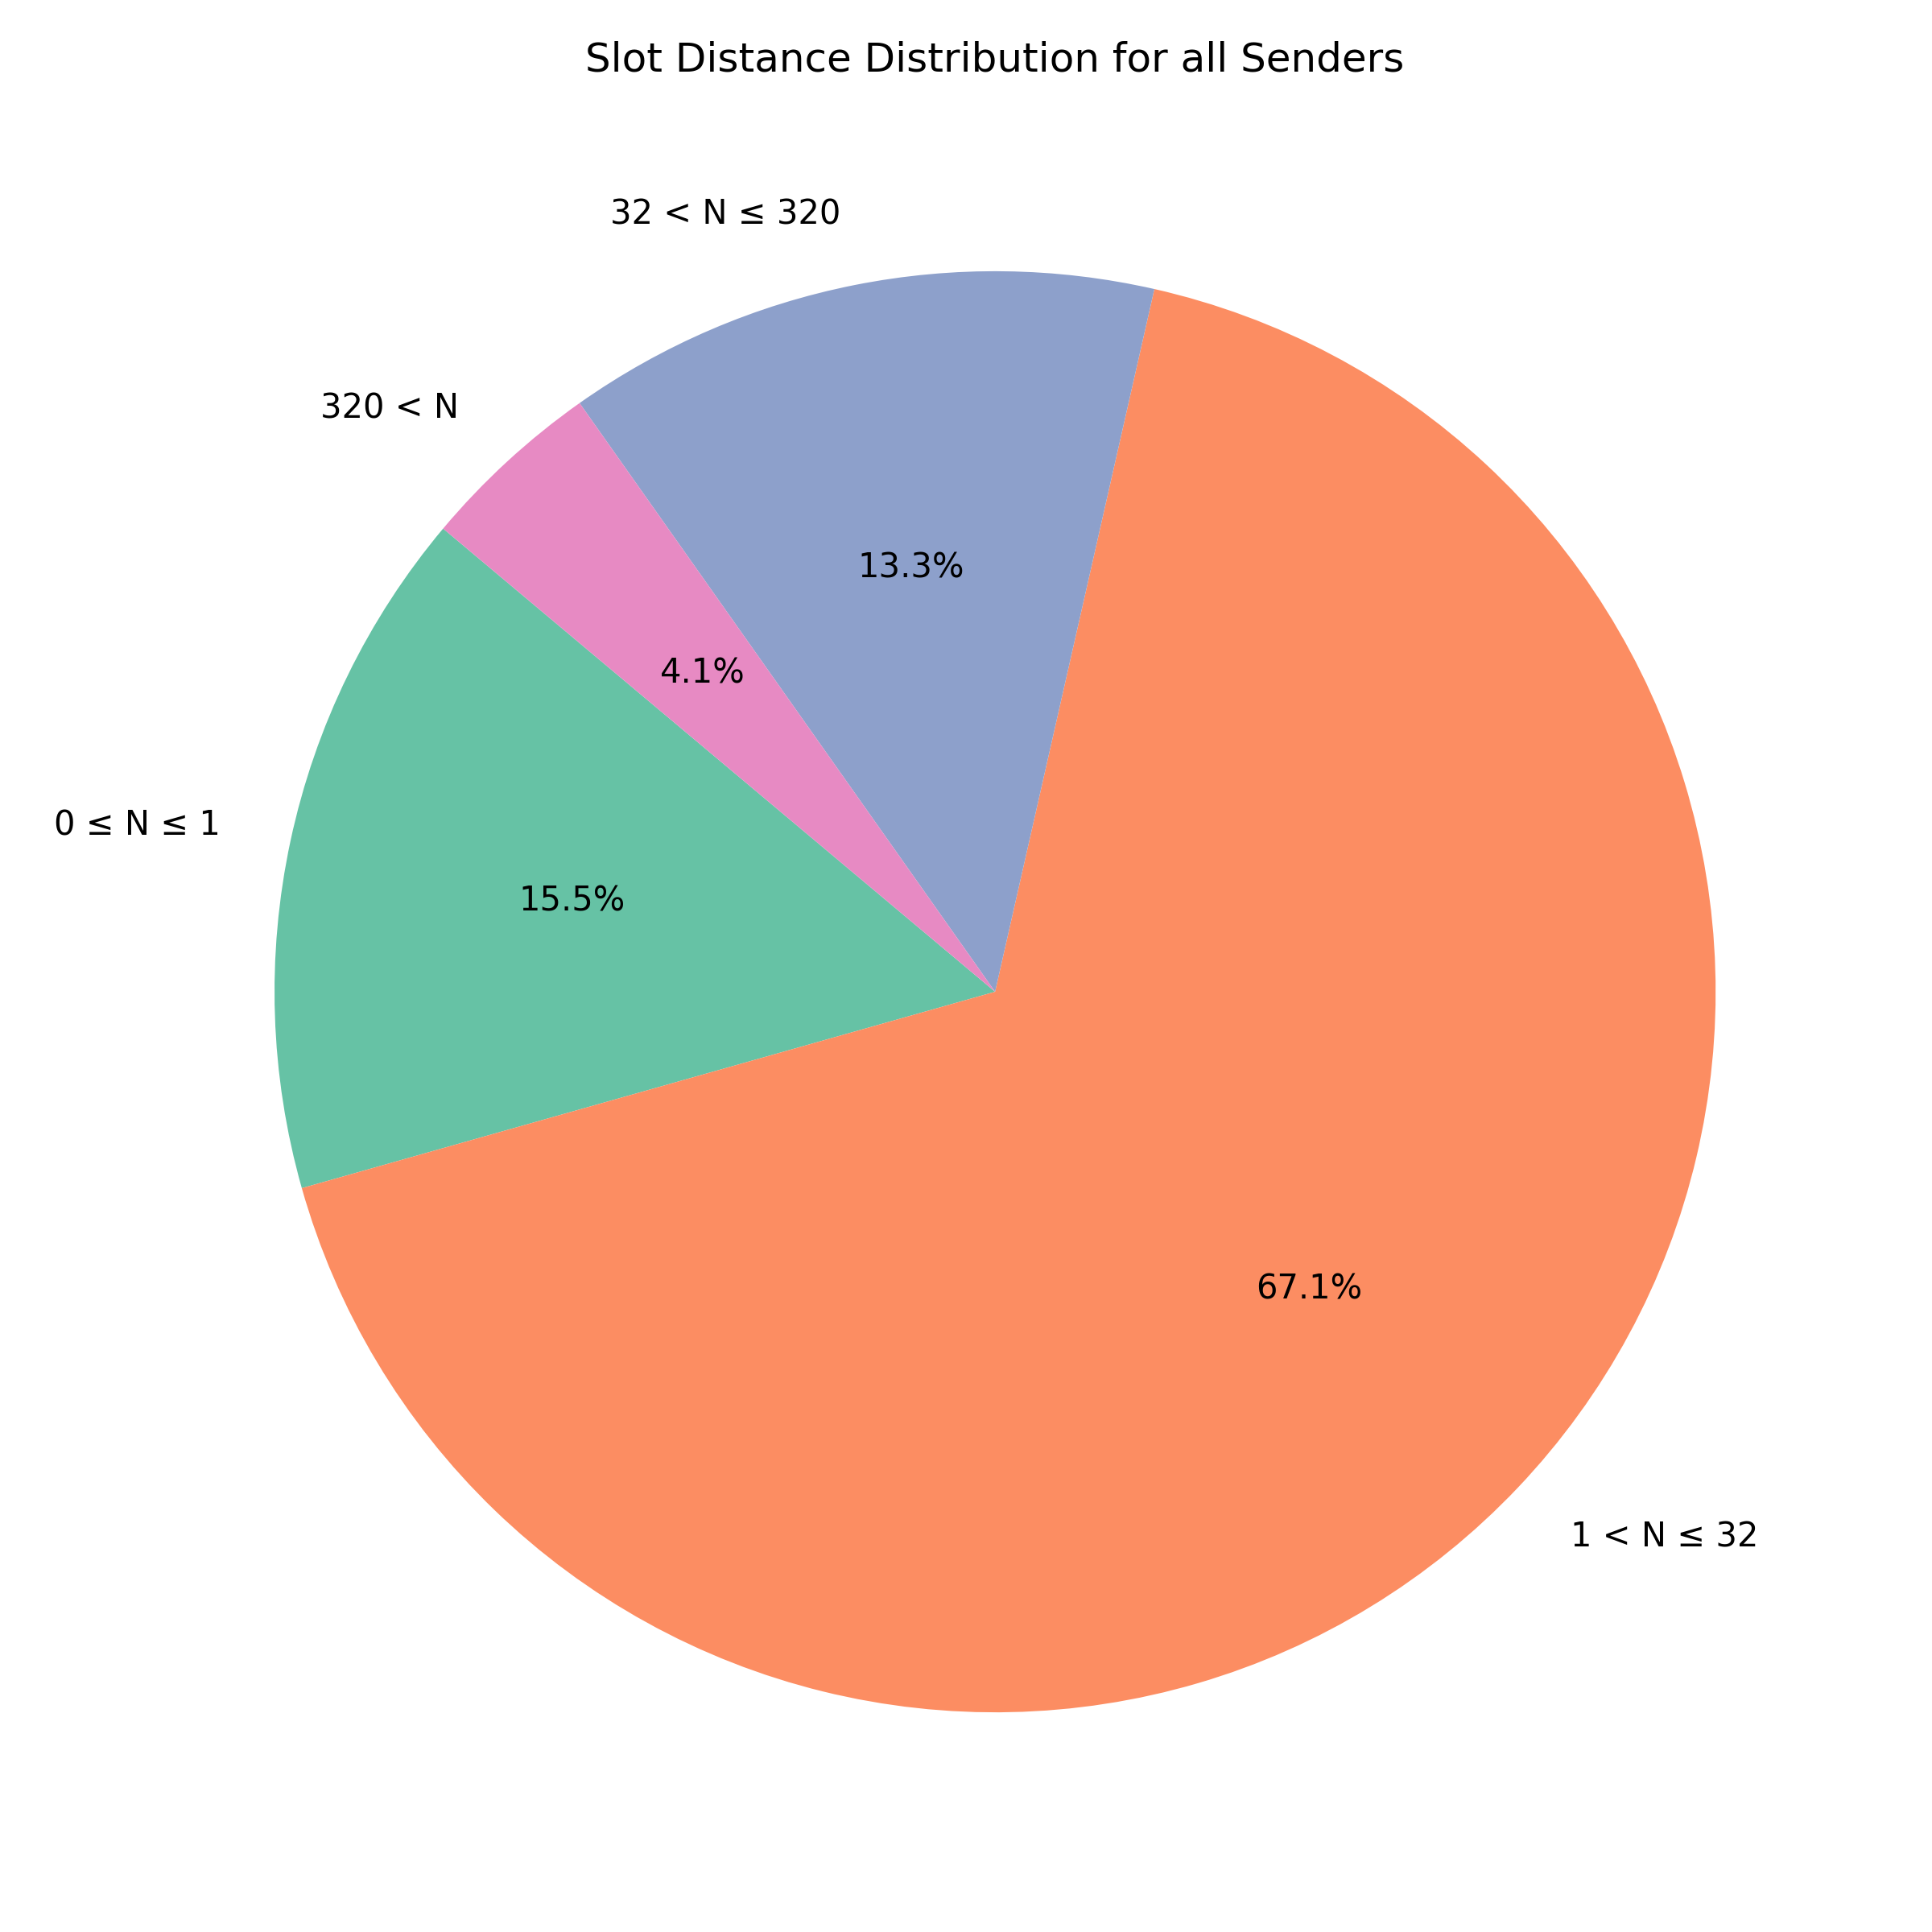
We can observe that only about 15% of t3tx arrive within the same or next slot — most are much more spread out. This matters particularly in the context of sharded mempools, where each node only observes a subset of all t3tx, typically determined by the node ID. If two very close t3tx from the same sender land in different shards, then a block producer with limited shard visibility could have issues including one of those t3tx if the previous one is in another shard. This can cause a delay in blob inclusion which is undesirable. From this study we can conclude that only about 15% of t3tx from the same sender land in the same or immediate next slot. While the other 85% of t3tx are sufficiently spread to not block each other in the scenario of a horizontally sharded mempool based on t3tx hash.
Conclusion
As Ethereum continues to evolve toward a more modular and scalable blockchain, analyzing the posting patterns of t3tx will remain key to optimizing data throughput, minimizing contention, and designing resilient transaction propagation strategies.
This analysis of one month of post-Pectra t3tx data reveals insights into the behavior of rollups and it has important implications for Ethereum’s scalability roadmap. T3tx have enabled a high-throughput data availability layer for rollups. Interestingly, only about 15% of consecutive transactions from the same sender occur within a single slot of each other. This shows that, while some batching behavior exists — especially among large infrastructure actors — most t3tx remain temporally dispersed. This dispersion has important architectural implications.
In emerging sharded mempool designs, where each node observes only a fraction of the transaction pool, closely timed transactions from the same sender that land in different shards could cause t3tx inclusion issues. If a block proposer sees only the latter transaction without access to the earlier one, blob inclusion may be delayed. This risk is low due to the low frequency of such tightly spaced transactions.
In addition, it is important to take into acount that a large part of institutional stakers are likely to run many validators per node and download all the shards maintaning a full vision of the blobpool. Another important point to take into account, is that rollups could potentially “mine” their consecutive t3tx so that they land in the same shard.