This study was done by @cortze and @yiannisbot from the ProbeLab team (probelab.io), with the feedback of the EF and the PeerDAS community.
Introduction
The Dencun upgrade was an important milestone for Ethereum’s roadmap. It introduced Blob transactions and Blob sidecars (through EIP-4844). The upgrade included major updates for the underlying network, which now has to share over GossipSub a target of three blob sidecars of 128KBs each per slot, caped to six of them as a maximum (often referenced as “3/6”, referring to target and max blob sidecars, respectively).
The current network hasn’t experienced any major outage or finalization difficulty since the upgrade. Nodes in the network could get along with the current blob target and max values with the blob sidecars propagating through the network well within the 4 second propagation window, as can be seen in ProbeLab’s weekly report on Block Arrivals: Week 2024-47 | ProbeLab Analytics.
However, with increased demand from L2s for more capacity, questions come up with regard to “what is the maximum “target/max” blob count that the network can comfortably handle?”, especially for home stakers.
The motivation and target of this study is to help define how much extra bandwidth is available in the network to support a blob target and max value increase for the next hard fork.
In this post, we:
- introduce the measurement methodology and framework we’ve prepared to estimate the available upload bandwidth of nodes in the network.
- present a comprehensive bandwidth measurement study that we carried out, where we measured the bandwidth availability of most online and reachable nodes in the Ethereum network over a period of 6 days from
2024-11-23to2024-11-28.
TL;DR
- 60% of nodes deployed in Europe or the US have bandwidth availability of more than 20Mbps, while only 20% of nodes deployed in Australia can go above 20Mbps. This is not related to line speed availability in Australia, but rather it is due to the fact that 65% of Ethereum nodes are located in Europe or the US and therefore geographically far from Asia-based nodes.
- Seconds 1 to 4 of the slot, when block propagation takes place, are clearly more loaded in terms of bandwidth availability. Nodes show 9%-13% less bandwidth availability during those seconds.
- However, even during the more loaded periods of the slot (1st to 4th second), our measurements from 4 different geographical regions indicate that the mean available bandwidth for nodes (either in cloud or non-cloud infra) stayed between 18 and 23 Mbps. This tells us that there is still space for more blobs to be carried, although this will result in even less bandwidth availability during this loaded part of the slot.
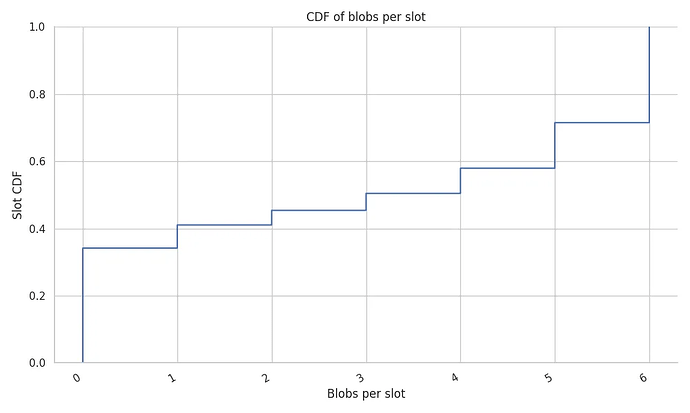
- During our 6 day measurement period, we’ve seen that 35% of the slots had no blobs at all, while 42% of the slots included 5 to 6 blobs. Given the current 3/6 target/max blob values, 42% of the bandwidth measurements we did were performed at almost the blob max capacity.
- With the current discussion around increasing the blob count from a target and max values of 3/6 to 6/9, the presented metrics align with the EthPandaOps recent post (link) that it should be a reasonable increase with the current network state. The network already has 50% of slots at the targeted blob count goal or beyond, while 35% of slots don’t even have associated blobs.
- At the same time, we expect that nodes will be stressed with regard to bandwidth availability during the 1st and 4th seconds of the slot, especially assuming the number of duplicate messages that Gossipsub inevitably propagates through the network. It is therefore critical to work on and apply bandwidth-saving improvements to Gossipsub, such as the ones discussed in the following GH issues and ethresear.ch, given that further increases in blob count will be needed in the near future:
Measurement Tooling & Study Preparation
We’ve built a tool called net-probe that:
- pulls node information from the Nebula crawler, which crawls the Ethereum
discv5network every 2 hours. - connects to each node discovered during the crawl through Hermes.
- downloads a carefully chosen volume of data from each node Hermes connected to.
Before executing the full experiment, we had to find out what’s the right amount of data we should be pulling from each node, in order to: i) saturate the node’s uplink and as a result find out how much bandwidth it’s got available, but at the same time, ii) avoid disrupting the node’s operation. Note that these are Ethereum mainnet nodes, so we had to proceed with care to avoid any disruption.
We tested the following parameters:
- Block-by-range RPC calls requesting:
1,510,20,30and40blocks, 10retries for the RPCs with1,5,10, and20blocks,5retries for the RPCs with30and40blocks, to avoid spamming those peers.
Setting the RPC size
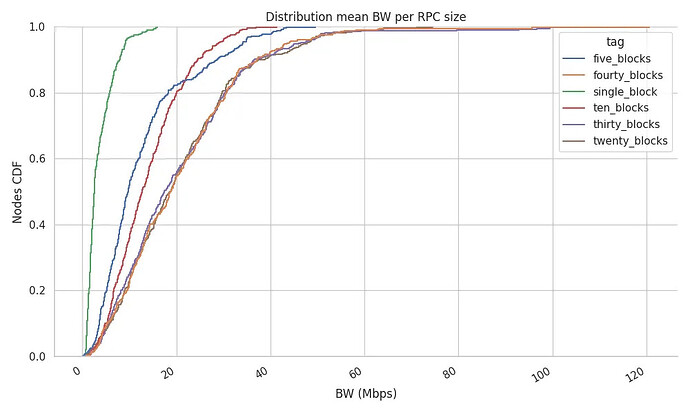
The following plot shows the bandwidth we could measure (x-axis) for the nodes we managed to connect to for different RPC size requests, i.e., different number of blocks requested per RPC.
We extract the following conclusions from the comparison of the different test studies:
- Sending RPC calls for
1,5and10blocks gives widely different results, with higher RPC size requests showing more bandwidth availability. This is a clear indicator for increasing the “blocks requested per RPC” value, as we don’t seem to be saturating the nodes’ bandwidth with smaller RPC calls. - The CDF plot shows that the BW measurement barely changes when we request
20,30or40blocks per RPC, indicating that this RPC size seems to generate enough traffic on the TCP connection to saturate the uplink bandwidth of nodes.
NOTE: the mean size of the 54,463 downloaded blocks was 101.30 KB of serialized data and 47.76 KB of compressed data.
Setting RPC retries
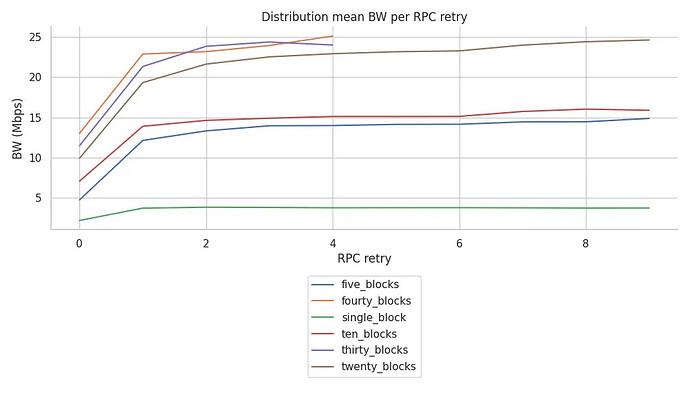
As expected, there are also some differences in the bandwidth availability (y-axis) observed after consecutive RPC retries (x-axis in the following plot):
- The first 2 RPC responses do not max out the available bandwidth in the TCP connection (see upward trend of line-plots).
- After the 3rd one, the measurements become pretty stable for most RPC sizes, i.e., the trend is flattening.
- The above plot gives the impression that larger RPC-sized requests result in higher BW availability.
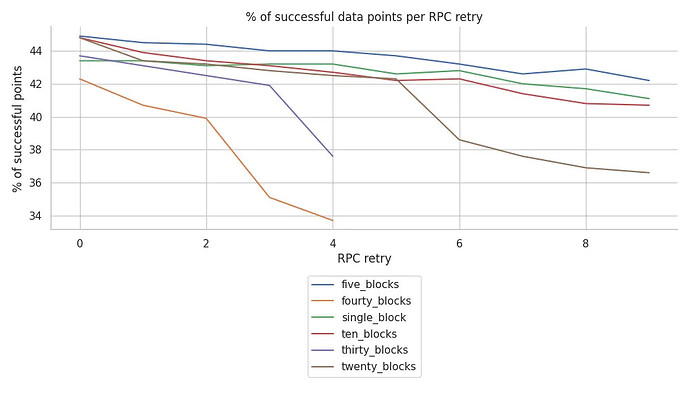
- However, taking into account the ratio of requests that are successful at each RPC retry, we see that requesting a larger number of blocks does have an impact on the success rate of the responses. For example, requesting 30 or 40 blocks starts failing after the third retry. Furthermore, requesting consecutively larger RPCs also generates a faster decrease in the success rate over the RPC retries.
Final parameters
Given the above observations, we have chosen the following values for our production study:
- Retries:
6sequential RPC Requests - RPC size:
20blocks per retry - Request concurrency of
2nodes at a time - Dates:
2024-11-23to2024-11-28 - Infrastructure: AWS EC2 instance from the following regions:
us-west-1- Californiaus-east-2- Virginiaeu-central-1- Frankfurtap-southeast-1- Sydney
- Resulting statistical sample:
- The results we present in the following were obtained from a total of
13,023unique peers from theNebulaEthereum database for 6 days (unique online peers over those dates). - We collected BW measurements from
9,179nodes, representing 70,48% of the total online and reachable nodes.
- The results we present in the following were obtained from a total of
Analysis of the bandwidth data
Overall Bandwidth Availability Results
NOTE: The tool can measure 3 different types of BW measurements:
- the effective BW: the bytes of serialized data we could measure,
- the compressed BW: the bytes of compressed data we could measure,
- the wire BW: all the bytes shared over the wire.
For simplicity and completeness, the rest of the report will refer to the “wire BW”.
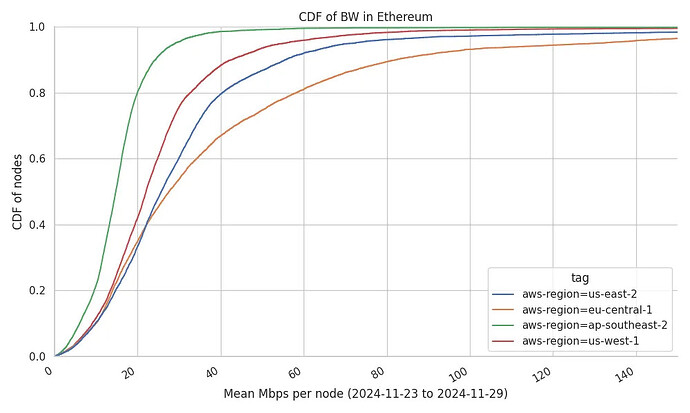
The following plot shows the CDF of the mean wire BW we measured from the 9,179 unique nodes net-probe could successfully connect over these 6 days. The graph shows the BW measurements experienced from each region net-probe was running on, so the figure can be read as follows:
- The BW measurements from our
net-probedeployments in the US and Europe show that 40% of the network peers served blocks at a rate below ~20Mbps. This also means that the remaining ~60% of nodes had an upload capacity of more than ~20Mbps. - Meanwhile, our
net-probedeployment in Sydney could only achieve 20Mbps upload speed with 20% of network nodes (see 0.8 mark on the y-axis for theap-southeast-2region). This is not surprising, given that the geographical distribution of nodes we observe at ProbeLab shows that almost 65% of the network nodes are deployed in the US and Europe.
CDF of the wire bandwidth for each of the nodes 9,179 successfully connected. Please note that the graph is zoomed within the 0 to 150 Mbps range.
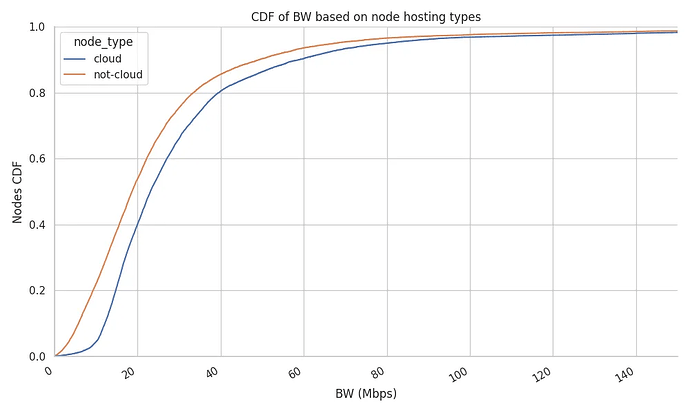
Bandwidth Availability per Infrastructure Deployment (cloud vs non-cloud)
In the following plot, we present the bandwidth observed for different types of node deployments, namely, those that are hosted on public cloud infra versus those that are not.
We observe that nodes operating in cloud providers provide blocks at a higher upload BW rate, having approximately 5Mbps of extra bandwidth available, compared to non-cloud deployments.
This marginal difference in bandwidth availability between cloud and non-cloud deployments shows that solo stakers (most likely to use non-cloud infra), are putting enough resources into their node deployment.
CDF of the wire bandwidth segregated by the nodes’ hosting type ( 4,409 cloud vs 4,770 non-could nodes).
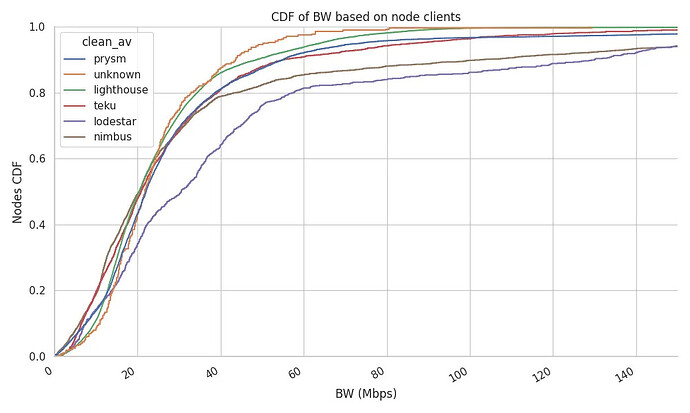
Bandwidth Availability per Client Implementation
Comparing the upload bandwidth by the client implementation of the remote nodes, the following image shows that most clients share similar distributions until the 70th percentile, with the exception of Lodestar, which we discuss below. From that point on, the differences in the distribution’s tail become slightly more visible.
Our takeaway points from this measurement are:
- No major differences between different client implementations in terms of bandwidth availability.
- Lodestar seems to be outperforming the rest by at least 10Mbps at the 60th percentile.
- Lodestar’s improved performance is very likely due to the fact that more than 80% of its nodes are based in the US or EU (link), which as we’ve seen earlier present higher bandwidth availability.
CDF of the wire bandwidth segregated by the nodes’ client.
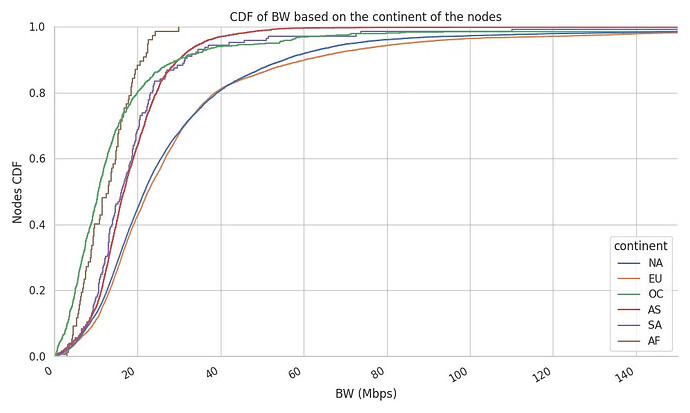
Bandwidth Availability per Region
Bandwidth measurements, as well as latency measurements, are highly subjected to the location from where the data is being generated. Thus, we’ve chosen our net-probe deployments to represent: the most popular regions for Ethereum node deployments (US and EU), and the one geolocated the furthest (AUS). The following image provides the CDF of the wire BW of nodes from the four regions aggregated by continents. The measurements indicate that, as expected, regions further away present lower bandwidth availability. In this case, we observe that:
- Oceania and Africa are at least 8 to 10 Mbps behind the rest of the regions, providing a non-desirable 90th percentile below the 20 Mbps mark.
- Nodes in Asia and South America achieve 15 to 25 Mbps between the 50th and 80th percentile.
- Nodes in Europe match the BW distribution of NA nodes until the 40th percentile, which later diverted towards a median of 24 Mbps up to the 90th percentile of 60 Mbps.
CDF of the wire bandwidth segregated by the nodes’ continents
Bandwidth Availability per Slot Window
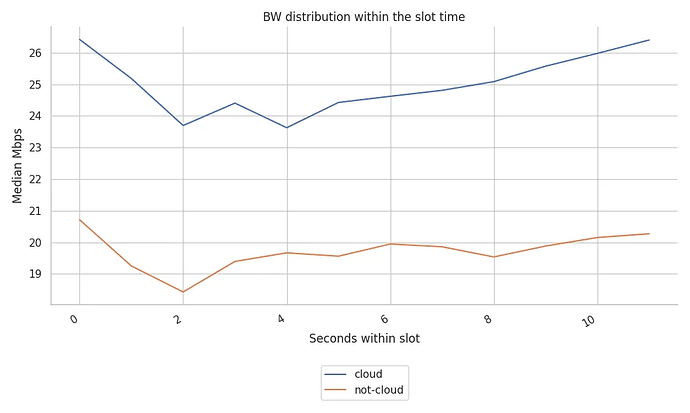
Each Ethereum slot is split into different parts each of which is allocated to different duties over the 12 seconds slot duration. Trying to correlate the available wire BW across the slot time, the following image shows the mean wire BW availability of nodes for each node hosting type at each second within the slot. We observe the following:
- Cloud-hosted nodes have a higher mean of available BW, but both cloud and non-cloud nodes’ portion of available bandwidth fluctuates visibly throughout the slot.
- There is clearly less bandwidth availability from the 1st to the 4th second of the slot, which is the window when blocks and blobs are broadcasted to the network. The bandwidth drop we were able to measure represents a 9,5% to 10% drop for non-cloud users, while it was a 13% of bandwidth reduction for nodes located in data centers.
- Despite this drop in the mean amount of bandwidth available, there is still ~19Mbps for non-cloud hosted nodes and ~23Mbps for cloud hosted nodes available. This is a strong indication that a slight increase in the blob count target and max values should not be disruptive to the network.
Mean wire bandwidth availability per deployment type over time within the slot.
RPC Success Rates Throughout the Slot
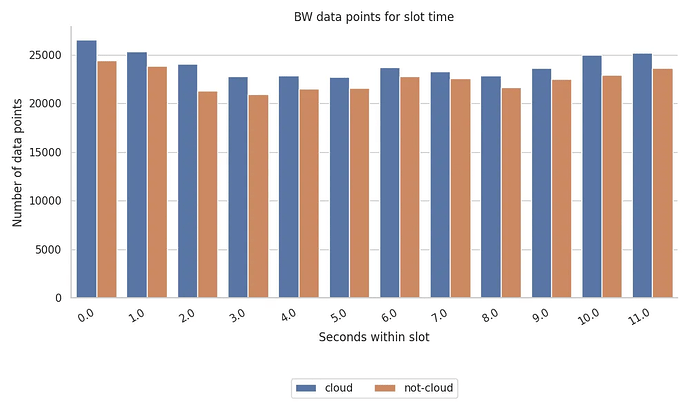
As a byproduct of our study, we captured the number of successful RPC replies that we got throughout the slot, presented by the “Number of data points” available to us. There is a dip in the number of data points (i.e., successful RPCs) between the 2nd and 7th/8th second of the slot when blocks, blobs and attestations are getting broadcasted, propagated and processed.
Histogram of the successful data points at each slot-second.
Current blob count per block
Having seen node bandwidth availability from several perspectives, it is important to understand how many blob transactions have been included in blocks during the measurement period. This aspect is important in order to asses what are the implications of a blob count increase, i.e., how many blobs resulted in the bandwidth availability that we’ve seen and how much space is there for extra blobs.
The following graph shows the number of blobs that were included in each slot throughout the 6 days of study. Here are our observations:
- 35% of the slots had no blobs at all.
- 42% of the slots included 5 to 6 blobs.
- Given the current 3/6 target/max blob values, 42% of the bandwidth measurements we did were performed at almost the blob max capacity.
- Assuming demand will keep up when the blob count target and max increase to 6/9, we can project that in ~42% of the cases there will be 9 blobs per block and in ~50% there will be 6 blobs per block, or less.
Given the above, our take is that we don’t see any critical objection to the current desired blob target and max values of 6/9 discussed in the All Core Dev CL Call on Thursday 28th of November.
CDF of the number of blobs per slot.
Conclusions
From this extensive set of measurements, we extract the following conclusions:
- Representing the perspective of at least 65% of the network (nodes in NA and EU), we’ve measured that only 30% to 40% of the measured peers reported an upload link below the 20 Mbps mark.
- On the other hand, when nodes are located in more remote locations like Sydney, only 20% of connections went above 20 Mbps.
- We need to keep in mind that this available BW is effectively doubled if we consider that 80% of the blocks achieve at least a snappy compression rate of 2.
- Nodes deployed in cloud infra seem to have at least 5 Mbps more bandwidth available than non-cloud nodes.
- The measured bandwidth throughout the slot time shows that there is, on average, a 9% to 13% drop in bandwidth availability between seconds 1 and 4.. The precise moment where the block plus blobs are meant to be broadcasted to the network.
- We could spot a slight decrease in the success rate of the RPC requests we sent during the “busy” moments of the slot, which could affect, to some degree, the sampling of blobs in PeerDAS.
- With the current discussion around increasing the blob count from a target and max values of 3/6 to 6/9, the presented metrics align with the EthPandaOps recent post (link) that it should be a reasonable increase with the current network state. The network already has 50% of slots at the targeted blob count goal or beyond, while 35% of slots don’t even have associated blobs.
