Casper: The Fixed Income Approach

Casper FFG: Returns, Deposits & Market Cap

Link to working draft which includes images

The Fixed Income Approach

The proposed approach for incentivizing Casper largely follows fixed income asset modeling. In a fixed income asset, there’s a fixed amount of income that is paid out in regular intervals. Any qualifying actor can choose to participate or leave the mechanism, which determines the yield (income as a % of deposits) of the participants. The more demand there is, the yield becomes competed away and becomes lower. The less demand there is, the higher the yield becomes.

This allows for two key things. First, it is a natural way for the market to determine the required return for a validator set. If the market determines the mechanism to be “risky” enough for a 5% return vs a 15% return or a 50% return, we will be able to observe that empirically by observing the participation of the validators (explained further below). Second, once we have a good understanding of the required return for a given game, we can incentivize a desired level of total deposits in the network by setting the corresponding fixed income reward.

1. Required Return as Determined by the Market

Let’s take a simple example. Let’s say Bob loans Alice $1,000 and says the interest payment is $100 per year for five years. At that moment, Alice’s perceived annualized “discount rate” or required return for this investment is 10% ($100 / $1000).

Now let’s assume that this contract can be bought and sold openly. If others believed that a 10% yield is a good deal, then they’d be willing to pay Bob more than $1000 for this piece of paper. Let’s say Connor buys the contract for $1100. It still pays $100, but now the yield is 9% ($100 / $1100). Conversely, if it turns out Alice just missed a credit card payment, people might view loaning money to Alice as a risky endeavor, and sell it at a lower price of $900 to derisk their position–increasing the yield to 11%.

Therefore, a fixed income asset is an ideal instrument to assess the perceived market risk of a given game. For an early version of Casper, you might imagine, we can set Y(1, 0, TD) = \frac{Fixed Income}{TD} to test the yield (with a hypothesis, of course). For a given fixed income, it will attract a commensurate amount of TD to reflect the “risk” associated with the mechanism.

2. Incentivizing a Total Deposit Level

Once there’s a strong hypothesis or empirical evidence of the mechanism’s required return, the mechanism designers can incentivize a desired total deposit level for the network.

So, let’s say that the desired total deposit level is $100M and the previously observed annualized validator yield is 20%, then the architect may target a $20M annual sum of rewards. That way, if the deposit level is lower (say $80M), then then excess returns to the validators will attract more deposits to participate in the network to capture that excess yield, which will drive towards the desired total deposit level.

[If bootstrapping the network, we can set a progressive reward increase with an asymptote at the targeted reward level (i.e. $20M in the example above) so that the initial rewards aren’t excessively high. ($20M reward with $1M deposits would return 20x, which would be too much). For example, the mirroring mechanism here could be a target max return (“size of the carrot”). For example, we could have a max incentive yield of 50%, so every time the market approaches 20% yield with TD < desired level, we can boost up the yield back up to 50% (but ideally a smoother version of this).]

3. Total Deposits vs Market Cap

The total deposit level that will drive the fixed income level shouldn’t be thought of in dollar amounts but more precisely as a % of Market Cap, since that is the value that the validators are ultimately trying to protect. So depending on the security constraints and design decisions, one may have–for example–anywhere between 1-25% as a target for TD/MarketCap.

Let’s say that target is 1% during an early hybrid implementation such as the first FFG implementation. Then, at a $30B market cap, that would be about $300M in deposits (~1M ETH) and at a 20% yield level, that would mean $60M in (200K ETH) awarded annually via issuance (fixed level, implying ~0.2% incremental issuance to current levels).

Lastly, the change in the market cap (i.e. the price of ETH) affects the required return mentioned in part 1 because the required return of the validator is more precisely the sum of appreciation of ETH + validation yield (full circle!). In sum, required return of validators, total deposits and market cap all have a dynamic and interrelated relationship.

Summary

This relationship between required returns, total deposits and market capitalization will be instrumental in understanding the “monetary policy” levers available to the mechanism designers.

Also related to this, we will be posting some thoughts on CAPM, standard deviation of validator returns, soft/draconian slashing and required returns.

1 Like

OK, so this is what I in my previous paper call the p=1 approach. The formula was

interest_rate = k / total_deposits^p

With p=1, that becomes a simple

interest_rate = k / total_deposits

The other main alternatives are p=0 (fixed interest rate), p=0.5 (what we’re currently doing) and p=infinity (consider this as the limit of k and p going to infinity at the same time; basically, this is a policy that targets some specific total deposit size, and if the actual deposit size is different then it keeps lowering or raising the interest rate as much as needed to achieve the given target).

As I see it, the main tradeoffs are as follows:

(i) As p gets closer to 1, you maximize certainty of the issuance rate.
(ii) As p goes higher, you maximize certainty of the deposit size (note that for p<1, (i) and (ii) are in harmony, for p>1 they are in conflict)
(iii) As p goes lower, you reduce effects where if validators drop out remaining validators’ revenue goes up, which could create selfish mining-like attacks.

Personally¸ my intuition still favors 0.5 :slight_smile:, but I’d be interested in seeing the case for different values of this hashed out.
2 Likes

Thanks for the thoughtful response. Enjoyed pondering the tradeoff exploration with respect to p.

Context

For reference, found the approach you’re referring to in the previous paper. You are right that it is a specific instance of: BP(TD, e - e_{LF}) = \frac{k_1}{TD^p} + k_2 * [log_2(e - e_{LF})] (Didn’t realize we had set on 1/2 for p)

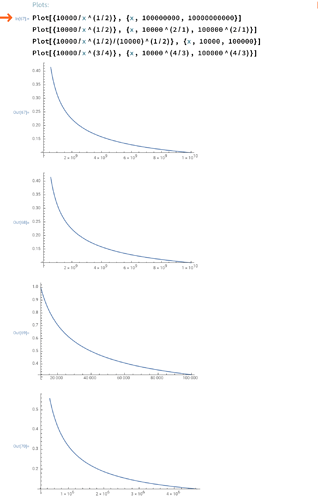
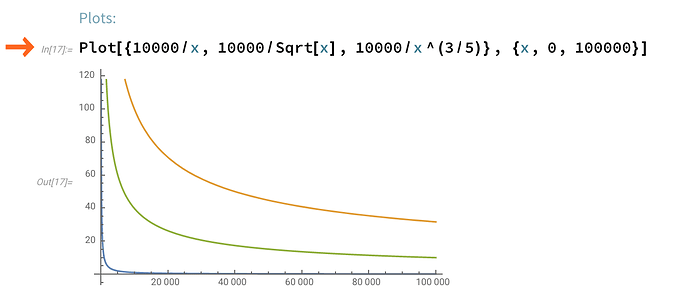
As we discuss, here are the plots for reference for various p values and constant k:


(blue is p = 1, green is p = 3/4, orange is p = 1/2)

Additional Consideration for p

While I will further study the merits of the p = 1/2 vs p = 1 approaches, the reason why I began thinking about the problem in p = 1 is for simplicity’s sake. For illustrative purposes, let’s consider modeling each case in the interest rate = constant / total deposits ^ p framework.

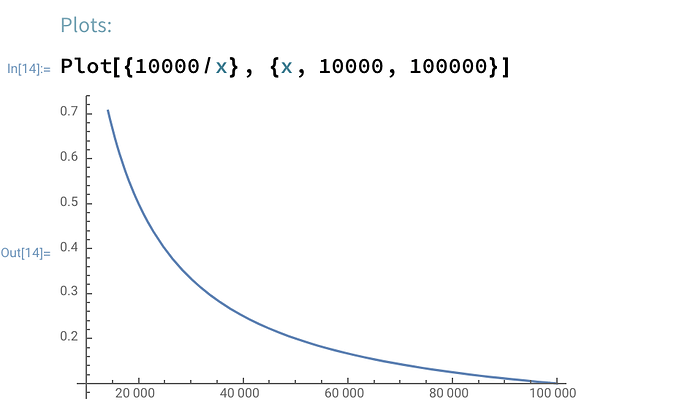
For p = 1, any k/TD value is simply the periodic interest rate. For instance, from {x, 10000, 100000} and k = 10000, we can observe the interest rate getting competed away from ~100% down to ~10% as more deposits enter the validator set (graph range truncated).

In contrast, we must apply a transformation to observe the TD to interest rate relationship for p = 1/2. More precisely, to observe the same drop in interest rate from 100% down to 10%, we have to adjust the x-axis by the \frac{1}{p}th power, or–alternatively–the function by a factor of k^\frac{1}{p} to observe the same order of magnitude change in interest rate.

While analytically straightforward, I found it less intuitive to reason about the interest rate to TD relationship for p = 1/2.

Takeaways

Perhaps a reasonable hybrid approach is to model the TD target in terms of p = 1, and as a final step we can dial in the desired convexity of the function around the desired TD and transform the k value accordingly.

We can find a p value that brings a gradual yet compelling ramp to the target TD level without being so “forceful”, which would likely create more deadweight losses than a “smoother ramp.” That said, I think it is important to err on the side of predictable TD and interest rate relationship to enable monetary policy decisions.

Furthermore, in the context of bootstrapping, we could use a very loose ramp (i.e. lower p-values) to make sure we’re not prescriptive about the required returns. This would allow us to more accurately assess the perceived required returns by the validator set. Once this is measured for a given mechanism, we can tighten up the ramp (i.e. higher p-values) to more accurately target a given TD level to secure the Ethereum network at any given market cap. (For example, if TD doesn’t grow alongside market cap, the implied economic security level could be capped and limit the growth potential of ETH long-term).

2 Likes

That’s a good point and a subtle tradeoff between p=1/2 and p=1. i.e. “weaken” the relationship between my returns as a validator and another validator’s participation (weighted by deposit size obviously). Note to self to think about this aspect more deeply. Just to confirm, that’s the main factor that makes you bias towards a lower p value than 1, correct?

3 Likes

Personally, I’d ideally like to design a mechanism where the economic parameters can last for more than 100 years, weathering different kinds of economic conditions, fundamental changes in technology, etc. So I think fine-grained targeting may not be the best idea; we want to have parameter sets that are robust against as many changes in conditions as possible.

Yes.

1 Like

Can we construct p such that:
p = f(% of validators participating in last x blocks, target total deposit value)

When % of validators in last X blocks is low, the function would react by setting p ~ 0.5 and holding it this way for y blocks. After y blocks, p is raised to p > 1 to achieve a target deposit rate. The effect of this is that in the short term, validators are penalized if individual validators drop out. But in the long term, the incentive for more validators to join is maintained.

The f() would look something like an inverse tangent with the inflection point happening at y blocks. Could probably balance incentives by managing the areas before and after the inflection point.

1 Like

The total deposit level that will drive the fixed income level shouldn’t be thought of in dollar amounts but more precisely as a % of Market Cap,

Ok, so it seems like you’re saying Total Deposits target = some target % of all issued ETH.