Acknowledgements
This research has been granted by Chorus One. We are grateful to M. Moser for useful discussions and comments.
1 Introduction
There’s a lot that’s been said about client diversity in the Ethereum ecosystem. A diverse set of clients (at the consensus layer, and even at the execution level) is one of the first line of defense strategies in the face of unforeseen events, prioritizing the liveness of the network and allowing for its self-healing properties. A level of decentralization of block production is necessary for this dynamic liveness, which can be appreciated at many levels (geographical, organizational, and during software development). Even when there is a single supermajority client, Ethereum can survive many liveness faults due to the use of different Ethereum clients in the network. Not all the risk scenarios are perfect, but it is one of it’s greatest strengths.
Blockchains are complex coordination systems, and Ethereum is no exception. The underlying rules are defined in a single, open-source specification, freely accessible for anyone to contribute to. This core concept is separate from the various software programs individuals and institutions use to run nodes on the network.
The importance of client diversity
Ethereum’s on chain incentives (and penalties) strongly encourage diversity among client deployments and infrastructure. The more validators rely on a single type of client software, the greater the risk of a single point of failure in case of a critical bug.
We can consider for a moment what would happen in such an event:
- In the case of a liveness fault, most BFT networks will stall and not make progress when 67% of the network’s nodes are affected, thus there’s no point in having a minority client. In the case of Ethereum, it will allow the minority clients to produce blocks that make it into the chain, even if finalization is stalled for hours or days.
- In the event of a safety fault, the network behaves quite differently. Such a bug in the supermajority client (67%) can quite quickly lead to erroneous confirmation. Finality of the corrupted chain could then put the entire Ethereum community in a serious dilemma. Many of the affected validators could be slashed by trying to join the correct chain, a catastrophic development that puts many node operators at risk.
If the majority does not exceed that 67% threshold, a bug in a single client cannot be finalized.
The importance of client diversity
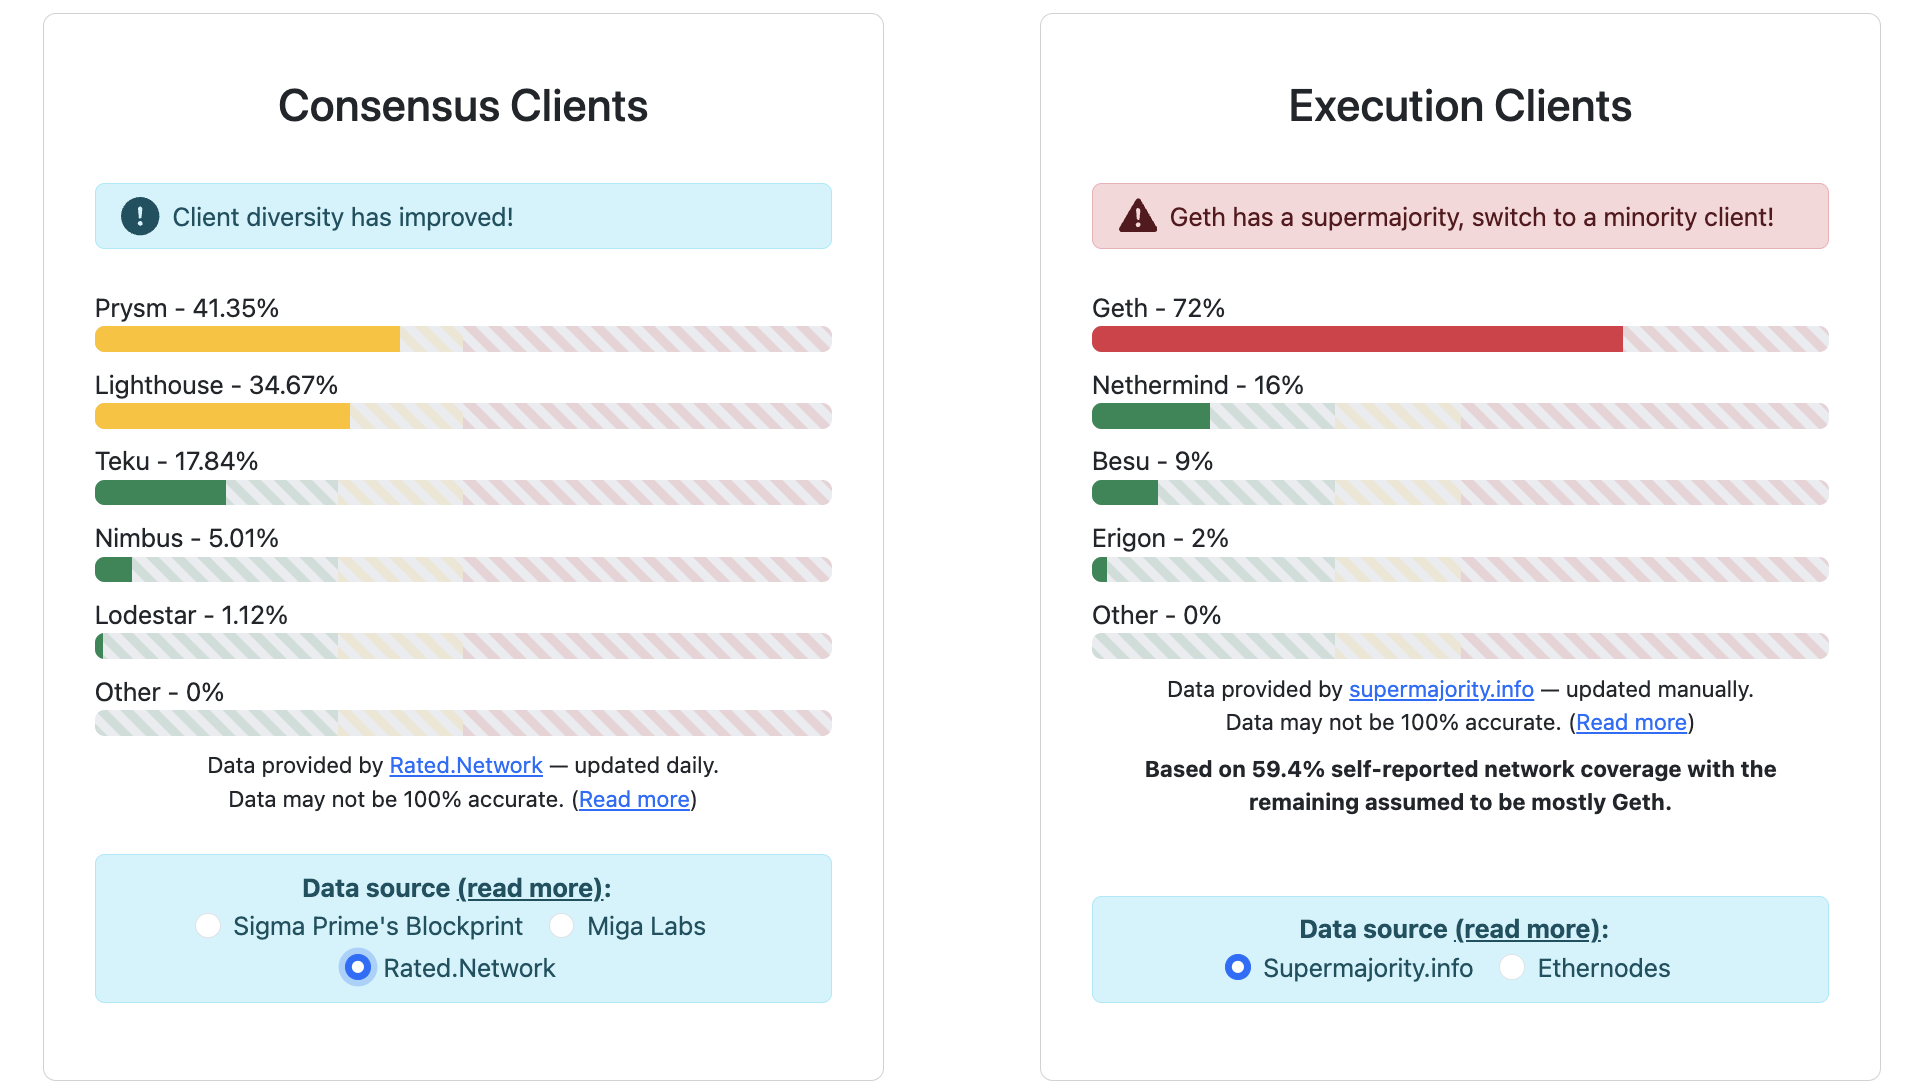
Fig. 1: A somewhat naive but useful look at the current status of client diversity. Source: https://clientdiversity.org/
True client diversity is not as simple as avoiding the majority client. Alongside issues in fingerprinting and a reliance on self-reporting, the real status of client diversity for CL and EL clients is difficult to pin point with exactitude. The previous chart proposes a view of network diversity that highlights a concerning prevalence of the Geth execution client, and a less than ideal distribution in the consensus layer.
But what if a majority client consistently proposes the best blocks for the network, due to a more efficient, faster or more sophisticated implementation?
A final, sometimes overlooked, point about having different clients is that it fosters innovation. Outside of the clear rules for confirmation, different teams can propose and implement changes to the Ethereum protocol. Today we want to focus on the performance effects of client diversity, by sharing an analysis on two of it’s most widely used CL clients: Lighthouse and Teku. The goal is to contribute to a better understanding and stability of the entire Ethereum ecosystem, and to consider potential improvements that can mitigate second-level effects for validator behavior and diverse participation.
2 Are CL clients made equal?
The role of CL clients in the Ethereum ecosystem is critical to maintaining the integrity and efficiency of the blockchain. Among their responsibilities, we find the production of attestations and management of networking. These functions directly influence the overall effectiveness of validators, which in turn affects the robustness and reliability of the network. In this section, we aim to scrutinize the performance of Lighthouse and Teku, with respect to these core duties.
We collected data from 2024-01-11 to 2024-02-27 using the Rated Network API, focusing on the aggregate performance of Chorus One’s validators during this period.
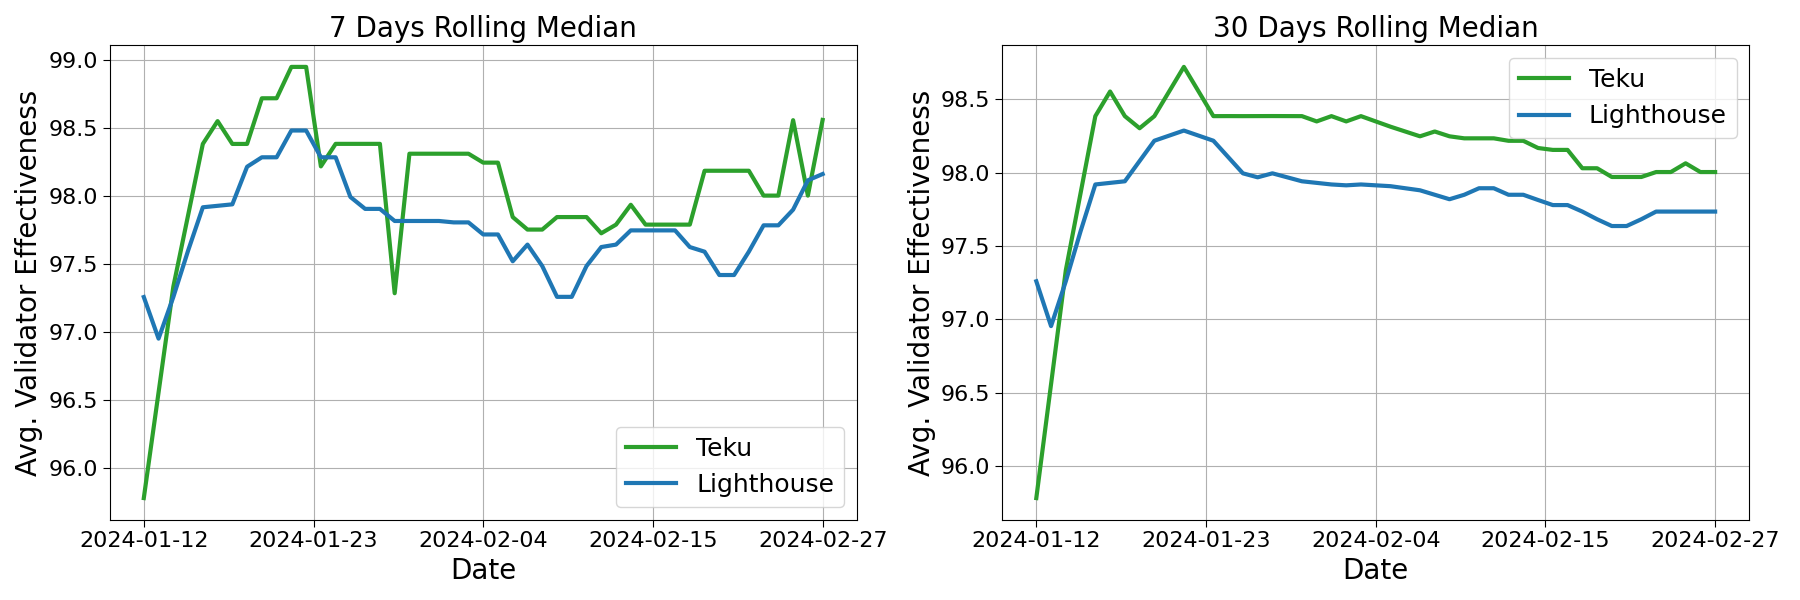
Fig. 2: Daily rolling median of avg. validator effectiveness for Chorus One validators from 2024-01-11 to 2024-02-27. Data from Rated Network.
Figure 2 shows the rolling median of daily validator effectiveness distribution for these two clients. Despite the overall behavior being clearly correlated — primarily due to a combination of our infrastructure and network performance — a noticeable divergence exists in the performance of validators associated with these clients. Validators utilizing the Teku client consistently outperform those utilizing Lighthouse, as evidenced by both 7-days (left panel) and 30-days (right panel) rolling medians of effectiveness.
When accounting for the daily distribution, we observed no significant anomalies that could be attributed to transient network effects, which might otherwise bias the outcome of the study. This daily granularity allow us to confirm that the observed performance disparity is consistent, and not a product of temporal network fluctuations. Preliminary findings suggest that the Teku client facilitates a higher level of validator effectiveness compared to Lighthouse.
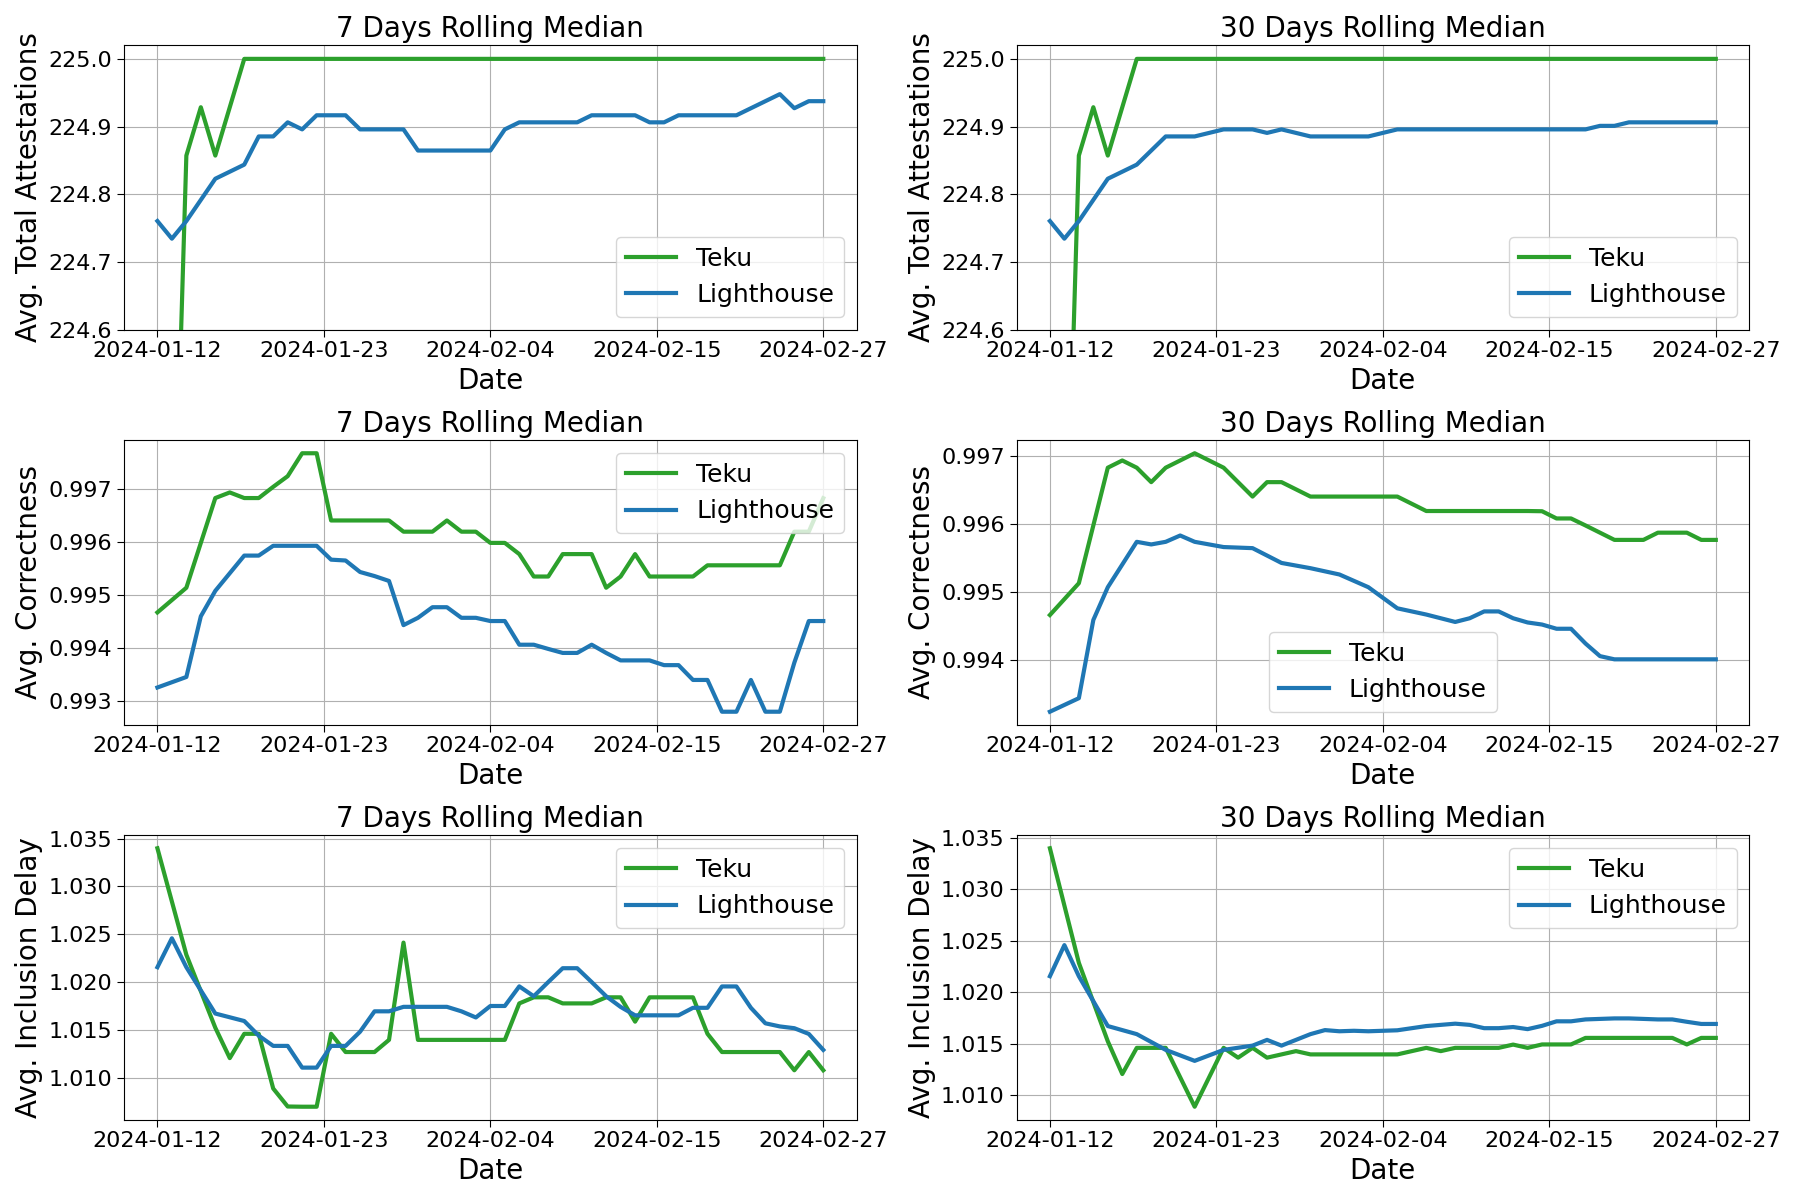
Fig. 3: Daily rolling median of avg. total attestations (upper panels), avg. correctness (middle panels), and avg. inclusion delay (lower panel) for Chorus One validators from 2024-01-11 to 2024-02-27. Data from Rated Network.
Figure 3 shows the relevant metrics that contribute to shape the final validator effectiveness. To be precise, we show the rolling median of average total attestations (upper panels), average correctness (middle panels), and average inclusion delay (lower panel) for Chorus One validators from 2024-01-11 to 2024-02-27. Analyzing the different metrics separately suggests that the primary disparities between the two CL clients lie in the number of attestations and their correctness, with the inclusion delay differences being less significant in comparison. However, it is worth noting that, despite the small difference in the median of inclusion delay, Teku still seems to perform better. The consistent disparity translates in a non-negligible effect on the final validator effectiveness.
On a side note, also the daily rolling median of average uptime indicates a better network response for Teku validators, cfr. Fig. 4.
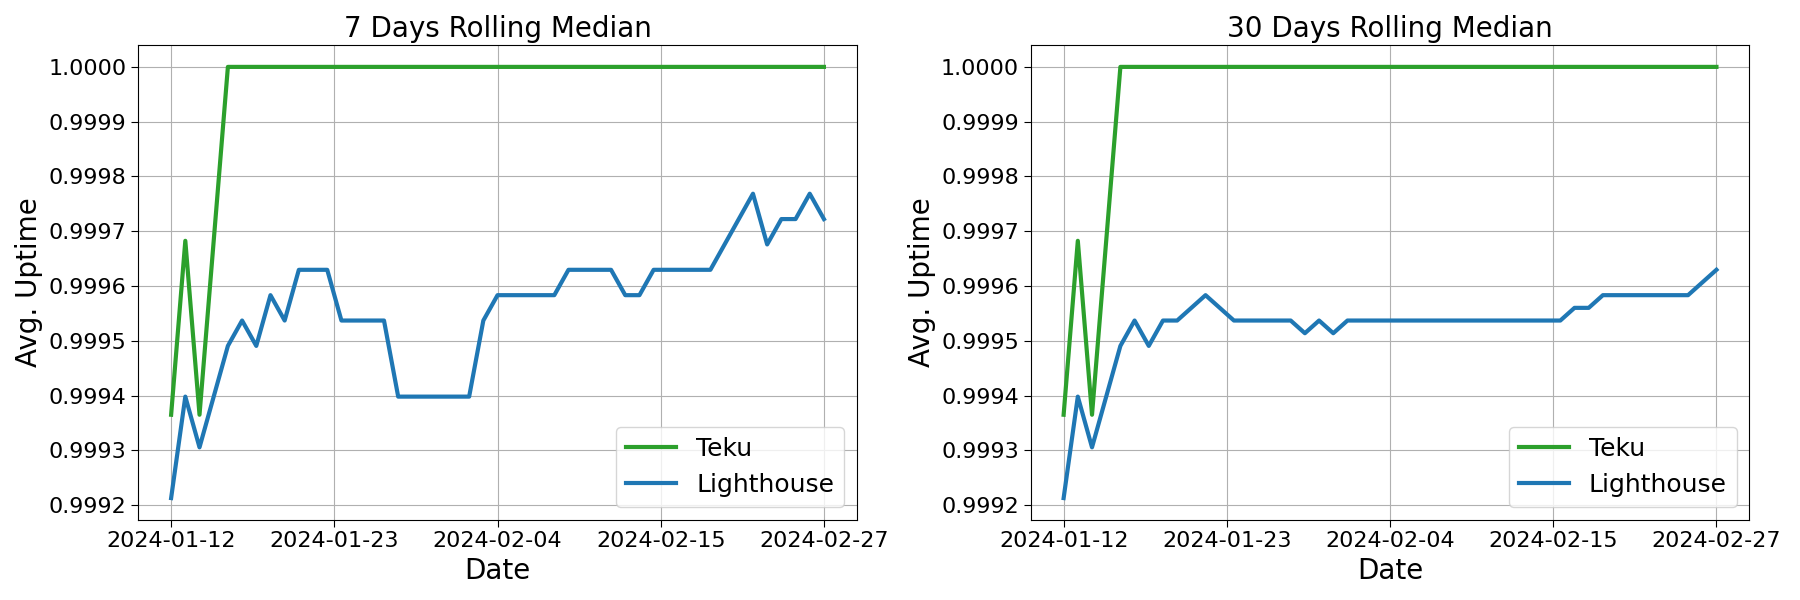
Fig. 4: Daily rolling median of avg. uptime for Chorus One validators from 2024-01-11 to 2024-02-27. Data from Rated Network.
We then compared the overall distributions for each validator in the sample, removing the dependency on the specific day. The outcome of this is shown in Fig. 5.
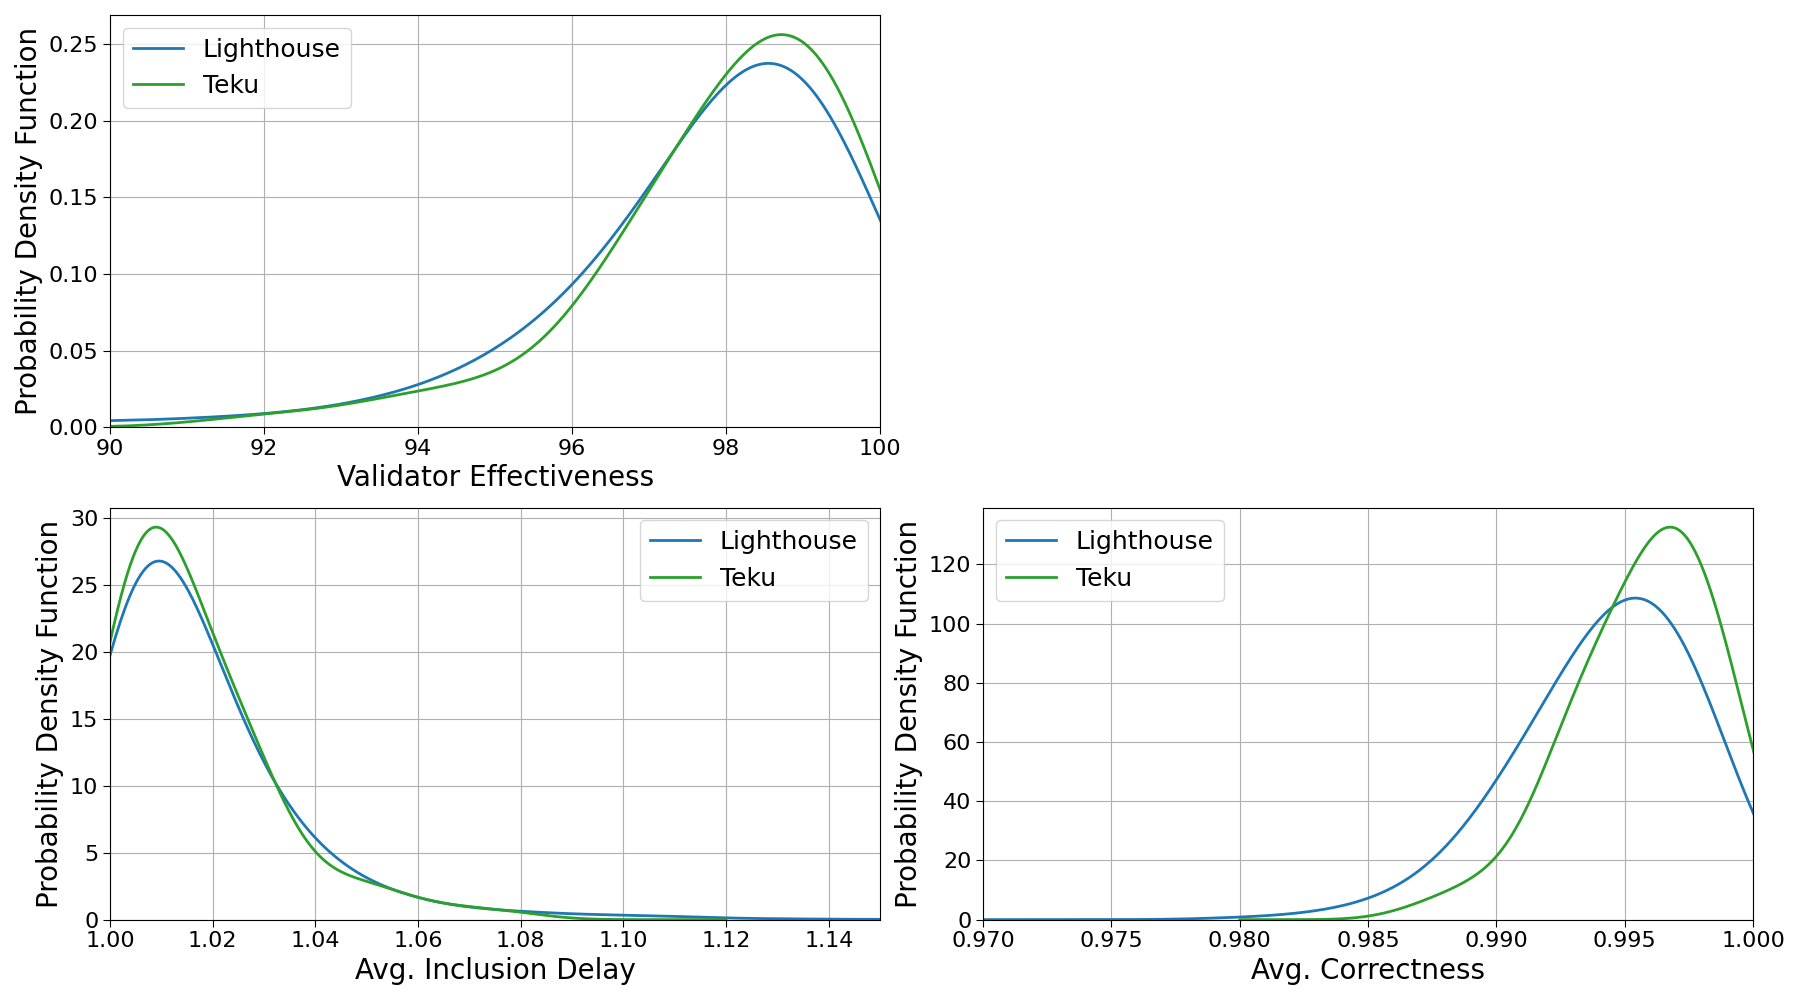
Fig. 5: Probability density function of validator effectiveness, avg. inclusion delay, and avg. correctness for Chorus One Lighthouse and Teku validators from 2024-01-11 to 2024-02-27.
The metric that differs most significantly is the correctness of attestations. The distributions of average correctness are the only ones that did not pass the Kolmogorov-Smirnov test, yielding a p-value of 1.16e-8. The hypothesis that the distributions of average inclusion delay are drawn from the same distribution cannot be excluded, given a p-value of 0.83. We observe a maximum inclusion of 1.08 for Teku client and 1.23 for Lighthouse, while median, 25% and 95% quantiles are consistent. Nonetheless, as noted in the daily distribution, validators running the Teku client tend to be more frequently in the region with lower inclusion delay on a daily basis. This may indicate some dependency on network behavior and warrants further investigation. A similar behavior is observed for total unique attestations.
When comparing the global validator effectiveness distributions, we find a p-value of 0.08. Despite the absence of a strong rejection, we still detect an overall better performance for the Teku validators, with a median of 98.39% and a 25%-quantile of 97.25% (compared with 98.25% and 96.97%, respectively, for Lighthouse validators).
2.1 Effects of CL on MEV-Boost
Since the formal introduction of timing games, we have seen an ever-increasing number of entities start playing such games. While research has shed light on the potential network implications of the timing games, and discussions around mitigation strategies are ongoing, we have only few data-driven studies in literature estimating the consequent effects on the network, see e.g. The cost of artificial latency in the PBS context and Latency is Money: Timing Games /acc.
A particularly underexplored avenue is the relationship between the choice of CL clients and the dynamics of MEV-Boost. In this section, we present a preliminary observation that seeks to start a broader exploration to fill this void in the literature.
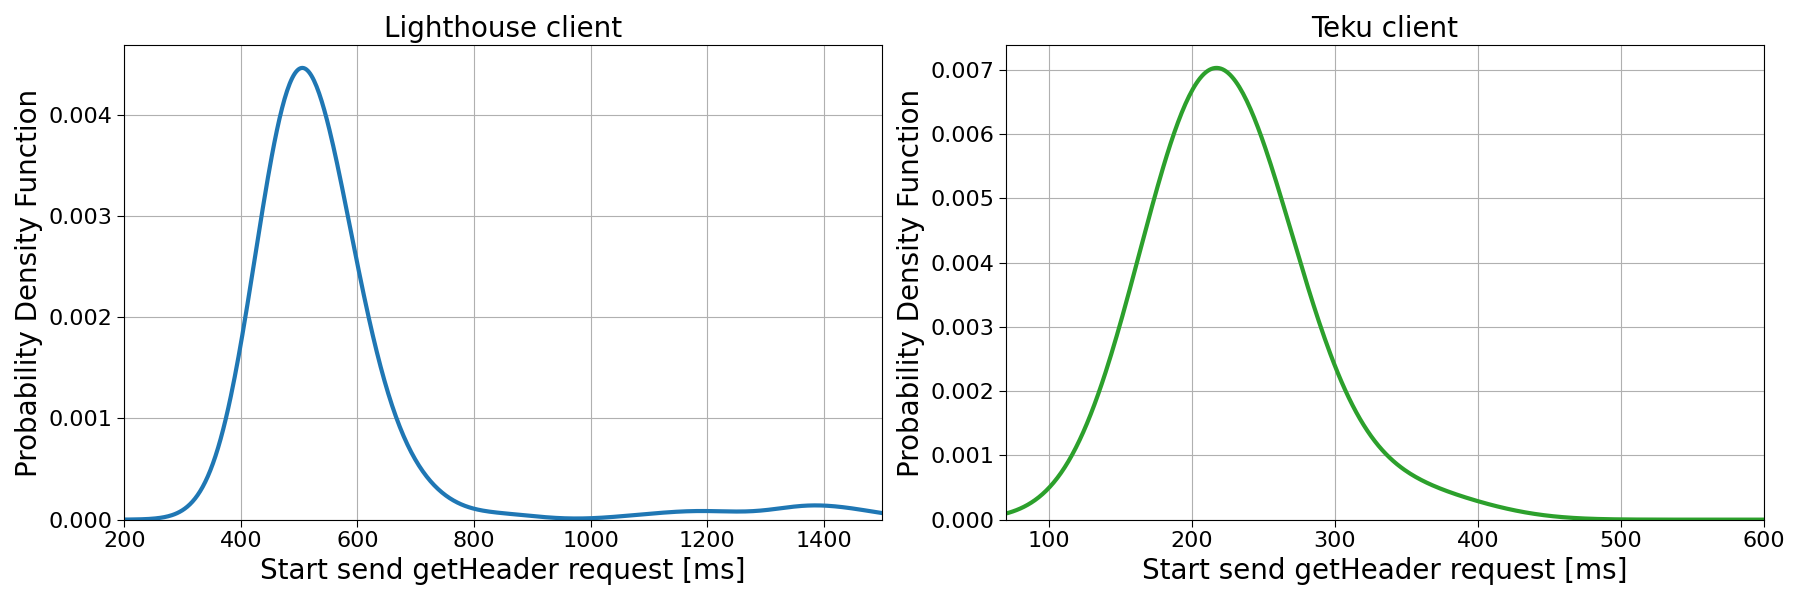
Fig. 6: Probability density function for the start sent getHeader request (the start of validators’ view of the auction). The left panel shows the distribution for Lighthouse client, the right panel shows the distribution for the Teku client. The data are Chorus One proprietary data from 2024-01-11 to 2024-02-27.
Our analysis, captured in Fig. 6, delineates a marked disparity between the CL clients that we are considering in the study. We observe that validators running the Teku client are able to initiate the MEV-Boost auction significantly earlier within the slot timeframe.
Lighthouse validators start the send getHeader request with a median of 516.0 ms into the slot, with 95% and 25% quantiles at 821.2 ms and 473.5 ms. On the other hand, Teku validators start the auction with a median of 219.0 ms — 95% and 25% quantiles at 330.8 ms and 197.0 ms. We can observe that not only the Lighthouse distribution is shifted towards higher value, but also that the spread of the distribution is quite different — 347.7 ms vs 133.8 ms.
This discovery is non-trivial; it indicates that, in the MEV landscape, validators operating on the Lighthouse client are at a comparative advantage due to an inherent latency. Indeed, such delay has pronounced implications in the context of MEV, where timing represents a critical factor in the efficacy of MEV extraction strategies. The timing differential observed here could, therefore, have an impact on the overall MEV extraction process, echoing the dynamics of timing games where every millisecond can influence the economic outcome.
3 Conclusions
Our analysis has revealed nuanced disparities in network performance between two prevalent CL clients, Lighthouse and Teku, particularly in the context of MEV-Boost and associated timing games. These findings highlight the multifaceted nature of client behavior and the potential for unexpected consequences stemming from network interactions. While Teku clients demonstrate superior network performance metrics, this research uncovers layers of complexity that merit a cautious approach to client selection.
As we previously mentioned, the principle of client diversity emerges as a prudent strategy in mitigating risks associated with network performance variability and liveness. Our observation of performance discrepancies, despite similar configurations for both validator sets, underscores the necessity to investigate the underlying causes of these differences.
Moreover, the impact on the dynamics of MEV is significant. Teku clients exhibit a consistently reliable performance in the execution of timing games, suggesting a competitive edge in environments where precision is required. Conversely, the broader distribution observed in Lighthouse clients may offer an advantage in flexibly handling bid cancellation through statistical fluctuations. The higher median latency inherent to Lighthouse clients could inadvertently replicate the desired effect of additional artificial latency without the need to alter MEV-Boost’s underlying code.
In the constantly evolving arena of timing games, where an increasing number of participants are vying for advantages, superior network performance may become the preferred tradeoff. With relays engaging in these games, excelling in CL duties could lead to augmented gains, particularly as CL rewards remain a substantial component of the total APR for validators.
It is also worth mentioning that our observations on the performance of CL clients could have a non negligible impact with the introduction of EIP-4844. Indeed, it has already been shown that blob transactions risk slowing down block propagation by orders of a hundred milliseconds in times of increased network activity, cfr. Censorship, Latency, and Preconfirmations in the Blob Market. More investigation is needed to capture the effects of this feature under the complexity of the CL client disparities.
In conclusion, while our findings may not be definitive, we believe this research should serve as a call to action for all validators across the Ethereum network. We encourage all validators to engage in deep research, leveraging their unique datasets to illuminate the network’s intricacies further. The insights gleaned from such studies will be invaluable, not only in enhancing individual validator performance but also in contributing to the collective understanding and stability of the Ethereum ecosystem as a whole.