Contact author: U. Natale
by Chorus One
Acknowledgements
This research has been granted by Chorus One. We are grateful to M. Moser, G. Sofia, B. Crain, and F. Lutsch for useful discussions and comments. We acknowledge support from the Chorus One engineering team for the implementation of the MEV-Boost changes. We also thank B. Monnot and C. Schwarz-Shilling for the review of the entire document.
Broader Context
Delaying the publication of the block for as long as possible to maximize MEV capture is a topic that is capturing attention. Recent discussions, highlight the importance of this topic posing the attention on some network implications. We believe that now it is time to deep dive in this complex scenario, since it poses serious consequences in terms of centralization pressure. We also think that some players have advertised ways to increase MEV extraction without proper analysis, inflating values based on biased assumptions. This behaviour exacerbates the centralization pressure, redefining the M in MEV as Marketing Extractable Value.
Node operators involvement
We recognize that within this context, node operators are compelled to employ latency optimization as a matter of strategic necessity. As more node operators exploit these inefficiencies, they progressively increase the benchmark rate for returns, giving capital providers a simple heuristic via which to select for latency-optimized setups. This further perpetuates the latency game, ossifying it into standard practice, upping the pressure on node operators reluctant to participate, in a self-reinforcing cycle. Ultimately, this manifests as an environment where a node operator’s competitive edge is defined by its willingness to exploit this systematic inefficiency.
Goal of this research
We are committed to operational honesty and rational competition. This study will disclose our results and initial parameters, alongside an extensive discussion of node operator incentives and potential adverse knock-on effects on the Ethereum network. The goal of the article is to address and mitigate these competitive dynamics by providing an extensive analysis informed by proprietary data from our study. Our primary objective is to describe the auction dynamics that give rise to latency strategies, and the associated externalities imposed on the Ethereum network. Our secondary objective is to provide practical context through a discussion of the Adagio setup, and node operator incentives. The final goal is to initiate a constructive discussion, contributing to an informed decision by the community.
The Adagio pilot
In music, a piece played “adagio” is performed slowly, and with great expression. This concept extends to an MEV-Boost pilot that Chorus One has been operating on Ethereum mainnet. Our setup strategically delays getHeader requests to maximize Maximum Extractable Value (MEV) capture; correspondingly, we’ve dubbed it Adagio.
Goal of this post
This post will focus on key observations from two crucial sections: The cost of artificial latency and Empirical results from the Adagio pilot. The goal is to spark a broader community discussion on these critical issues. For complete details and comprehensive analysis, please refer to the full article.
About Chorus One
Chorus One is one of the biggest institutional staking providers globally operating infrastructure for 45+ Proof-of-Stake networks including Ethereum, Cosmos, Solana, Avalanche, and Near amongst others. Since 2018, we have been at the forefront of the PoS industry and now offer easy enterprise-grade staking solutions, industry-leading research, and also invest in some of the most cutting-edge protocols through Chorus Ventures.
The cost of artificial latency
The study shows how all institutional (i.e. client-facing) node operators are incentivized to compete for latency-optimized MEV capture, irrespective of their voting power. While the potential for equitable competition exists as different points on the risk / return curve, the introduction of an artificial delay into the block proposal process carries negative externalities which extend to subsequent proposers, and the network at large, rendering such a proposition naught.
Negative externalities due to an inflated ETH burn rate
In the “PBS auction dynamics” subsection, we illustrate the upward trend in gas consumption as the auction progresses. This subsection will examine the direct correlation between the introduction of artificial latency to the auction and its impact on the Ethereum network’s gas dynamic; the discussion will focus on the fee burn mechanism introduced by EIP-1559.
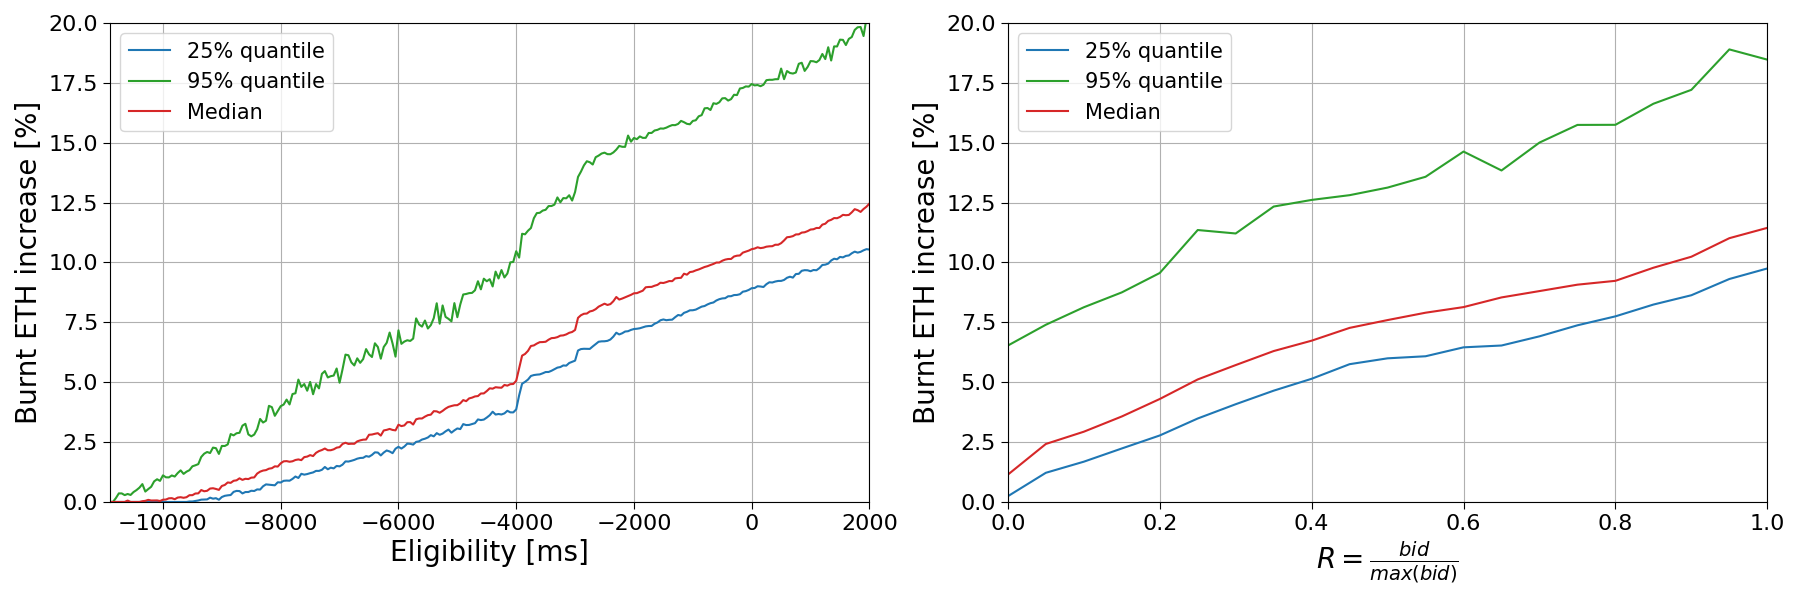
Fig. 1: (Left panel) Burnt ETH increase for the subsequent block as function of the eligibility of the bid. (Right panel) Burnt ETH increases for the subsequent block as function of the bid value increase. For both panels, the red line represents the median of the distribution, the blue line represents the 25%-quantile, and the green line represents the 95%-quantile.
Figure 1 extends the previous visualization to map ETH burn against the bid eligibility time. The left panel illustrates how the percentage of burnt ETH increases over time, and the right panel correlates the R value with this percentage increase. The graph explicitly demonstrates that as bids rise during the auction, so does the gas price, leading to a larger share of burned ETH in subsequent slots. The upshot is that artificial latency imposes a hidden cost on subsequent proposers, as a relatively larger share of their income is burned. While the base fee increases, if the opportunity for MEV extraction remains constant, builders are compelled to adjust the final portion of rewards they are willing to pay, effectively burning a part of what could have been the proposer’s income. For normal transactions, the priority fee (PF) paid remains the same regardless of the base fee level, assuming the max fee isn’t binding. But if the max fee is close to the base fee, an increase in base fee can lead to a reduction in the PF available for normal transactions, affecting again the income of the next proposer.
While sophisticated validators capture an upside from latency-optimized MEV capture, the systematic repercussions manifest as increased gas costs and an accelerated ETH burn rate for the subsequent proposers. The Ethereum network seeks to maximize decentralization by encouraging hobbyists to run validators. We demonstrate that these downside risks are significant in scale, and disproportionately impact solo validators.
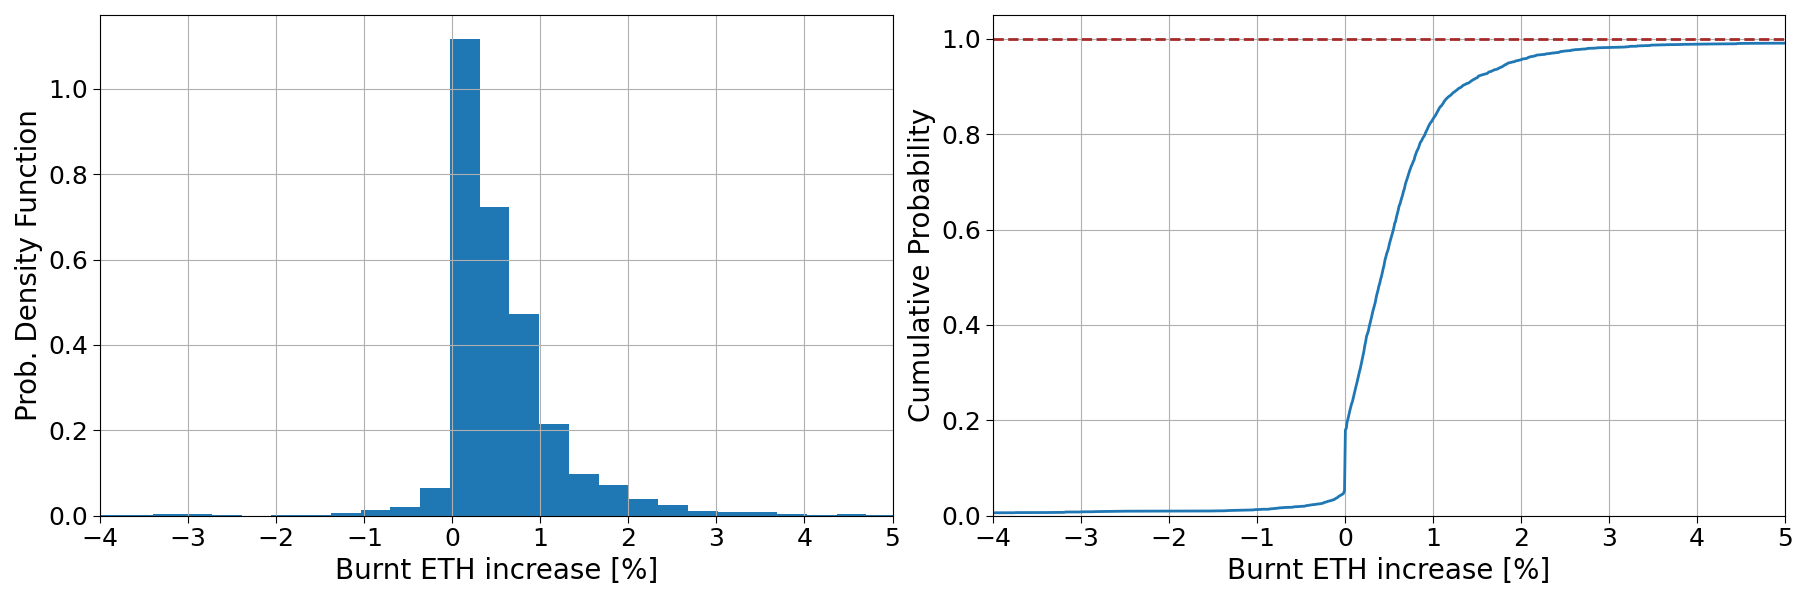
Fig. 2: (Left panel) PDF of the burnt ETH increase obtained after applying the 950 ms standard delay. (Right panel) Cumulative probability of burnt ETH increase obtained after applying a delay.
Figure 2 demonstrates that the introduction of artificial latency into the auction increases the percentage of ETH burned meaningfully. The left panel displays the probability density function for the additional percentage of ETH burned. While the median increase of around 0.4% appears modest, the breadth of the distribution indicates a wide spectrum of potential outcomes. Notably, even a small increase in burnt ETH can disproportionately reduce final rewards due to the typically larger amount of burnt ETH compared to MEV rewards.
A 0.5% rise in burnt ETH translates into a tangible reduction in MEV rewards. For example, if an original MEV reward is 0.077 ETH with a burnt fee of 0.633 ETH, a 0.5% increase in burnt ETH would lower the MEV reward to approximately 0.074 ETH. This reduction represents a subtle yet impactful 3.9% decrease in the proposer’s revenue. For node operators with relatively lower voting power, i.e. who are relatively less frequently chosen to propose blocks, the tail of the distribution poses a significant risk. Specifically, the 95%-quantile settles around a 2% increase in burnt fees, and higher values are possible. Consider that there is a 1% probability that the increase exceeds 5%. This can manifest a tangible effect on the overall APR of such a provider, rendering them non-competitive.
This additional burn rate is consequently most impactful for solo validators, whose execution layer income would not only decrease, but be subject to greater variance. In short, the smaller a node operator, the more likely adverse impacts from latency games are to manifest, with hobbyist solo validators landing on the least desirable end of the risk / reward spectrum. The next subsection will extend the analysis to demonstrate that even sophisticated node operators compete in a zero sum game, for which the revenues captured from validators that do not optimize for latency serve as the seed capital.
Before moving on, it is worth noting the presence of a negative tail in the probability density function shown in Fig. 2. This could be attributable to builders who place new bids not specifically to outcompete others, but to effectively supersede, i.e. cancel, a previously leading bid. This would be relevant when the opportunity the transaction in question seeks to exploit dissipates.
A zero sum game for node operators
Figure 3 illustrates how proposer behavior can alter the composition of a block, and consequently, the distribution of rewards. The left panel of the figure illustrates a clear trend: as proposers delay the getHeader request, there is a concomitant increase in the number of transactions included in a block. This increase is intuitive; more time allows for additional transactions to be pooled from the mempool into the block, potentially boosting the MEV available to the proposer.
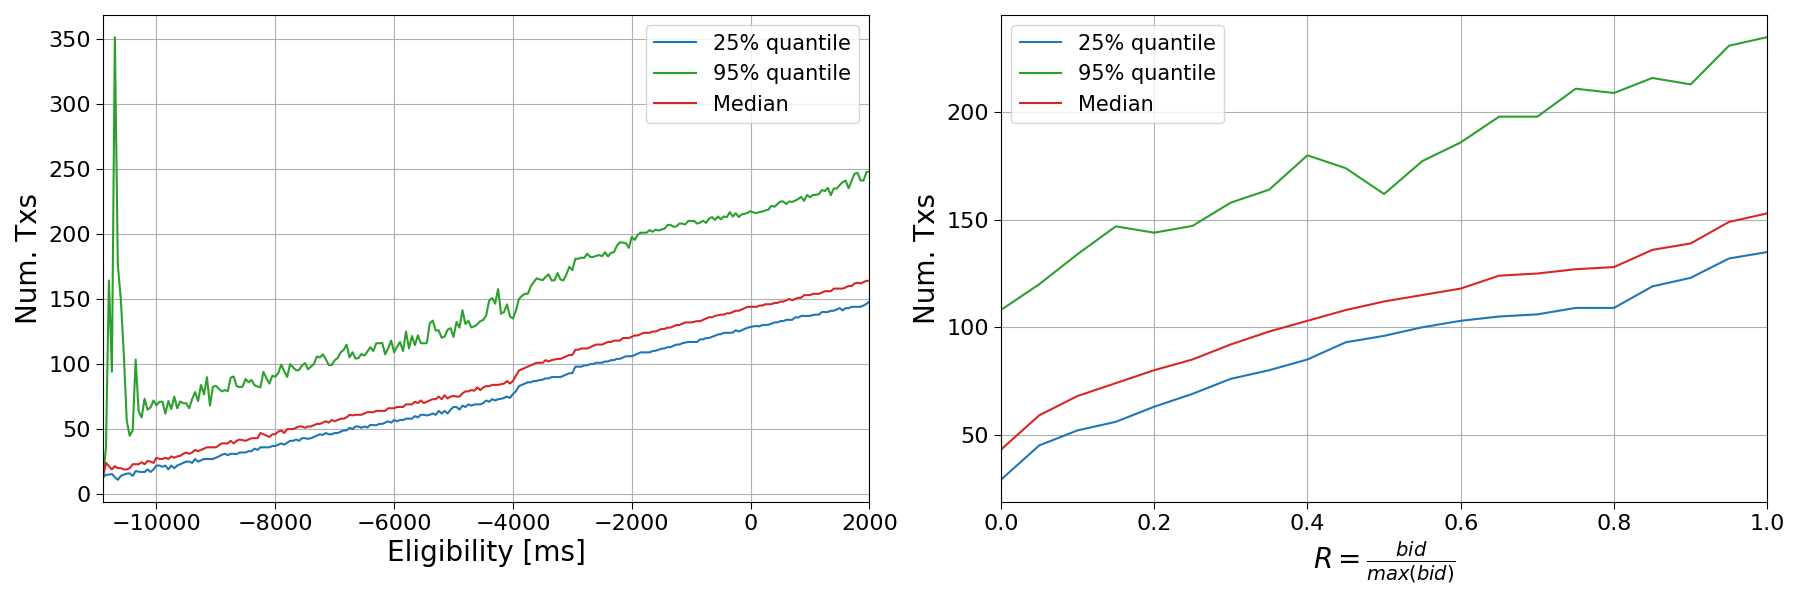
Fig. 3: (Left panel) Dynamics of the number of transactions included in the block during the auction. (Right panel) Number of transactions included as a function of the increase in the bid value. For both panel, the red line represents the median of the distribution, the blue line represents the 25%-quantile, and the green line represents the 95%-quantile.
The right panel of the curve contextualizes this analysis further, demonstrating that as the reward value of a block nears its maximum (R value approaching 1), the rate at which transactions are included rises (i.e. the slope of the curve). This suggests that in the latter stages of a slot, as new transactions continue to enter the mempool, builders have a larger opportunity space, increasing block value. This dynamic is twofold.
First, vertically integrated builders (who are also searchers) can afford to place higher bids. As the time gap between centralized exchange (CEX) and decentralized exchange (DEX) settlement narrows, the price risk of inventory diminishes, allowing builders to bid more aggressively and widely. The next subsection will illustrate the downside impact of this in more detail.
Secondly, this pattern implies that transactions that may have been included in the next slot land in the current one. This shifts potential MEV revenue from the future proposer to the incumbent, and gives rise to a zero sum game: the gain of one player is the loss of another.
An increased LVR burden on LPs
Liquidity providers (LPs) grapple with Loss-Versus-Rebalancing (LVR), where arbitrageurs exploit stale prices to the detriment of LPs. The LVR metric captures the losses incurred by Automated Market Maker (AMM) LPs when their liquidity is traded against by arbitrageurs reacting to price movements between CEXs and DEXs.
LVR is sensitive to block times; higher durations exacerbate the information disconnect between venues and thus increase LP losses. The consequence is that delaying the getHeader request extend the opportunity window and decreases the risk for such arbitrage, imposing additional losses on LPs that would not be incurred under standard conditions.
Research has consistently demonstrated a correlation between the first transactions in a block, and LP losses; these transactions generally involve cross-venue arbitrage. A successful arbitrageur has consistent access to the early slots in the block, and requires competitive execution on the CEX-side (i.e. fee tiers; infrastructure) to competitively bid.
In the first section of this study, we demonstrate that some builders profit from a consistent information advantage. This can materialize as the ability to execute CEX to DEX arbitrage competitively. The introduction of artificial latency by validators increases the range and profitability available to such a builder, at the expense of LPs, thus raising the aggregate cost of providing on-chain liquidity.
An increase in centralization pressure
The previous sections highlighted multiple ways dynamics intrinsic to PBS influence the Ethereum ecosystem. This section will synthesize the preceding discussion into specific ways these lead to centralization.
We examined how strategic delays by validators in submitting getHeader requests result in an increased ETH burn rate. This knock-on effect benefits node operators engaging in such timing games, to the detriment of others, that are net exposed to a higher base fee if proposing in subsequent slots. Additionally, node operators with a relatively lower voting power are exposed to disproportionately more variance from the long tail of percentage increases in ETH burned. In summary, large node operators playing timing games benefit from comparatively higher APR at lower variance to the detriment of other operators.
We also examined how late block proposals require builders to include relatively more transactions to keep their bids competitive, thereby draining potential MEV profit from future blocks. This again manifests a disadvantage for smaller node operators, who propose blocks less frequently, and are therefore more exposed to individual block payoff variance.
Finally, we highlighted how validator-side strategic timing games lead to higher LP losses from increased LVR, shifting profit to sophisticated CEX to DEX arbitrageurs, which can capitalize on more opportunities and bid more aggressively due to decreased inventory risk. A share of the direct upside again accrues to latency optimized node operators, reinforcing centralization pressure. Additionally, LPs may diversify their capital deployment to include a mix of liquidity provisioning and hedging through MEV-optimized staking, manifesting further centralization pressure.
Across the board, the nature of MEV favors node operators with relatively higher voting power, who naturally capture returns at lower variance. Strategic latency games compound this effect in the ways highlighted above, potentially manifesting risks for the Ethereum network at large due to increased centralization, and potentially higher gas fees.
Additionally, large node operators enjoy access to a larger pool of in-client data (e.g. bid timings from MEV-Boost), which allows more efficient hypothesis testing, and reflects as more effective latency parameters. This edge scales with voting power.
Within this context, node operators are compelled to employ latency optimization as a matter of strategic necessity. As more node operators exploit these inefficiencies, they progressively increase the benchmark rate for returns, giving capital providers a simple heuristic via which to select for latency-optimized setups. This further perpetuates the latency game, ossifying it into standard practice, upping the pressure on node operators reluctant to participate, in a self-reinforcing cycle. Ultimately, this manifests as an environment where a node operator’s competitive edge is defined by its willingness to exploit this systematic inefficiency.
Empirical results from the Adagio pilot
In late August 2023, Chorus One launched a latency-optimized setup — internally dubbed Adagio — on Ethereum mainnet. It’s goal was to gather actionable data in a sane manner, minimizing any potential disruptions to the network. Until this point, Adagio has not been a client-facing product, but an internal research initiative running on approximately 100 self-funded validators. We are committed to both operational honesty and rational competition, and are therefore disclosing our findings via this study.
Our pilot comprises four distinct setups, each representing a variable (i.e. a relay) in our experiment:
- The Benchmark Setup: Two relays operate without latency modifications, serving as a control group. These allow us to measure the impact of our experimental variables against a vanilla setup, ensuring a baseline for comparison. Both relays are non-optimistic. Further, these function as a safety net in case the artificially delayed relays fail to deliver blocks on time.
- The Aggressive Setup: This approach pushes the boundaries of the auction’s timing, delaying the getHeader request as much as reasonably possible on a risk-adjusted basis (i.e. to the brink of the auction’s temporal limit). It is designed to capture the maximum possible MEV. This setup is features a non-optimistic relay.
- The Normal Setup: This setup rationally balances MEV capture against potential adverse impacts, and only delays the auction within a “safe” parameter space. It carries a favorable risk-reward profile. This setup features a optimistic relay.
- The Moderate Setup: This is our most conservative setup; it terminates the auction slightly ahead of our estimated safety threshold (100 ms prior), minimizing risk to the network while still engaging in competitive optimization. This setup features a optimistic relay.
The Adagio pilot is an exploration — its purpose extends beyond understanding how varying degrees of latency optimization affect both our aggregate profitability and the network at large. It also aims to mitigate the risk of bid cancellation when the same block is sent to multiple relays. By employing different latency setups, we can sample in distinct time regions, effectively preventing overlap and ensuring a more robust and efficient bidding process. If successful, it balances between rational self-interest as a node operators with our responsibility to the network’s integrity and performance, i.e. exists within the context of decentralized incentive alignment.
Results
In this section, we present a comprehensive outcome analysis for our Adagio pilot. Our primary objective is to examine the influence of different relay configurations on the timing of bid selection and eligibility; this is central to the dynamics of the MEV-Boost auction.
First, we examine how the intrinsic latency of each relay shapes the overall auction dynamic. Figure 4 shows the timestamps of bid selection, and the corresponding bid eligibility times. Notably, the graphs highlight instances where the relay response times do not correspond to the expected latency, e.g. in the case of the normal setup’s unexpectedly quicker responses versus the aggressive setup. This can be indicative of performance differences between relays; a future study may analyze this further in the context of timely payload delivery.
Irrespectively, the data confirms that our parameters generally and safely insure bid selection within the 1-second mark of the slot. This operational threshold is central, as it minimizes the risk of network congestion, and the risk of forks caused by late block propagation. On the operator side, it also minimizes the risk of a 0 payoff via a missed slot.
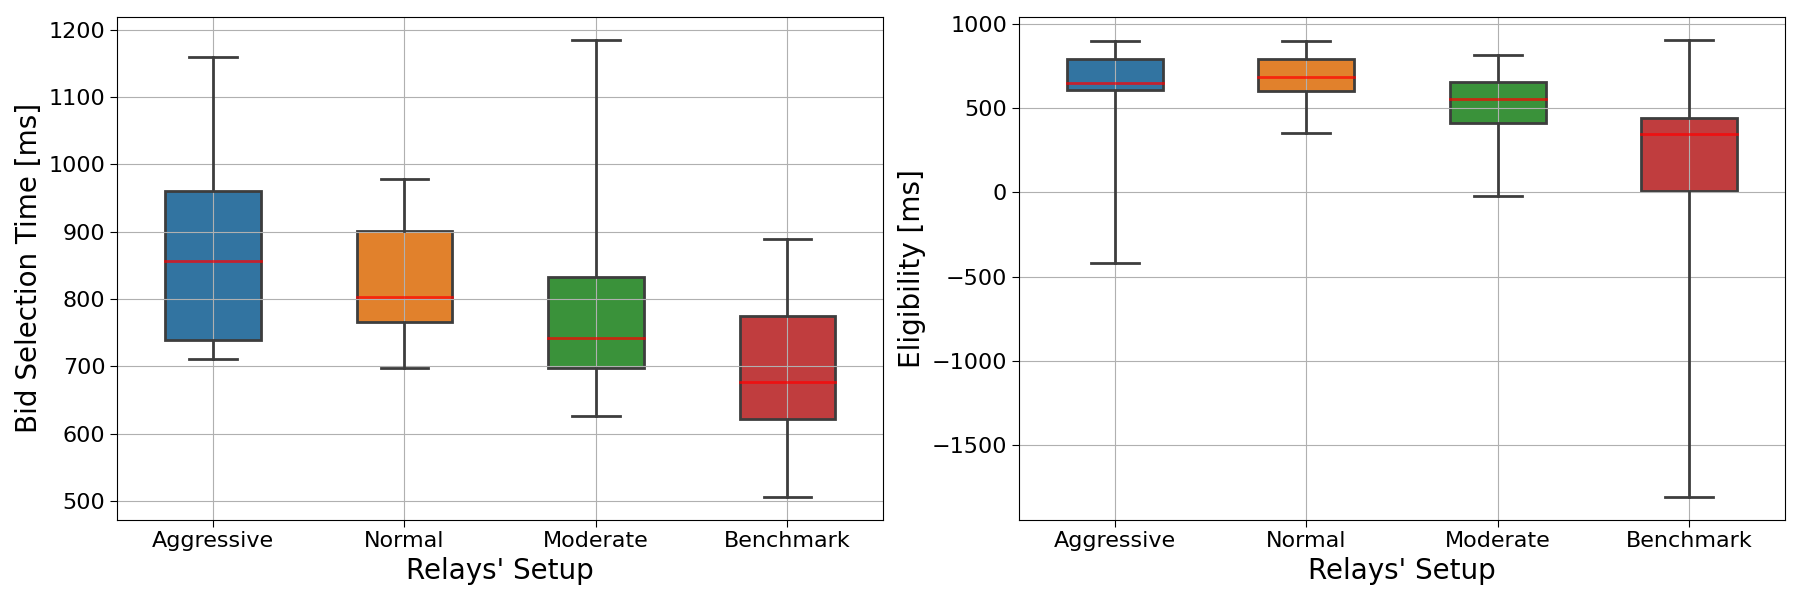
Fig. 4: (Left panel) Box plot of the bid selection time from the relays with different setup. The time is with respect the slot time. (Right panel) Box plot of the eligibility of received bid from relays with different setup. For both panels, the red lines represent the medians of the distributions, meanwhile the boxes represent the distributions between the 25% and 75% quantiles.
We proceed with an analysis of each setup’s behavior:
- The Benchmark Setup adheres to expected performance standards, with median bid eligibility occurring at 344.5 milliseconds into the slot, and the 95% quantile at 575.75 milliseconds. This seems to indicate that the intrinsic latency (i.e. network topology or relay idiosyncrasies) can organically mirror artificial latency. Our benchmark setup seems to select bids in the right tail of the network distribution.
- The Aggressive and Normal Setups exhibit competitive bid eligibility timings, with the aggressive setup surprisingly under-performing the normal setup despite its higher latency parameter. This is indicative of inherent differences between relays, such as the time to process bids, and their geographical placement.
- The Moderate Setup outperforms the benchmark in terms of delay but lags behind the aggressive and normal setups. This result is particularly interesting as it indicates that non-optimistic relays could be introducing an artificial latency parameter to remain competitive with the optimistic relays.
In summary, the data suggests that latency strategies within relay operations carry significant implications for relay competitiveness. The aggressive setup in particular appears to enable non-optimistic relays to operate on par with optimistic peers. The practical upshot is that some relays can only consistently compete through an artificial delay. An extreme case of this would be a relay which is technically consistently non-competitive, but captures exclusive order flow - in this case, a rational node operator will always query it with an artificial latency parameter. This competition among relays hints at a potential evolutionary shift in the game, where relays might strategically delay responses to enhance their chances of providing the best bid. This adaptation could be likely incentivized by the benefits of optimized delay, particularly for vertically-integrated builders who may be inclined to pay a premium for more reliable bid inclusion.
These results provide valuable insights into how strategic latency implementation within the relay infrastructure could influence the aggregate efficacy and competitive landscape of the MEV-Boost auction, by leveling the playing field between different relays via custom latency parameter.
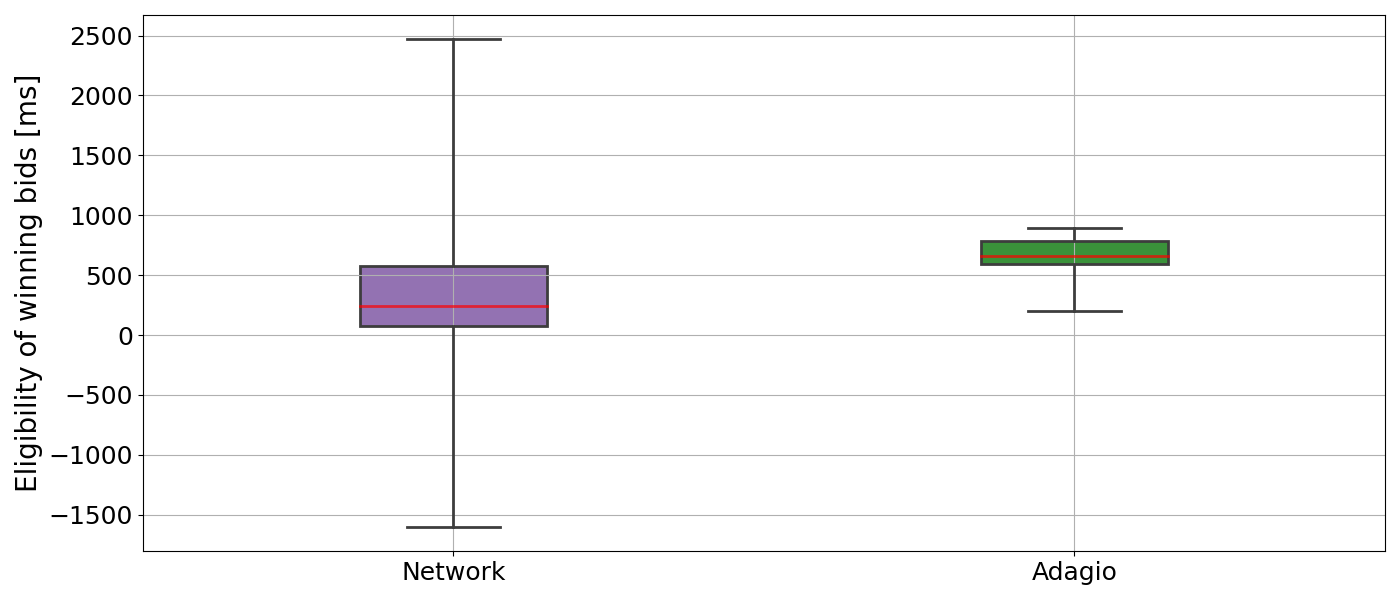
Fig. 5: Box plot of the eligibility time of winning bids. The red lines represent the medians of the distributions, meanwhile the boxes represent the distributions between the 25% and 75% quantiles.
Figure 5 shows the eligibility of winning bids for Adagio, compared with the network distribution. Despite the heterogeneous latency settings for relay setups, the data reveals a consistent pattern: our strategy predominantly selects bids that become eligible after 500 milliseconds, with the 25%-quantile marked at 589.5 ms. This consistency highlights the Normal and Aggressive setups as the primary contributors to winning bids, with a median selection time of 656.0 ms and a 95%-quantile at 886.35 ms.
Critically, these findings underscore our decision to sample below the 950ms threshold posited in our theoretical framework; instead, we aimed for an average delay of 700 ms. There are two reasons for this. First, in a realistic setting, sampling around the 950ms mark can cause selections beyond the 1s mark due a given relay’s inherent latency, or network topology. Operating without a safety margin risks congestion and forks via late blocks, and increases the risk of a missed slot. Second, there is insufficient statistical evidence to justify pushing beyond this threshold. As the bid increase flattens out after 950 ms, i.e. warps the risk / reward ratio unfavorably. To be exact, while the median value of rewards increased by 3.39% from 250 ms to 950 ms, it increased by only 0.18% between 950 ms and 1 s.
We will conclude by estimating the profit uplift realized by Adagio. In our theoretical framework, we assumed a static delay; in practice, we observe a fluctuation in the eligibility time distribution. To offset this, we will sample eligibility times from the cumulative distribution of the network timing, and compute how much additional MEV revenue has likely been realized for an eligibility delay corresponding to our actual observations (i.e. see Fig. 5).
Fig. 6 plots the result of these simulations, comparing the theoretically expected MEV revenue against the empirical data from the Adagio pilot. The probability density function shows a wider variance with a higher cumulative probability. This indicates that while the experiment leads to a broader range of outcomes, it skews towards relatively lower MEV increases in the practical setting.
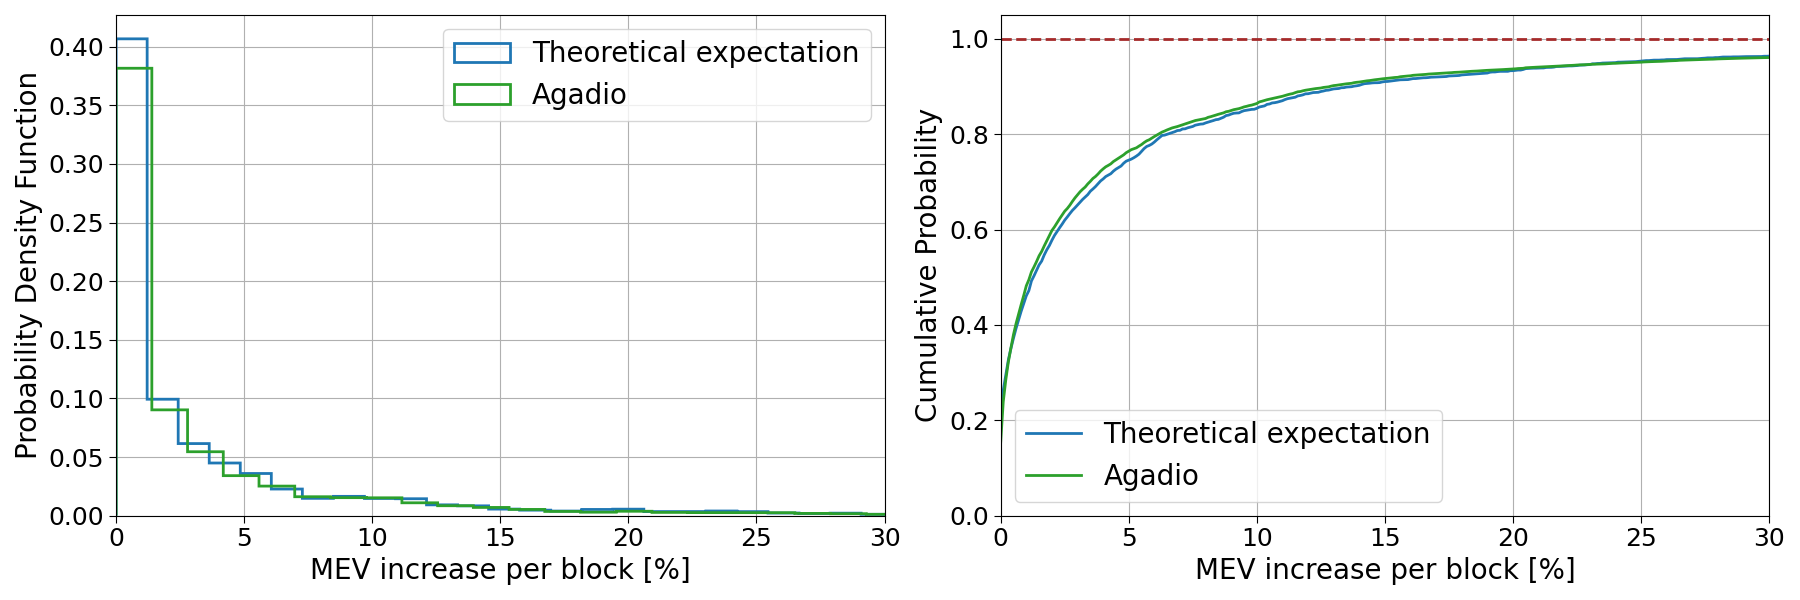
Fig. 6: (Left panel) Probability density function of MEV increases per block. (Right panel) Cumulative probability of MEV increases per block. In both panels, the blue line represents the theoretical model obtained assuming we always hit the 950 ms value for the eligibility time of bids. The green line represents the expectation obtained using the Adagio data.
Combining the latency optimization payoff (Fig. 6), per-block MEV value, and proposal frequency statistics (i.e. using the Adagio VP), allows us to quantify the expected annual increase of validator-side latency optimization .
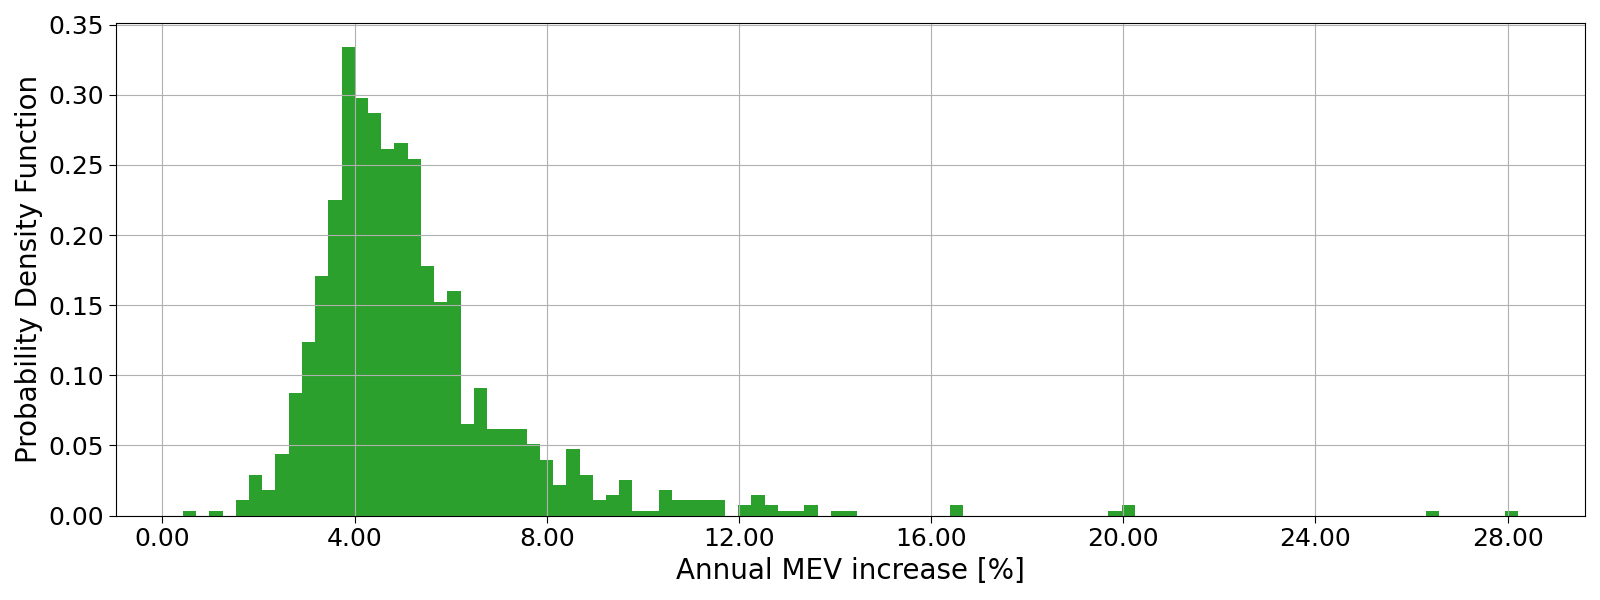
Fig. 7: PDF of annual MEV increase expected by adopting the Adagio setup. The high spread is due to the low voting power we have with the current pilot.
The simulation results plotted in Fig. 7 indicate a median MEV increase per block at 4.75%, with the interquartile range extending from 3.92% to 9.27%. This correspond to an APR 1.58% higher than the vanilla case, with interquartile range from 1.30% to 3.09%.
The increased spread primarily arises from the pilot’s constrained voting power. However, a portion of it is due to a fluctuation in bids eligibility. Further, the observed median comes in 5% than the theoretical projection. To bridge this gap, we will update our approach so as to minimize variance in bid selections, and maintain eligibility times below the 950 ms threshold.
Conclusion
This study has examined how strategic timing games in the PBS context take advantage of the dynamics of the MEV-Boost auction to yield additional MEV revenue for node operators. In this context, it discussed node operator incentives, and highlighted how the externalities of such latency optimization create systemic challenges for the Ethereum network. Specifically, these include node operator centralization and associated risks, network inefficiencies including potentially higher gas prices, and an increased LVR burden on LPs.
We illustrated that all node operators are incentivized to compete for latency-optimized MEV capture, irrespective of their voting power. While in principle, the potential for equitable competition between node operators of different size exists as different points on the risk / return curve (i.e. variance), the introduction of artificial latency carries negative externalities which affect subsequent proposers, rendering such a proposition naught.
Further, we argued that, as an increasing share of node operators employs latency optimization, these progressively increase the benchmark rate for returns heuristic via latency-optimized setups. In this way, the opportunity cost of not engaging in timing games increases in a self-reinforcing cycle. Ultimately, this normalizes such optimization as standard operating procedure, and manifests an environment in which any node operator’s competitive edge is defined by its willingness and ability to exploit systematic inefficiencies.
We highlighted how strategic timing games lead to higher LP losses from increased LVR, benefiting statistical arbitrageurs. As the auction duration extends, these can capitalize on more opportunities due to decreased inventory risk and a larger disconnect between CEX and DEX pricing. A profit share directly accrues to latency optimized node operators; additionally, LPs may stake with such node operators to offset some of their LVR risk, manifesting further centralization pressure.
We argued that, large node operators enjoy a systematic edge through reduced payoff variance via a higher block proposal frequency, and access to a larger pool of in-client data that reflects as more effective latency parameters. We demonstrated that artificial latency can result in a higher base fee, and that the long tail of the percentage increase in ETH burned poses a significant risk to small node operators and hobbyist validators.
Lastly, we presented our Adagio pilot and demonstrated that latency optimization significantly increases node operator revenue, at an estimated 1.58% boost to APR versus a non-optimized setup. We illustrated how practical latency parameters can balance competitiveness with network health, and thus provide insights to smaller node operators which may struggle to find sufficient data to stay competitive. Our research emphasizes the need to take a cautious and informed approach to latency optimization, rationally weighing competitive need versus potential drawbacks.
Overall, this study provides insight into node operator incentives, the dynamics of the MEV-Boost auction, and the cost of artificial latency in a PBS context. Future work may examine specific centralization risks in depth, such as cross-block MEV, and contribute to specific mitigation strategies, such as MEV-burn.