by U. Natale.
Acknowledgements
This research has been granted by Chorus One. We are grateful to M. Moser and G. Sofia for useful discussions and comments. We acknowledge Data_Always for providing some of the data used in this analysis.
1. Introduction
Currently, MEV-Boost selects the highest bid, in terms of value, from a collection of bids submitted by associated relays for a specific slot. This value denotes the quantity of ETH a builder pays to a proposer in return for acquiring the proposer’s block space for execution. Relays determine this value by comparing the balance of the fee_recipient after the execution payload is processed to the balance before execution. This approach encounters challenges when a block includes consensus-layer withdrawals to the fee_recipient intended for payment by the builder, as it artificially increases the perceived value of the payload, see. MEV-Boost Improvement Proposal for a detailed description of the problem.
A recent analysis from Data_Always scrutinized the economic impact on proposers, showing that the median loss amounted to $7 per instance, accruing to a collective detriment of $4,300 over a month. This highlights how losses for proposers tend to be very small.
However, there is a broader ramification for the Ethereum ecosystem: the bug not only diminishes proposers’ profits but also curtails the aggregate transactions and gas utilized, leading to a consequential decrease in ETH burning — a mechanism critical for the network’s economic model under EIP-1559. The inference drawn is that the loss of network value surpasses the direct financial impact on individual proposers, highlighting a significant systemic concern.
2. Network Effects
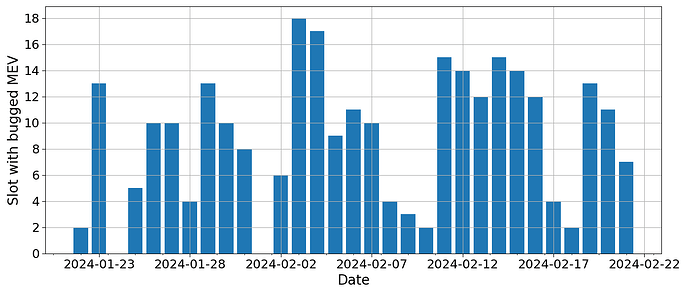
In the past month, a median of 10 slots per day were affected by this bug — equivalent to 4.44% of the total — with a range fluctuating between 5 and 16 slots, as evidenced by the daily distribution of affected slots in Fig. 1. This highlight the importance of assessing the network effects, eventually pointing to an urgency to solve for this bug.
Fig. 1: Daily count of slots affected by the MEV-Boost withdrawals bug. Source: flipsidecrypto.
In this analysis we used the data provided here after these have been corroborated using a flipsidecrypto dashboard.
2.1 Transactions inclusion
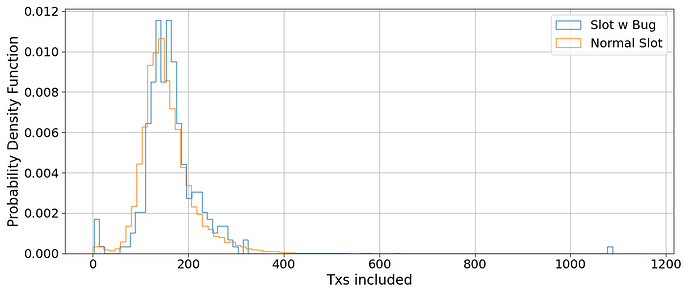
The first effect we want to quantify is the difference in transactions included. Indeed, if we compare the distribution of included transactions for “normal” Ethereum slots, F(x), and for slot affected by this bug, G(x), — during the same 30 days period — we can see that the second distribution is less exposed to higher number of included transactions, see Fig. 2.
Fig. 2: Probability density function of included transactions per slot. The blue histogram represents the txs included in the slots affected by the bug, the orange one represents the the txs included in usual Ethereum slots w/o the bug.
If we run a two-sample Kolmogorov-Smirnov test, we find that the two distribution are drown from the same distribution with a p-value of 0.0028. Precisely, we have that the empirical distribution function F(x) exceeds the empirical distribution function G(x). This is due to the relatively high number of slots with transaction count near 0 and the absence of a long tail towards 400 N° of txs.
To determine the effect of this difference, we can use the data on the bids received during the auction for the analyzed slot. To be precise, we can exclude the proposed bid with the bug from the auction and look for the new best bid. Clearly here we need to make the assumption on the timing for the auction. We take the maximum between the start of the slot + 1s and the timestamp of the bid with the bug. This is done because with timing games now common practice, most validators select the bids around 1s after the start of the slot, cfr. with this timing dashboard. Further, it may happen that the bid affected by the bug arrive later in the auction and the proposer is playing a more aggressive timing game.
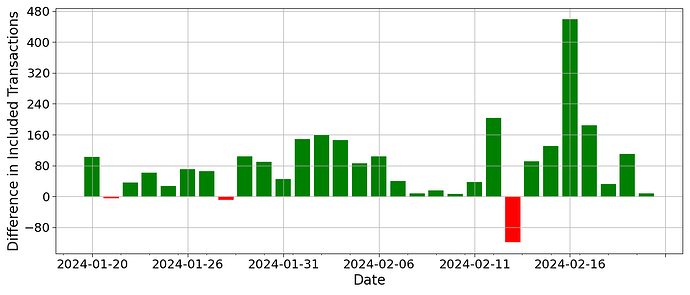
Fig. 3: Daily difference between transactions included in the best bid w/o the bug and the transactions included in the best bid w the bug.
The daily result of the difference between transactions included in the best bid w/o the bug and the transactions included in the best bid w the bug is presented in Fig. 3. As we can see, this difference is positive most of the time, highlighting the fact that this bug might decrease the number of transactions actually processed. The aggregate difference amounts to a total of 2,437 transactions in 30 days. The rate of slots affected by this bug with lower txs count is 76.64%.
2.2 Effects on Gas Used
As highlighted in our recent research, changing the dynamic of the auction has implication on the gas used. We can then extend the previous analysis and look into the differences in gas used.
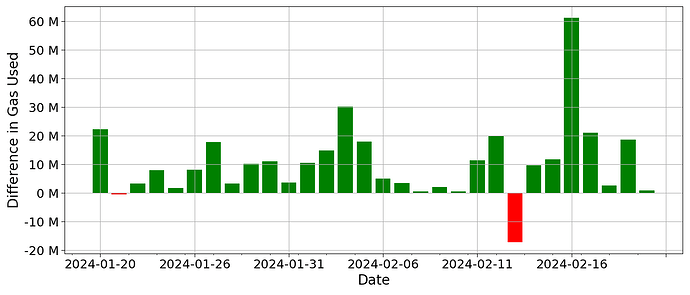
Fig. 4: Daily difference between gas used in the best bid w/o the bug and the gas used in the best bid w the bug.
The daily result of the difference between gas used in the best bid w/o the bug and the gas used in the best bid w the bug is presented in Fig. 4. Again, this difference is positive most of the time, highlighting the fact that this bug might decrease the amount of ETH burnt. To estimate the amount of ETH that was not burned due to the bug, we could assess the difference in gas utilization between the optimal bid without the bug and the actual bid with the bug for each affected slot. By calculating the difference in gas used, we can then determine the potential fees that would have been burned if the more gas-intensive, bug-free bids had been processed instead.
If we perform this calculation, we get that the amount of non-burned ETH corresponds to 5.62 ETH, that, at the price of $2,900, corresponds to $16,285.26. For reference, during the same period, a total of 90,217 ETH was burned. This means that the withdrawal bug represents only a minor effect.
2.3 ETH burn dynamic
This last section aims to quantify possible consequences on the slot succeeding the one with the bug. Indeed, changing the gas used by slot n, we modify the base fee for the slot n+1, eventually changing the amount of burnt ETH.
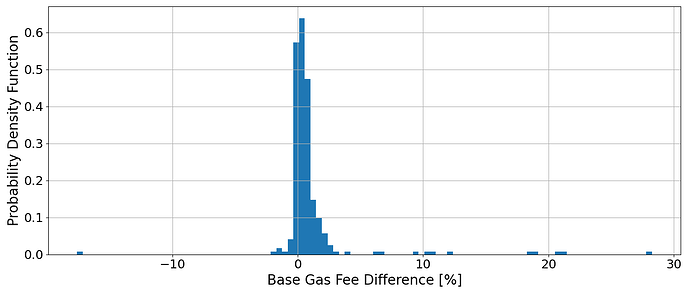
Fig. 5: Probability density function of the base gas difference for the slot after the one with the bug.
As analyzed in the previous section, this bug has implication on gas used, generally pointing towards lower values. This means that, by changing the proposed slot we increase the gas used. This automatically increases the base gas fee for the next slot, and the magnitude of this effect is presented in Fig. 5.
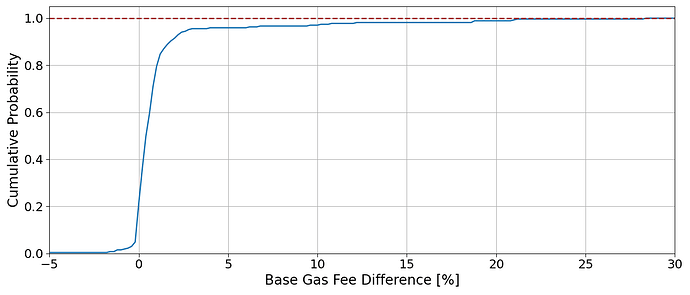
Fig. 6: Cumulative probability of the base gas difference for the slot after the one with the bug.
Figure 6 highlight how the base gas fee for the subsequent slot is greater than 0 with a probability of 20%. This effect magnifies the finding of the previous section, highlighting an overall reduction of burnt ETH.
