by Fei Wu - This work was conducted during my internship at the EF. I thank my mentor @misilva73 for valuable discussions, feedback, and comments.
Overview
EIP-7928 specifies Block-Level Access Lists (BALs) for Glamsterdam, where BALs remain oustide fee accouting. This analysis builds upon an open pull request on the EIP-7999 spec. The specification meters and prices execution, data, and state separately, while runtime BAL consumes data gas.
Pricing BAL creates a two-way coupling between the resource dimensions. More execution and state activity generate more runtime BAL and therefore more data demand. In the opposite direction, a higher data base fee raises the BAL-inclusive cost of the execution and state activity that produces those bytes, reducing parent activity and the BAL it generates.
Consequently, runtime BAL has no independent demand curve. It is an induced data load generated by parent execution and state activity, while the data fee becomes one component of the price faced by those activities. Total data demand therefore combines an independently demanded static-data component with an endogenous BAL component, and cannot generally be solved independently of execution and state demand.
To quantify this interaction, we reconstruct EIP-8279 runtime-metered BAL, measure static transaction content specified in EIP-8131 under the expanded EIP-7999 accounting, and convert both into the common 16-data-gas-per-byte convention assumed in this report. As in the previous elasticity analysis, all historical anchors use the 120 days from 1 February through 31 May 2026. At the historical anchor, runtime BAL contributes approximately 1.92M of the 4.05M total data gas per block, or 47.4%.
We then decompose runtime BAL according to the parent activity that generates it and construct BAL-inclusive execution and state prices. The resulting model provides the static-data multiplier, runtime-BAL anchor, BAL source attribution, and parent-price demand system that lays the foundation of future equilibrium analysis.
The results presented in this post can be reproduced from this repository.
Main results
- Static-data accounting — calldata, transaction access lists, authorization tuples with their EIP-8279 static BAL entries, and blob-versioned hashes — is 2.13 million data gas per block, a metering multiplier of 1.807 on current EIP-7623 data gas.
- Over the 6,000-block sample the EIP-8279 runtime BAL meter anchors at approximately 119.9 kB per block, or 1.92M data gas per block at 16 data gas per BAL byte. The transaction-level decomposition splits it into 11.4% matched directly to state creation, 37.9% access co-produced by state-creating transactions, and 50.7% from transactions with no observed state creation.
- Runtime BAL is economically closer to an induced execution/access load than to an independently demanded data resource. Only 11.4% of reconstructed runtime BAL is directly matched to persistent state creation; the remaining 88.6% is generated by access and execution activity not directly matched to state growth. BAL pricing therefore mainly prices a protocol-generated byproduct of parent activity rather than a byte quantity users independently choose.
- Assuming co-produced access follows execution demand entirely, each historical unit of execution activity produces w_{\mathrm{execution}}=0.0710 units of BAL data gas and each unit of state activity w_{\mathrm{state}}=0.0417. That is, each unit of metered execution gas produces 0.046 units of BAL data gas, and each unit of state gas produces 0.0074 units of BAL data gas. The gap is EIP-8037 repricing, which meters state creation at 5.66× against execution’s 1.54×. BAL’s response to the data fee then follows from the parent elasticities rather than from any parameter of its own.
- In an illustrative diagnostic where execution and state fees are fixed, bundle pricing reduces total data demand by 0.24% at the anchor-equivalent data fee, 4.1% at 1 gwei, and 12.8% at 5 gwei relative to the no-feedback specification.
Notation
| Group | Notation | Meaning |
|---|---|---|
| Activity | q_{\mathrm{execution}}, q_{\mathrm{state}}, q_{\mathrm{data}} | Execution activity, state-creating activity, and static transaction content, in historical gas-equivalent units |
| Anchors | q_i^0, g_{\mathrm{static}}^0, g_{\mathrm{BAL}}^0, p^0 | Historical activity per block, the static-data and runtime-BAL gas anchors, and the historical common-price anchor |
| Metering | m_{\mathrm{execution}}, m_{\mathrm{state}}, m_{\mathrm{data,static}} | EIP-7999 metering multipliers |
| Base fees | b_{\mathrm{execution}}, b_{\mathrm{state}}, b_{\mathrm{data}} | Protocol base fees |
| Parent prices | P_{\mathrm{execution}}, P_{\mathrm{state}} | BAL-inclusive price of one historical unit of parent activity |
| BAL intensities | w_{\mathrm{execution}}(\lambda), w_{\mathrm{state}}(\lambda) | Data gas mechanically produced per historical unit of parent activity |
| BAL attribution | \omega_{\mathrm{state-only}}, \omega_{\mathrm{coproduced}}, \omega_{\mathrm{nonstate}}, \lambda | Measured runtime-BAL shares and the co-produced allocation |
| Demand response | \epsilon_{\mathrm{execution}}, \epsilon_{\mathrm{data}}, \epsilon_{\mathrm{state}} | Own-price elasticities |
Superscript 0 denotes the historical anchor.
Estimating EIP-8279 runtime-metered BAL bytes
EIP-8279 defines a per-transaction bal_data_bytes counter. It adds fixed byte amounts for cold account and storage access, storage values that differ from their pre-transaction value, value-bearing calls and self-destructs, internal contract creation, and deployed code.
These protocol-event counts are available from Xatu for the wider block panel. The block-level estimator is:
where k indexes blocks. Each internal CREATE or CREATE2 counted by the runtime meter adds 28 bytes: 20 bytes for the new contract address and 8 bytes for its nonce. If the creation also transfers ETH to the new contract, the meter adds another 32 bytes for the contract’s initial balance.
We reconstruct transaction-level runtime BAL for 6,000 sampled blocks from February through May 2026, using 50 blocks per day. Daily sample means are weighted by the actual number of canonical blocks in each day. Throughout this analysis, we assume a 16 gas per byte for runtime BAL bytes as the static data content, but the actual DATA_GAS_PER_BAL_BYTE is still TBD.
| Priced BAL quantity at the historical anchor | Estimate |
|---|---|
| EIP-8279 runtime counter | 119,944 bytes per block |
| EIP-7999 data gas at 16 gas per runtime byte | 1.919M gas per block |
Xatu’s storage-diff table contains changes that remain after the transaction finishes. EIP-8279 retains a 32-byte meter charge when a reverted call temporarily changes a storage value; the final Xatu diff contains no corresponding entry. The reconstruction may therefore understate this specific source of runtime bytes.
What the runtime counter measures
The EIP-8279 counter is transaction-level, and it is not the size of the encoded block-level access list. Two differences run in opposite directions:
- It overstates the entries it does cover, because it applies no block-level deduplication. When several transactions in a block touch the same account or storage slot, the counter charges each transaction separately, while the encoded BAL stores that address once.
- It understates the payload as a whole, because mandatory per-transaction BAL entries are carried by
TX_BASEand the static floor rather than by the runtime counter, and because the counter models entry contents rather than the RLP framing that surrounds them in the encoded list.
Measured together, the second effect dominates. We construct the RLP-encoded BAL object using @Nero_eth’s analysis and compare with runtime BAL counter over a sample of 2,000 blocks. On average, the encoded BAL is 134,111 bytes per block against a runtime counter of 120,798, so the runtime counter is ~90% of the physical encoded size.
The two quantities serve different purposes. The runtime counter is what transactions are charged for: it is the metered quantity that enters the data gas. The encoded BAL object is what actually propagates with the payload, so it is what a data gas limit needs to be calibrated against. In this analysis, we focus on the pricing side.
Static-data metering in the EIP-7999 counterfactual
EIP-7999 also applies a DATA_GAS_PER_CONTENT_BYTE = 16 to static transaction data byte specified by EIP-8131, and brings calldata, access-list contents, authorization tuples, blob-versioned hashes into the same data resource. The accounting bridge below walks from current rules through EIP-7999 data gas accounting rules, so each step can be attributed to the rule that produces it.
Let q_{\mathrm{data}}^0 be current EIP-7623 data gas and let g_{\mathrm{static}}^0 be the gas assigned to the same static transaction content under the EIP-7999 counterfactual. The static-data metering multiplier is:
The current anchor is q_{\mathrm{data}}^0=1.181 M gas per block. Removing the EIP-7623 floor while retaining 4/16 calldata, as in the published draft, reduces the same transaction content to 1.033M gas per block. The counterfactual then meters every calldata byte at 16 data gas and adds access-list content bytes, authorization tuples, and blob-versioned hashes. EIP-8279 also adds 51 static BAL bytes for every authorization: 20 bytes for the authority address, 23 for its delegation code, and 8 for its nonce. These bytes are part of the static authorization charge rather than the runtime BAL counter.
| Accounting step | Specified by | Data gas per block | Change from previous step | Ratio to current EIP-7623 |
|---|---|---|---|---|
| Current EIP-7623: 4/16 calldata plus floor uplift | Current rules | 1.181M | — | 1.000 |
| Remove EIP-7623 floor; retain 4/16 calldata | Published EIP-7999 draft | 1.033M | −0.148M | 0.875 |
| Meter every calldata byte at 16 gas | PR #11835 | 2.009M | +0.976M | 1.702 |
| Add sampled access-list bytes | PR #11835 | 2.101M | +0.092M | 1.779 |
| Add sampled authorization-tuple bytes | PR #11835 | 2.122M | +0.021M | 1.797 |
| Add 51 static BAL bytes per authorization | PR #11835 | 2.132M | +0.010M | 1.806 |
| Add 32-byte blob-versioned hashes | PR #11835 | 2.134M | +0.002M | 1.807 |
The static-data metering multiplier is therefore:
The static component uses the independently estimated historical data elasticity. Its effective price ratio is:
Static data demand is therefore:
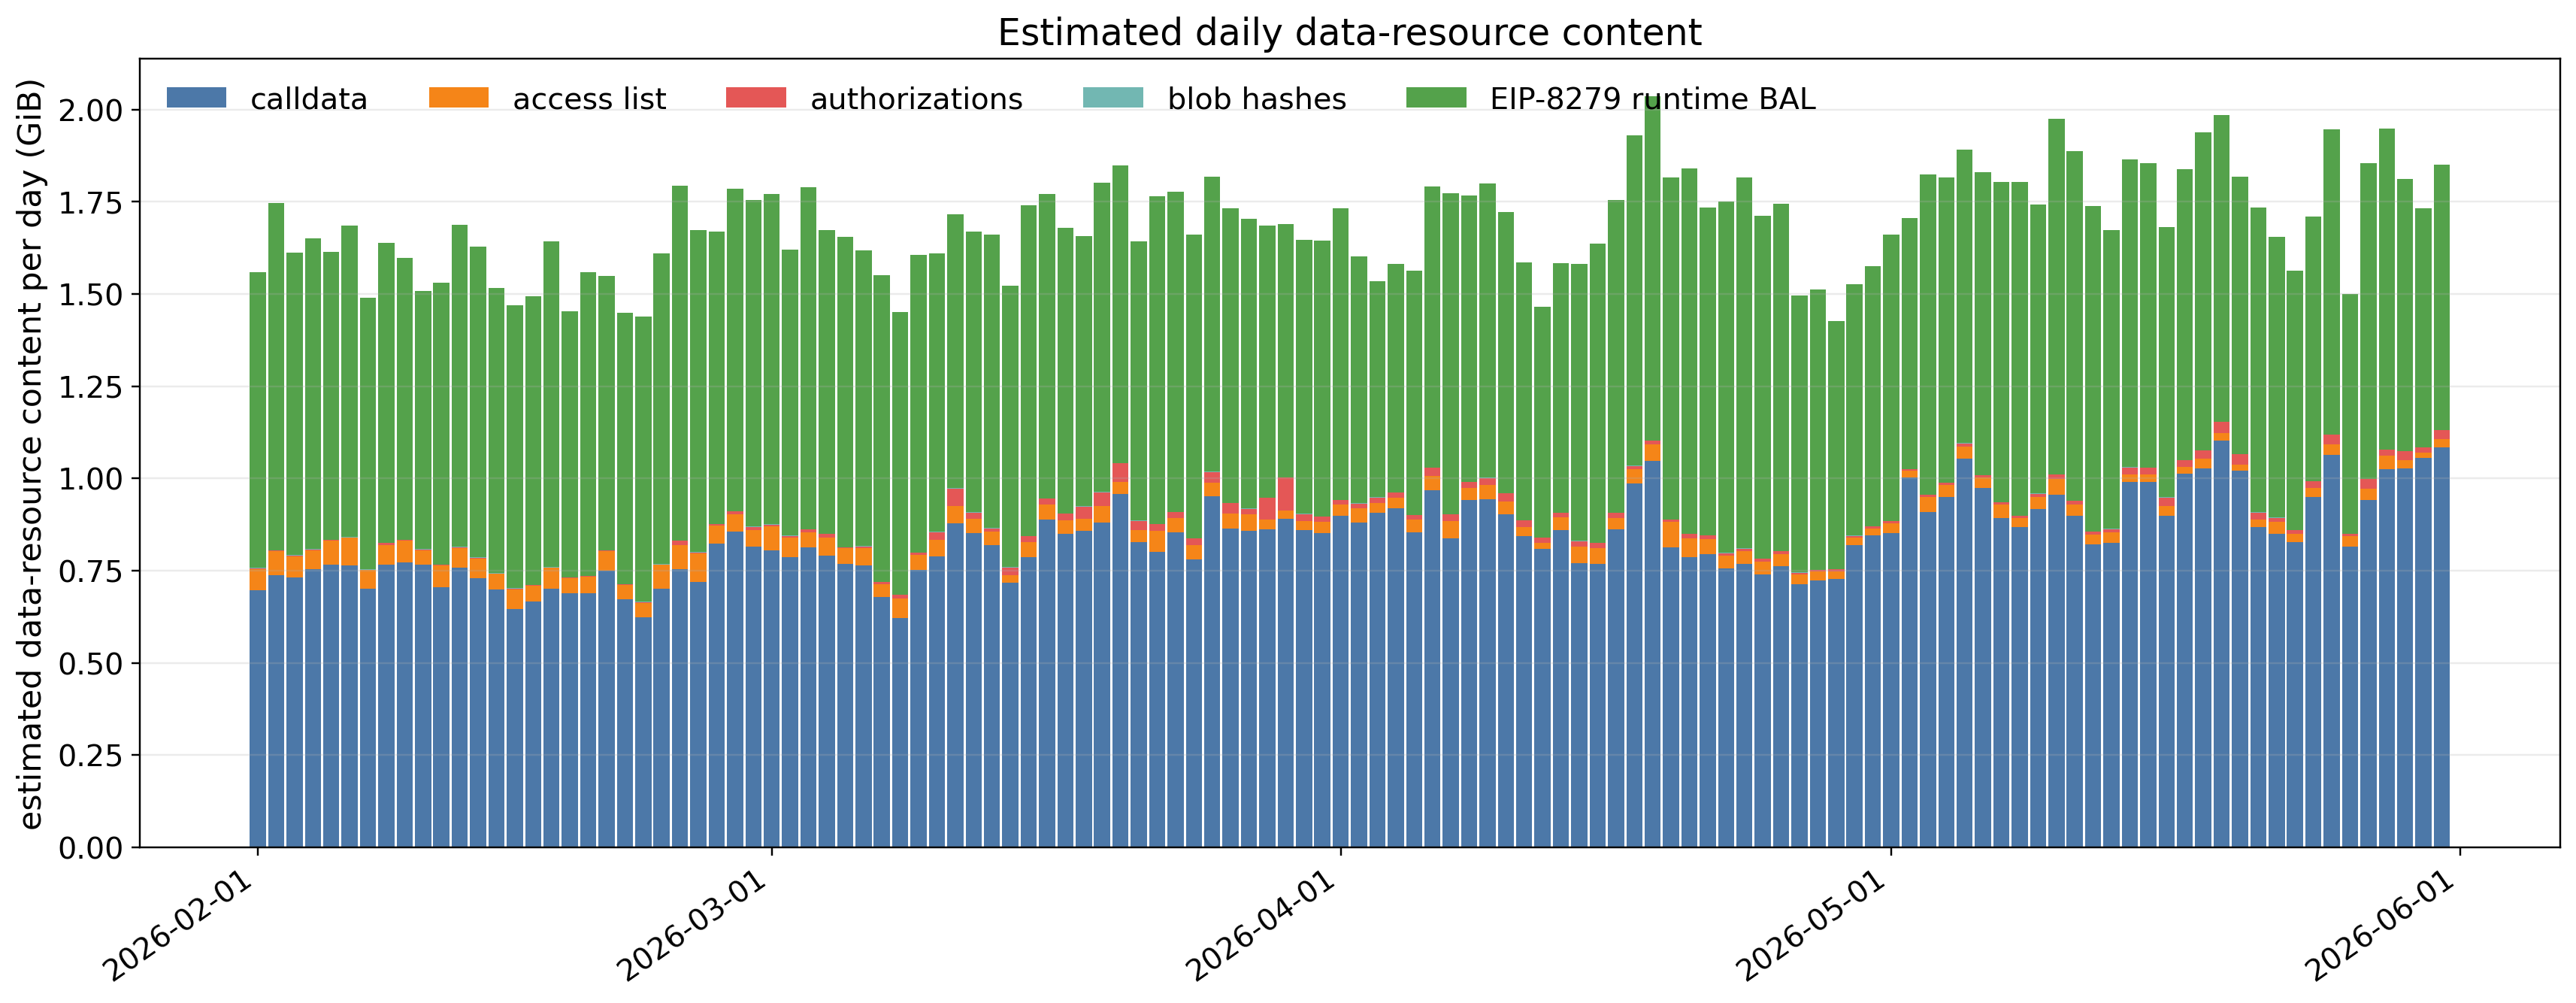
Total data resource byte composition at the historical anchor under EIP-7999.
64 gas per byte transaction floor vs. 16 gas per byte data gas
In EIP-8131 and EIP-8279, static transaction data bytes and runtime BAL bytes are charged 64 gas per byte in the transaction floor. This ensures that, under the one-dimensional fee market, the calldata/BAL-heavy transactions are not underpriced when their execution cost is low, and that the payload size is safe to be propagated if all the gas were used to expand the payload size.
Under EIP-7999, the data resource has its own dimension and pricing mechanism with an individual base fee, target, and limit. Therefore, the DATA_GAS_PER_CONTENT_BYTE = 16 is the gas cost of one byte in the separated data resource dimension. It no longer needs to be defended through the execution charge, and the worst-case payload size will be controlled by the data gas limit.
Separating BAL bytes between state creation and execution
BAL bytes are generated by persistent state creation and by access to existing state. A state-creating transaction often performs both activities: it may read existing accounts and storage slots while also creating a new account, slot, or contract code. We therefore divide runtime-metered BAL into three components. Because all three are converted at 16 data gas per runtime byte, their shares are identical whether measured in runtime bytes or data gas:
- g_{\mathrm{state-only}}^0: data gas from bytes directly associated with persistent state creation;
- g_{\mathrm{coproduced}}^0: data gas from access-related bytes generated by transactions that also create state; and
- g_{\mathrm{nonstate}}^0: data gas from bytes generated by transactions with no observed state creation.
At the historical anchor,
with component shares
The decomposition measures the three shares directly. Projecting co-produced BAL requires an allocation assumption because these bytes arise from access activity inside state-creating transactions. Define the realized activity ratios
where A denotes existing-state access activity. Access activity is not separately observed. The historical panel contains no independently priced state-access quantity, so we proxy it with total execution activity. Writing R_{\mathrm{execution}}=q_{\mathrm{execution}}/q_{\mathrm{execution}}^0,
The central case sets \rho_A=1, which holds access intensity constant as execution scales. The sensitivity values \rho_A=0.75 and 1.25 let that intensity fall or rise with execution. All three pass through the same historical BAL anchor, because R_{\mathrm{execution}}=1 there.
Let \lambda\in[0,1] assign a fraction \lambda of co-produced BAL to state activity and the remaining fraction 1-\lambda to access activity. Realized BAL then satisfies
Equivalently,
where
This relationship maps realized parent activity into runtime BAL gas. The bundle-priced model below determines the activity ratios after including the BAL data charge in the execution and state parent prices.
By decomposing the 6,000 sampled blocks, we get the following results:
| Runtime-meter group | Runtime BAL bytes | Share of runtime BAL |
|---|---|---|
| State creation | 81.997M | \omega_{\mathrm{state-only}} = 11.394\% |
| Co-produced access in state-creating transactions | 272.603M | \omega_{\mathrm{coproduced}} = 37.879\% |
| Non-state execution | 365.066M | \omega_{\mathrm{nonstate}} = 50.727\% |
| Total | 719.666M | 100.000% |
The co-produced group measures BAL bytes created by storage and account access that the transaction performs alongside state creation. Resampling blocks within each day gives sampling standard errors of 0.14, 0.14, and 0.18 percentage points on the three shares, so the sample size is not what limits them. The attribution assumptions described above are the binding constraint.

Runtime-meter components across the 6,000-block panel. The first panel reports each component’s contribution to total BAL bytes. The second separates direct state creation, co-produced access in state-creating transactions, and bytes from transactions with no observed state creation.
What this says about BAL. Only 11.4% of runtime BAL is directly attributable to state creation. The remaining 88.6% is generated by access/execution activity not directly matched to persistent state creation. Under EIP-7999, the BAL charge lands on the data resource, but what it is actually pricing is overwhelmingly a byproduct of execution, not a resource that users demand and size for themselves.
This is the reason the model that follows gives BAL no demand curve of its own and instead attaches its charge to the price of the parent activity. It also sets expectations for the equilibrium: because BAL is produced mostly by execution, the data fee imposes a constraint on execution through a channel that did not exist before EIP-7999, and the runtime BAL inherits execution’s price response rather than expressing one of its own. This is the takeaway we carry into the next stage of the modeling.
Co-produced access inside state-creating transactions
The counterfactual analysis considers three allocations:
- \lambda=0 assigns all co-produced access to execution/access activity;
- \lambda=0.5 divides it equally between state and execution/access activity; and
- \lambda=1 assigns all co-produced access to state activity.
The central specification sets \lambda=0. Direct state-creation bytes follow state activity, while access-related bytes follow the execution/access activity in which they are generated. This resource-based allocation is consistent with the independent demand curves used for execution and state elsewhere in the analysis. The values \lambda=0.5 and 1 provide structural sensitivities for stronger coupling between state-creating transactions and their co-produced access.
At fixed realized activity ratios, the effect of the allocation is
As we plan to scale execution gas target much more than the state gas target from the anchor, assuming state access intensity scales (super-)proportionally as execution scales (i.e., \rho_A \ge 1), state access expands faster than state creation R_A>R_{\mathrm{state}}. Therefore, \lambda = 0 places the most BAL pressure on the data resource. This is important in future EIP-7999 equilibrium analysis: if a data target is feasible and there exists a data equilibrium under \lambda = 0, there exists a data equilibrium under \lambda > 0.
Sub-proportional access scaling is the exception. At \rho_A=0.75, access expands more slowly than state creation at the lower execution targets, and the ordering reverses. We keep \rho_A=0.75 as a sensitivity.
BAL demand model
Why BAL cannot have a demand curve of its own
A tempting alternative is to give BAL an independent isoelastic demand curve in the data fee, analogous to static calldata. That specification is problematic for two reasons. First, once parent execution and state activity are held fixed, a lower data fee mechanically expands BAL even though BAL is not independently chosen. Second, it omits the reverse channel through which an expensive BAL charge can suppress the execution and state activity that generates it.
Runtime BAL is assembled by the protocol from the accounts and storage slots touched during execution. Users cannot reduce it independently; they must reduce or change the parent activity that creates it. The appropriate demand object is therefore the parent execution or state activity, evaluated at a price that includes its BAL charge.
Concretely, if a user undertakes q units of execution activity and that mechanically produces w\,q units of BAL data gas, then under EIP-7999 the user pays m_{\mathrm{execution}}b_{\mathrm{execution}}q on execution and w\,b_{\mathrm{data}}q on data. Only the total fee enters the decision of whether to transact. So BAL needs no demand curve of its own — the price of its parents simply has a second term in it.
BAL intensities
The measured attribution converts into data gas produced per historical unit of parent activity:
with \omega_{\mathrm{state}}(\lambda)=\omega_{\mathrm{state-only}}+\lambda \omega_{\mathrm{coproduced}} and \omega_{\mathrm{execution}}(\lambda)=\omega_{\mathrm{nonstate}}+(1-\lambda)\omega_{\mathrm{coproduced}}.
| \lambda | w_{\mathrm{execution}} | w_{\mathrm{state}} | w_{\mathrm{execution}}/m_{\mathrm{execution}} | w_{\mathrm{state}}/m_{\mathrm{state}} |
|---|---|---|---|---|
| 0 | 0.0710 | 0.0417 | 0.0462 | 0.0074 |
| 0.5 | 0.0558 | 0.1110 | 0.0363 | 0.0196 |
| 1 | 0.0407 | 0.1803 | 0.0264 | 0.0319 |
Carrying the access proxy R_A=R_{\mathrm{execution}}^{\rho_A} through, the execution-linked BAL component and its average intensity are:
The bundle price uses the average intensity \bar w_{\mathrm{execution}}. This matches the aggregate demand index and the observed average BAL per historical execution unit, and it preserves the measured anchor charge for every \rho_A.
Expressed per unit of metered EIP-7999 gas rather than per historical unit, the intensities become w_{\mathrm{execution}}/m_{\mathrm{execution}}=0.046 and w_{\mathrm{state}}/m_{\mathrm{state}}=0.0074 at \lambda=0. Each unit of metered execution gas produces approximately 0.046 units of BAL data gas, and each unit of metered state gas approximately 0.0074.
Both are gas quantity ratios. They describe how much BAL data gas each unit of parent gas mechanically drags along, not what fraction of the parent’s fee the BAL charge represents; converting them into a fee ratio requires multiplying by b_{\mathrm{data}}/b_{\mathrm{execution}} or b_{\mathrm{data}}/b_{\mathrm{state}}, which the equilibrium determines.
The two intensities differ far more than the attribution shares alone suggest, because they are divided by different anchors. The gap is EIP-8037 repricing, which meters state creation at 5.66× against execution’s 1.54×: creating state is expensive in gas, and the accesses that accompany it are not, so the same BAL bytes are spread over a much larger metered state base.
BAL-inclusive parent prices
Each parent activity is priced at its own metered charge plus the average BAL charge that activity mechanically generates:
Static transaction content keeps its own price, m_{\mathrm{data,static}}b_{\mathrm{data}}.
These are BAL-inclusive parent prices, not complete transaction-composite prices. The static data carried by the same transactions, and the execution gas carried by state-creating transactions, remain outside them.
The demand curves
Execution and state demand keep the functional form and the estimated elasticities from the resource-elasticity report. What changes is the price at which each curve is evaluated:
Runtime BAL is then whatever the realized parent activity produces:
Because the average execution intensity depends on realized execution whenever \rho_A\ne1, the execution equation is implicit:
A higher b_{\mathrm{data}} raises both parent prices, reduces parent activity, and thereby reduces BAL without introducing a separate BAL own-price elasticity. BAL is calculated from the realized activity rather than the capacity target, so it remains consistent when a resource underfills.
Total data gas is the sum of the two components:
Because the parent quantities depend on b_{\mathrm{execution}} and b_{\mathrm{state}} as well as b_{\mathrm{data}}, data demand is no longer a function of the data fee alone. Any equilibrium built on this model has to solve the three fees simultaneously.
Why the estimated resource elasticities apply to these prices
The model’s central behavioral assumption is that the estimated execution and state elasticities apply to activity responses to BAL-inclusive parent prices. The elasticities were recovered from the 2025 gas-limit events, which moved a single shared fee: execution, data, and state prices never varied independently, and BAL carried no charge at all. Those events therefore identify how activity responds to a proportional change in its total cost, not how it responds to each fee separately.
We interpret the recovered execution and state elasticities as responses to the effective price of the underlying activity. Under EIP-7999 that effective price includes the newly charged BAL footprint, so applying the historical elasticities to BAL-inclusive parent prices is our preferred way of carrying the estimates into the counterfactual. It is not identified by historical variation in separate execution and data fees, and it assumes the response depends on the total price rather than on how that total is split across fee lines.
This is the same logic already used for the metering multipliers. m_i converts a base fee into the effective price of historical activity; the BAL adds another component to that same effective price. Leaving it out would assume users respond to their execution charge and ignore the BAL charge entirely, which is a stronger thing to believe about a cost appearing on the same fee.
The BAL bundle pricing feedback
The feedback from BAL pricing to data demand is easier to evaluate with a quantitative example. A higher data base fee directly reduces static-data demand, but it also raises the BAL-inclusive prices of execution and state activity. Parent activity then contracts, less runtime BAL is generated, and total data demand falls further:
To isolate this second channel, we hold the execution and state base fees fixed at their anchor-equivalent values,
and vary only the data base fee. This is an illustrative partial-equilibrium diagnostic rather than a solved EIP-7999 equilibrium.
The figure compares two specifications. In the no-feedback benchmark, parent demand ignores the BAL charge, so runtime BAL remains fixed at g_{\mathrm{BAL}}^0 and only static-data demand responds to b_{\mathrm{data}}. In the bundle-priced model, the BAL charge enters both parent prices, reducing execution and state activity and therefore the runtime BAL they generate.
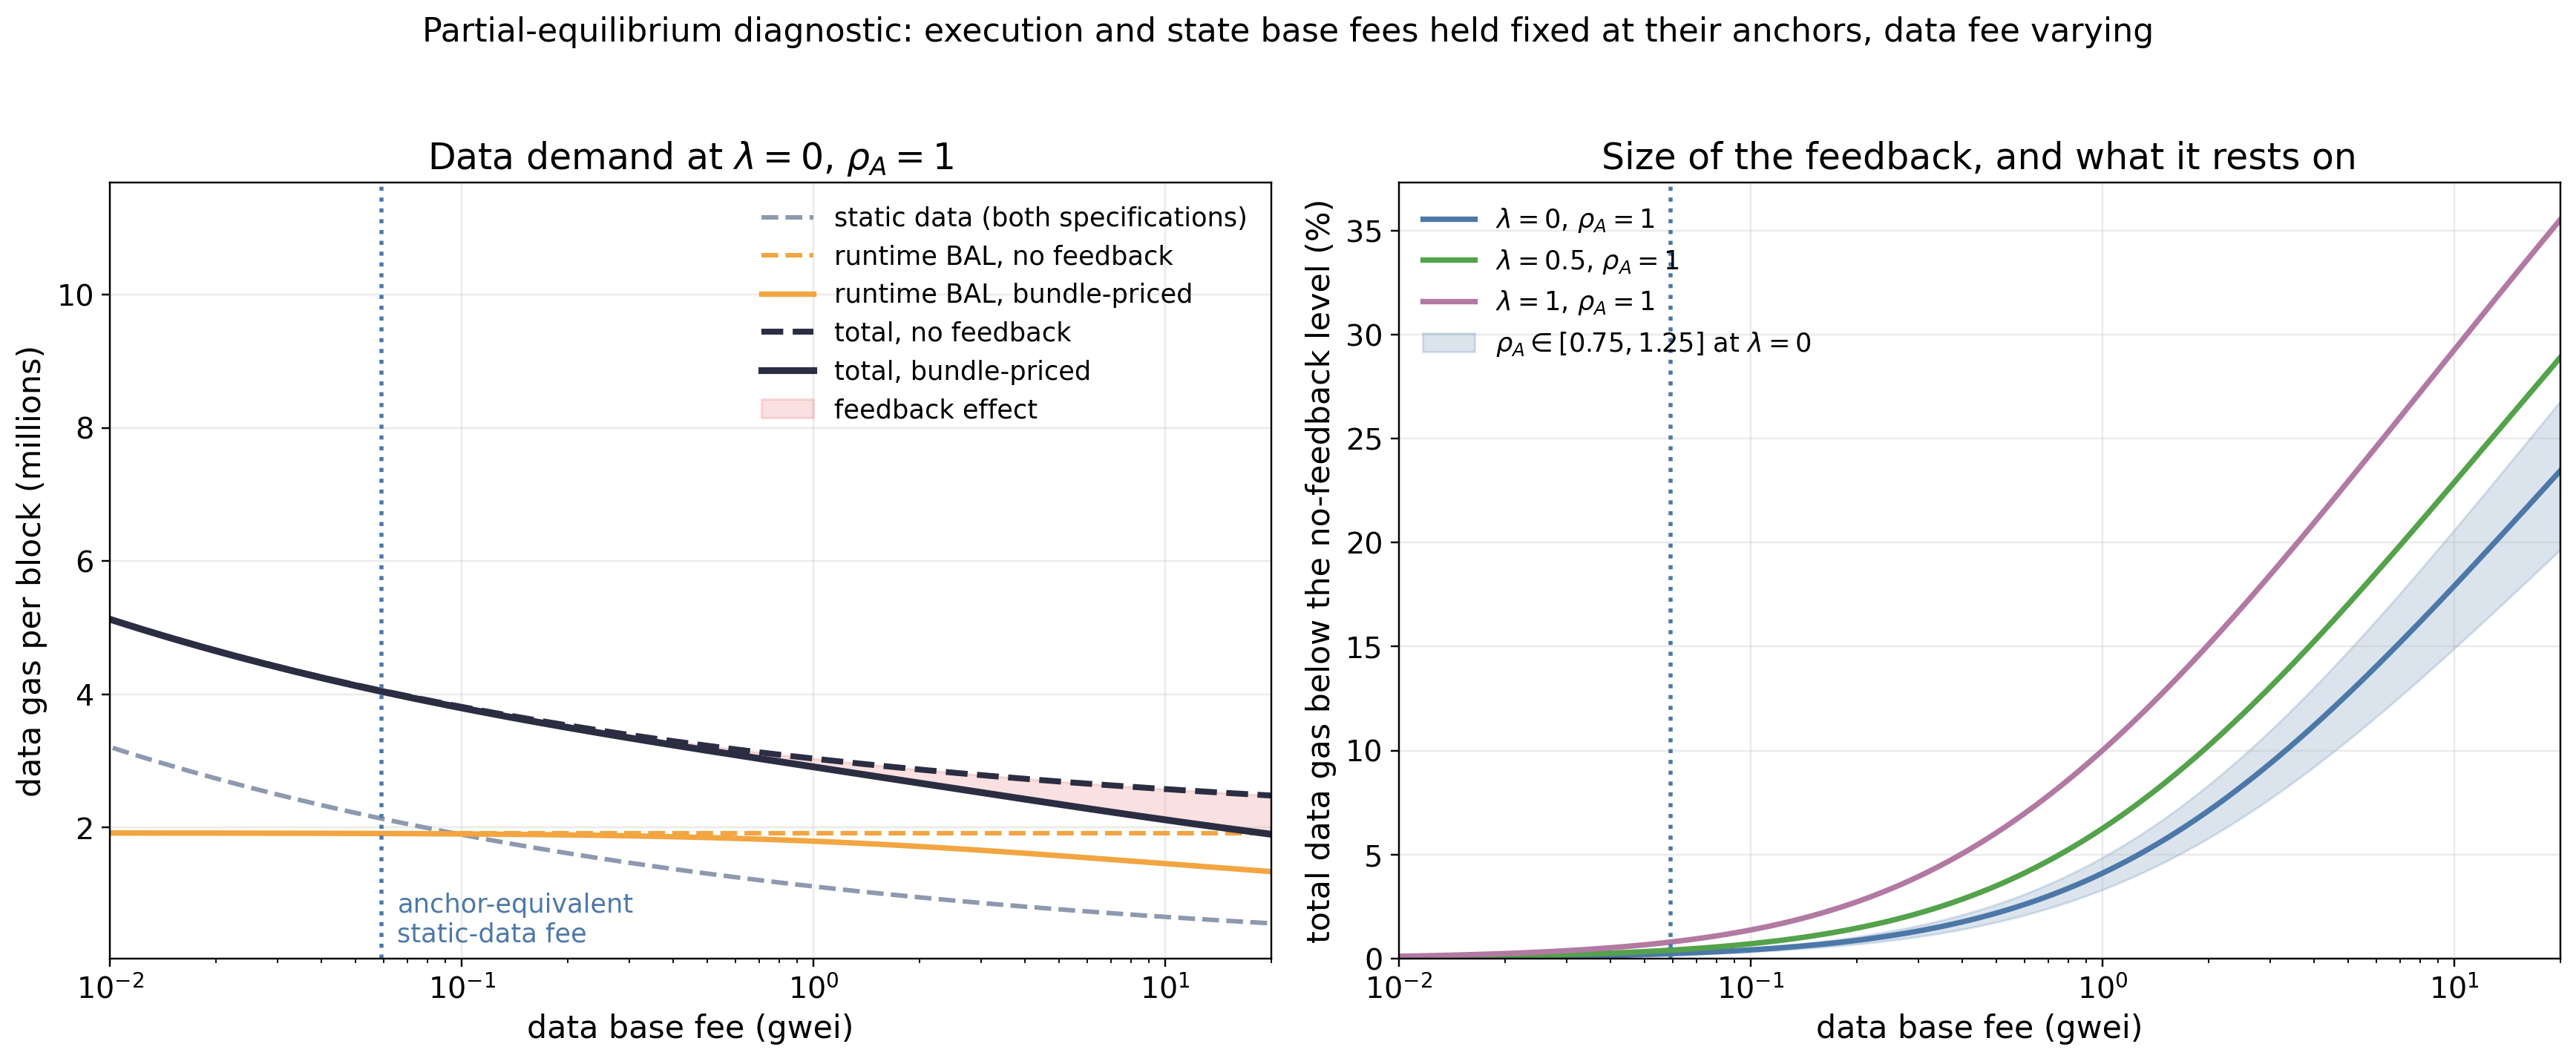
Illustrative partial-equilibrium response. Execution and state base fees are held fixed at their anchor-equivalent values while the data base fee varies.
Left: static data, runtime BAL, and total data demand under the no-feedback and bundle-priced specifications. The shaded area is the reduction caused by BAL-price feedback.
Right: the reduction in total data demand under alternative \lambda and \rho_A assumptions. The dotted line marks the anchor-equivalent static-data fee b_{\mathrm{data}}^0. These curves isolate the feedback channel and are not solved three-fee equilibrium paths.
At the anchor-equivalent static-data fee b^0_{\mathrm{data}}, bundle pricing reduces total data demand by only 0.24%. The effect is not exactly zero because the individual fee anchors are accounting references rather than an EIP-7999 equilibrium: introducing BAL pricing adds a positive charge to execution and state even when their own base fees remain at their anchor-equivalent values.
The feedback grows as the data fee rises. Relative to the no-feedback specification, total data demand is 4.1% lower at 1 gwei, 12.8% lower at 5 gwei, and 23.5% lower at 20 gwei. At 5 gwei, runtime BAL falls from 1.92M to approximately 1.58M data gas per block. Thus, the feedback is small near the anchor but becomes material at the higher data-fee levels shown. This is why the full equilibrium must solve execution, data, and state fees jointly rather than clearing the data dimension independently.
The sensitivity panel shows which assumptions drive this effect. Increasing \lambda routes more co-produced BAL through state, whose estimated elasticity is larger than execution’s, and therefore strengthens the response. At 5 gwei, the reduction in total data demand is 12.8% at \lambda=0, 17.1% at \lambda=0.5, and 23.0% at \lambda=1. Varying \rho_A from 0.75 to 1.25 has a smaller effect, producing reductions between 10.6% and 14.9%.
Thus, \lambda=0 is conservative for the size of this isolated price-feedback effect. This does not conflict with the companion equilibrium result that \lambda=0 can produce the largest level of BAL demand in the tested capacity configurations. The first comparison depends on which parent is more price-responsive; the second depends on which parent activity expands more at equilibrium.
Limitations
The bundle prices remain aggregate. P_{\mathrm{execution}} and P_{\mathrm{state}} include the average BAL charge generated by each parent activity. Static data carried by the same transactions remains on its own demand curve, and the model does not require every resource used by a transaction to enter or exit together. This treatment is consistent with the aggregate elasticities estimated in the earlier analysis, but it does not model changes in transaction composition.
Allocation of co-produced BAL. The transaction-level decomposition measures the amount of runtime BAL directly matched to state creation, co-produced alongside state creation, and generated by transactions with no observed state creation. We do not identify how the co-produced component would scale when execution and state prices vary independently. We therefore set \lambda=0 in the central specification, assigning co-produced access to the execution/access parent activity, and use \lambda\in\{0,0.5,1\} as a sensitivity range. These values represent alternative behavioral allocations rather than estimated probabilities or coefficients.
Execution is a proxy for existing-state access. Since we do not separately identify the demand of state access, the counterfactual mapping A/A^0=(q_{\mathrm{execution}}/q_{\mathrm{execution}}^0)^{\rho_A} allows BAL intensity to change as execution expands. The values 0.75, 1, and 1.25 bracket sub-proportional, proportional, and more-than-proportional scaling; they are sensitivities rather than predictions.
Takeaways and Next Steps
In this analysis, we establish the static-data metering multiplier under EIP-7999, the runtime-BAL gas anchor, and the decomposition of BAL between execution/access and state-creation activity. Because BAL is generated by parent activity rather than demanded independently, its data charge is included in the prices of execution and state activities that generate it. The next step is to combine these inputs with the estimated resource elasticities and solve the joint EIP-7999 equilibrium for execution, data, and state base fees.
Parameters carried into the EIP-7999 equilibrium model
Samples
| Sample | Size | Used for |
|---|---|---|
| Canonical blocks | 860,505 | Full-population calldata, blob hashes, and the EIP-7623 denominator |
| EIP-8279 runtime sample | 6,000 blocks, 50 per day | Runtime BAL anchor and the three-way decomposition |
| RPC static-field sample | 6,000 blocks | Access-list contents and authorization tuples |
| BAL RLP encode construction sample | 2,000 blocks | Encoded-BAL comparison |
Anchors and multipliers
| Parameter | Value | Std. error | Interpretation |
|---|---|---|---|
| Price anchor p^0 | 0.106928 gwei | — | Median of daily median base fees |
| Execution activity q_{\mathrm{execution}}^0 | 23.942M gas/block | — | Historical gas-equivalent execution |
| State activity q_{\mathrm{state}}^0 | 5.244M gas/block | — | Historical gas-equivalent state creation |
| Current EIP-7623 data q_{\mathrm{data}}^0 | 1.180555M gas/block | — | Static-data denominator |
| m_{\mathrm{execution}} | 1.537898 | — | EIP-8038 and EIP-2780 execution repricing |
| m_{\mathrm{state}} | 5.656315 | — | EIP-8037 state gas with CPSB = 1530 |
| m_{\mathrm{data,static}} | 1.807251 | 0.001513 | Static-data accounting conversion |
| Static-data anchor g_{\mathrm{static}}^0 | 2.133559M data gas/block | 0.001786M | Flat-16 calldata plus access lists, authorizations and their static BAL entries, and blob hashes |
Runtime BAL
| Parameter | Value | Std. error | Interpretation |
|---|---|---|---|
| Runtime-meter anchor | 119,944 bytes/block | 661 | EIP-8279 reconstruction over the 6,000-block sample |
| Metered anchor g_{\mathrm{BAL}}^0 | 1.919100M data gas/block | 0.010578M | Runtime counter at 16 data gas per byte |
| Direct-state share \omega_{\mathrm{state-only}} | 0.113937 | 0.001414 | Bytes matched to persistent state creation |
| Co-produced share \omega_{\mathrm{coproduced}} | 0.378791 | 0.001429 | Remaining bytes in state-creating transactions |
| Non-state share \omega_{\mathrm{nonstate}} | 0.507272 | 0.001775 | Bytes in transactions with no observed state creation |
Demand responses and structural parameters
| Parameter | Value | Interpretation |
|---|---|---|
| \epsilon_{\mathrm{execution}} | 0.079 - 0.121 | Applied to the BAL-inclusive execution price |
| \epsilon_{\mathrm{data}} | 0.201- 0.229 | Applied to static data only |
| \epsilon_{\mathrm{state}} | 0.254 - 0.478 | Applied to the BAL-inclusive state price |
| w_{\mathrm{execution}} | 0.071023 | Data gas per historical execution unit, at \lambda=0 |
| w_{\mathrm{state}} | 0.041695 | Data gas per historical state unit, at \lambda=0 |
| w_{\mathrm{execution}}/m_{\mathrm{execution}} | 0.046182 | Data gas per unit of metered execution gas |
| w_{\mathrm{state}}/m_{\mathrm{state}} | 0.007371 | Data gas per unit of metered state gas |
| Co-produced allocation \lambda | 0 central; 0.5 and 1 as sensitivity | Share of co-produced access routed through state rather than execution |
| Access-scaling \rho_A | 1 central; 0.75 and 1.25 as sensitivity | Sub-proportional, proportional, and more-than-proportional scaling of access within execution |
The three elasticities are estimated in the previous elasticity analysis and carried into this one, as are p^0, the two activity anchors, and m_{\mathrm{execution}} and m_{\mathrm{state}}. Everything else in these tables is produced by the notebooks accompanying this post.
Appendix: Data sources
EIP-8279 runtime counter and state/execution attribution
| Source | Runtime components used |
|---|---|
Xatu default.canonical_execution_transaction_structlog_agg |
Cold account and storage accesses |
Xatu default.canonical_execution_storage_diffs |
Storage values that remain different from their pre-transaction value |
Xatu default.canonical_execution_traces |
Value-bearing calls, self-destruct transfers, internal creation, endowment, and deployed code |
| Xatu storage, contract, balance, nonce, and address-appearance tables | Transaction-level new slots, accounts, and code used for state-linked matching |
Xatu default.execution_transaction |
Transaction and calldata byte counts |
Xatu default.canonical_execution_transaction |
Receipt gas used only for the appendix cost diagnostic |
Encoded-BAL comparison
| Source | Fields used |
|---|---|
| Ethnodeops Erigon RPC sample | Complete block bodies and state diffs, from which the BAL is reconstructed and RLP-encoded to measure its physical size |
| Xatu runtime sample | The EIP-8279 counter for the same blocks |
The comparison uses the 2,000 blocks present in both samples.
Static-data metering multiplier
| Source | Fields used in the static-data calculation |
|---|---|
Xatu default.canonical_execution_block |
Canonical block dates and block coverage |
Xatu default.canonical_execution_transaction |
Receipt gas and zero/nonzero calldata bytes used to reconstruct current EIP-7623 data gas |
Xatu default.execution_transaction |
Exact calldata bytes, zero/nonzero byte counts, type-4 transaction counts, and blob-versioned hashes |
| Ethnodeops Erigon RPC sample | Access-list contents and authorization tuples not fully exposed by the Xatu transaction tables |