This post is a report on research done by Wenxuan Deng under the supervision of Daniele Palombi as part of an internship centered on MVI at 20squares. This research was backed by Cyber.Fund. We wish to thank Artem Kotelskiy and @kkulk for their feedback.
Introduction
In the rapidly evolving landscape of Ethereum, understanding the staking decisions of key actors in the ecosystem is critical to grasping the broader implications of changes in ETH issuance. This report aims to analyze the reactions of these actors by examining data-driven estimates of individual behaviors in response to fluctuations in issuance. To achieve this, we will focus on how agents in the Ethereum network respond to various states of the system over time.
However, this is a challenging and complex task. Given the numerous unobservable factors at play, drawing definitive causal conclusions is not feasible. Despite these limitations, identifying patterns within the data remains a valuable exercise. By doing so, we can shed light on the underlying drivers of behavior in the ecosystem.
Given these dynamics, this report is centered on the following research question: How do different categories of Ethereum stakers adjust their behavior in response to major protocol changes and market events, and what are the resulting implications for network decentralization? To answer this, we analyze the behavior of different subgroups of staking entities to see how their decisions evolve over time, ultimately feeding these observations into a simulation model to explore potential future outcomes.
Interestingly, the data suggests that there is little evidence to support a direct correlation between average inflows or outflows of ETH and short-term price fluctuations. Instead, the observed inflows and outflows appear to be more strongly influenced by shifts in longer-term perspectives. Consequently, simulations that focus on short-term changes in parameters may not be as reliable in predicting outcomes. This report will explore these dynamics in detail, offering insights into the factors that truly drive staking decisions in the Ethereum ecosystem.
Contributions
This report makes the following contributions:
- It develops an agent-based simulation model of the Ethereum staking ecosystem, providing a framework for analyzing agent reactions to different market conditions and policy changes.
- It shows through simulation that altering the issuance policy alone may not be sufficient to meaningfully impact staking distribution or promote greater decentralization among smaller stakeholders.
- It demonstrates through an event-based analysis that staking behavior is significantly influenced by long-term protocol changes (e.g. the Shanghai upgrade) and fundamental market shifts (e.g. the BTC ETF approval) rather than short-term price shocks and volatility.
To explore these complex dynamics, the core of this report is an agent-based simulation designed to model staker decision-making under various economic scenarios. This simulation framework allows us to test hypotheses about agent behavior and the potential impact of protocol changes, such as adjustments to the issuance policy. To ground our simulation in reality, the subsequent sections provide a data-driven analysis of the Ethereum staking ecosystem. We present:
- An event-based analysis to show how staking behavior responds to major market shifts.
- A descriptive analysis of network centralization over time.
Simulations
Why Agent-Based-Simulation?
In complex systems like blockchain ecosystems, where market dynamics and individual agent behaviors intertwine, agent-based simulation (ABS) offers a powerful framework for capturing nuanced interactions and emergent patterns. For this research, we utilized RadCAD to construct a simulation model driven by agent-specific parameters and environmental conditions. This framework enables us to define agents with distinct profiles and simulate their behaviors under different market scenarios, creating a robust platform for exploring market evolution.
Simulation Framework
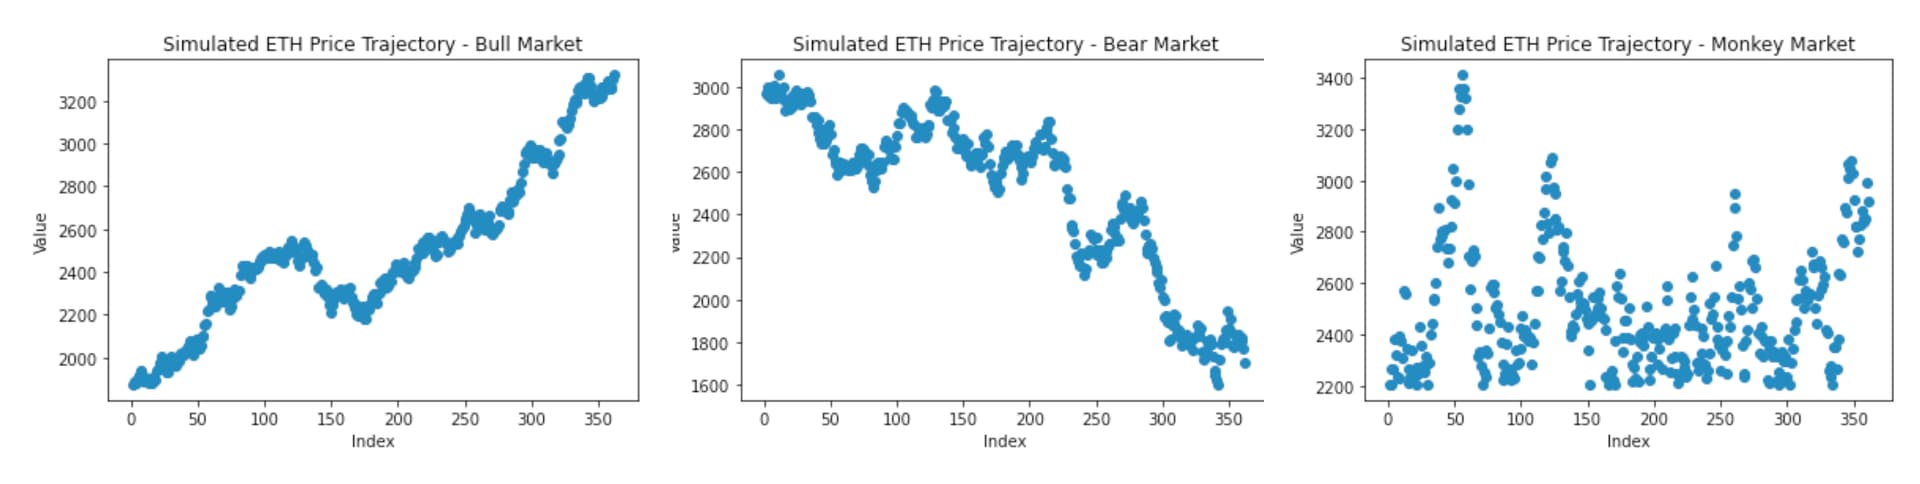
We employed Brownian motion to generate random walks representing various Ethereum price trajectories, constrained by predefined market conditions. This approach allowed us to simulate environments under bullish, bearish, or neutral trends, generating unique price paths in each experiment that accurately reflect the volatility within each market condition. By leveraging RadCAD’s flexible architecture, we constructed a series of experiments in which these varied price trajectories served as the foundation for understanding agent reactions in diverse market states.
Modeling Stake and Unstake Behaviors
One critical challenge we encountered was the inherent unpredictability of staker behavior. High levels of noise and ambiguous causality in real-world data made it difficult to develop a predictive model for agent decisions directly from historical data. To address this, we opted for a zero-inflated Poisson distribution to model stake and unstake actions across agents, producing a probabilistic representation of these behaviors. Within our model, stake (B_{i,t}) and unstake (S_{i,t}) actions for each agent 𝑖 at each timestep 𝑡
were sampled from this distribution, capturing the sporadic nature of staking flows while allowing for more nuanced agent simulations.
By creating this structured yet flexible simulation environment, our approach with RadCAD provides valuable insights into the complexities of staking behavior and the dynamics within Ethereum’s ecosystem, particularly as agents adjust to volatile market conditions.
Simulation Methodology
1. Agent Sampling and Categorization
Our agent-based simulation distinguishes multiple categories of agents, each modeled to reflect real-world staker behavior in Ethereum’s ecosystem:
- Centralized Exchanges (CEX)
- Liquid Staking Tokens (LST)
- Liquid Restaking Tokens (LRT)
- Solo Stakers
- Staking Pools
Staking data and agent labels were sourced from Dune Analytics’ staking_flow dataset, which provides a granular view of staking activity across different agent types. This categorization allows us to simulate decision-making that mirrors real-world staking patterns and to investigate how agents respond to price volatility and macroeconomic shifts.
2. Parameter Initialization
As many individual agent parameters like future price expectations or opportunity costs are unobservable from the available data, we must make several simplifying assumptions to initialize the model. Given that our primary interest is in the comparison between different issuance policy regimes rather than the prediction of exact values, these assumptions provide a workable foundation.
The following drastic assumptions are made:
-
Myopic Price Expectation: We assume agents expect the next period’s price to be the same as the current price E_j[p_{t+1}] = p_t
-
Constant Staking Costs: We assume that staking costs are constant for each agent class (c_{j,t} = c_j) and are based on available data regarding hardware and operational expenses.
-
Fixed Opportunity Cost: The opportunity cost r_{j,t} = r is set to an arbitrary fixed value and is assumed to be the same for all agents. This is a parameter that can be adjusted in different simulation runs.
-
Proxy for Stake/Unstake Volume: Since we cannot observe an agent’s total capital available for staking (B_{j,t}) or the total amount eligible for withdrawal (S_{j,t}) we use the measured average historical staking inflow and outflow for each group as a proxy for these values.
3. Solving the Decision Problem
It is critical to note that we are not solving the decision problem via dynamic programming or another complex multi-period optimization method. The exact investment problem is under-specified and depends on numerous unobservable factors, making such an approach infeasible with the available data. Instead, we drastically simplify the decision to a single time period for each agent. The decision is based on a simple profit maximization rationale:
- An agent determines if the expected profit from staking one unit of ETH is positive or negative.
- The result is a binary choice: if the expected profit is greater than or equal to zero, the agent chooses to stake their available capital; otherwise, they choose to unstake.
o make this binary step function usable in a simulation environment, we approximate it using a smooth sigmoid logistic function. This method converts the rigid “all-or-nothing” decision into a probability, allowing for more nuanced and realistic agent behaviors where the likelihood of staking or unstaking changes smoothly with expected profit rather than shifting abruptly.
Revenue Estimation
To assess the revenue of Ethereum stakers, we apply the following formula:
\text{Revenue}=(\text{new issuance}+\text{priority fee}+\text{MEV}−\text{infrastructure cost})×(1−\text{commission fee})
In calculating normalized revenue, adjustments for inflation or deflation typically include ETH burning, as this impacts the overall supply. However, our focus here is on agent-specific revenue, so we simplify by excluding deflation adjustments related to ETH burning.
Due to the limited and variable nature of priority fees and MEV rewards, estimating their exact values presents challenges. For simplicity, we set the combined effect of priority fees and MEV at 0.5% of the revenue base. Large operator nodes, such as staking pools (e.g., p2p.org), tend to be more robust and have a higher likelihood of committee selection compared to solo stakers. Consequently, we allocate an additional 0.5% issuance APY alongside the priority + MEV contribution, totaling 1%, which is distributed according to market share. Thus, agents with larger market shares receive a proportionally larger share of issuance, priority fees, and MEV profits, while those with smaller shares receive less.
Infrastructure Costs
Infrastructure costs are essential for estimating net revenue, varying significantly between solo stakers and large operators like staking pools. Based on cost data (hardware depreciation over five years, operational expenses, and maintenance & growth costs), we distinguish between solo stakers and large operator nodes using a reference dataset. Both staking pools (encompassing both individual and commercial operators) and solo stakers bear their own infrastructure costs, making this a key factor in their revenue calculation.
For other agent categories:
Liquid Staking Tokens (LST) and Layer 2 Rollup Tokens (LRT) apply a 10% commission fee.
Centralized Exchanges (CEX) impose a higher 25% commission.
Using this structure, we calculate the revenue APY for each agent, incorporating infrastructure expenses, commission fees, and market share effects on the revenue distribution. This approach reflects the operational realities and market dynamics that define staking revenue within the Ethereum ecosystem.
Agent Decision Utility Functions
The goal of the following exercise is to arrive at some plausible aggregate supply curve on the basis of individual profit maximization rationale.
Preliminaries
Let f(P_t) denote issuance at time t. We will define anything below relative to y_t.
Expected yield for a given time horizon T, for individual i, depends on future price P_t, as well as the series of yields y_t, where t = 1, \ldots, T. Yield y_t depends on the issuance function f(\cdot), and the deposit levels D_t.
The exact investment problem is under-specifiied; it depends on other factors as well including reinvestment.
Obviously none of this observable for us or recoverable from the kind of data we have access to.
So, we drastically simplify the decision problem to a single time period t:
E[P_{t+1}] y_t - c_{i,t} - r_{i,t}
where c_{i,t} are the costs of staking one unit of ETH and r_{i,t} are the opportunity costs. Both denoted in USD.
Profit max rationale
Any individual agent faces budget constraints when choosing x_{i,t} (stake/unstake):
S_{i,t} \leq x_{i,t} \leq B_{i,t}
So, i maximizes
\max_{x_{i,t}} E_i[P_{t+1}] y_t - c_{i,t} - r_{i,t}
subject to:
S_{i,t} \leq x_{i,t} \leq B_{i,t}
The result of this problem is:
The result of this problem is:
x_{i,t} = \begin{cases} B_{i,t} & \text{if} \ E[P_{t+1}] y_t - c_{i,t} - r_{i,t} \geq 0\\ S_{i,t} & \text{otherwise} \end{cases}
Aggregation
We do not observe individual agents. So, instead let’s consider representative classes of agents. We assume that within groups agents are homogenous - obviously false but for the kind of exercise we are interested in, the effect across categories probably not too harmful.
The decision for agent i in class j:
X_{i}^{j}(y_t) = \begin{cases} n_j B_j & \text{if} \ E_j[P_{t+1}] \cdot y_t - c_{j,t} - r_{j,t} \geq 0 \\ n_j (-S_{j,t}) & \text{else} \end{cases}
Total supply over classes:
S(y_t) = \sum_{j=1}^{N} n_j[B_j \cdot \mathbb{1}(E_j[p_{t+1}] \cdot y_t - c_{j,t} - r_{j,t} \geq 0) - S_{j,t} \cdot \mathbb{1}(E_j[p_{t+1}] \cdot y_t - c_{j,t} - r_{j,t} \leq 0)]
Smoothing for simulations
For the simulation, let’s approximate the step function.
One way can be through a sigmoid logistic approximation:
\sigma(x) = \frac{1}{1 + e^{-\alpha(x - \theta)}}
where \theta is a correction factor (to make probability of investment close to zero if the x is close to zero). \alpha is the parameter determining the smoothness of the approximation.
The total supply over classes:
S(y_t) = \sum_{j=1}^{N} n_j [B_j \cdot \sigma(E_j[p_{t+1}] \cdot y_t - c_{j,t} - r_{j,t}) - S_{j,t} \cdot \sigma(-(E_j[P_{t+1}] \cdot y_t - c_{j,t} - r_{j,t}))]
Simulation Results
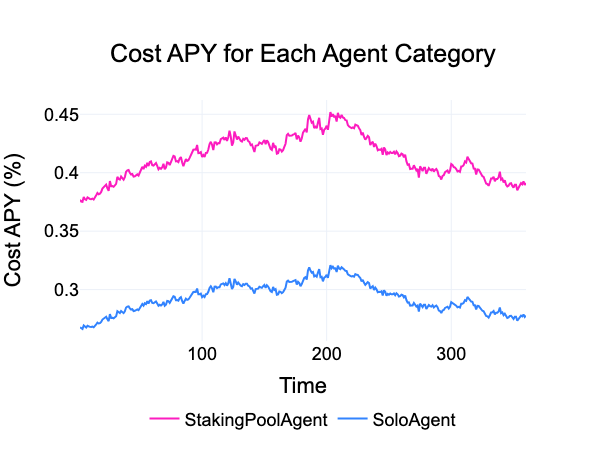
We begin by examining the impact of varying market conditions on revenue APY in our simulation for 1 year (365 days). Given our revenue estimation approach, infrastructure cost is the only factor significantly influenced by $ETH price fluctuations. Below, we present the APY of infrastructure costs for both solo stakers and staking pools under different market conditions.
Interestingly, large operator nodes, such as staking pools, incur higher infrastructure costs compared to solo stakers. This discrepancy arises primarily from the substantial operational and maintenance expenses associated with larger setups. These higher costs reflect the robustness and complexity of maintaining large-scale staking operations, which, while offering higher resilience and efficiency, also require more resources to manage effectively.
When calculating the overall revenue APY for each agent category, only solo stakers and staking pools exhibit substantial randomization, allowing us to compute their standard deviation (SD). For the other three categories—CEX, LST, and LRT—revenue volatility remains low. This is because their fluctuations are influenced mainly by the issuance rate (tied to total stake) and their respective staking amounts, leading to relatively stable revenue APYs.
These observations reveal a critical insight: the impact of ETH price volatility on infrastructure costs significantly drives revenue APY fluctuations, more so than changes in staking levels themselves. This is especially evident in the distinct patterns seen in solo staker and staking pool revenue APYs across various market conditions, where price shifts play a more prominent role in shaping their revenue variability. In contrast, for CEX, LST, and LRT, revenue APYs display a consistent downward trend across different market scenarios, reflecting their lower sensitivity to price-induced infrastructure cost changes. This reinforces the notion that ETH price volatility impacts infrastructure costs—and thus overall revenue APY—more profoundly than the variability introduced by staking adjustments.
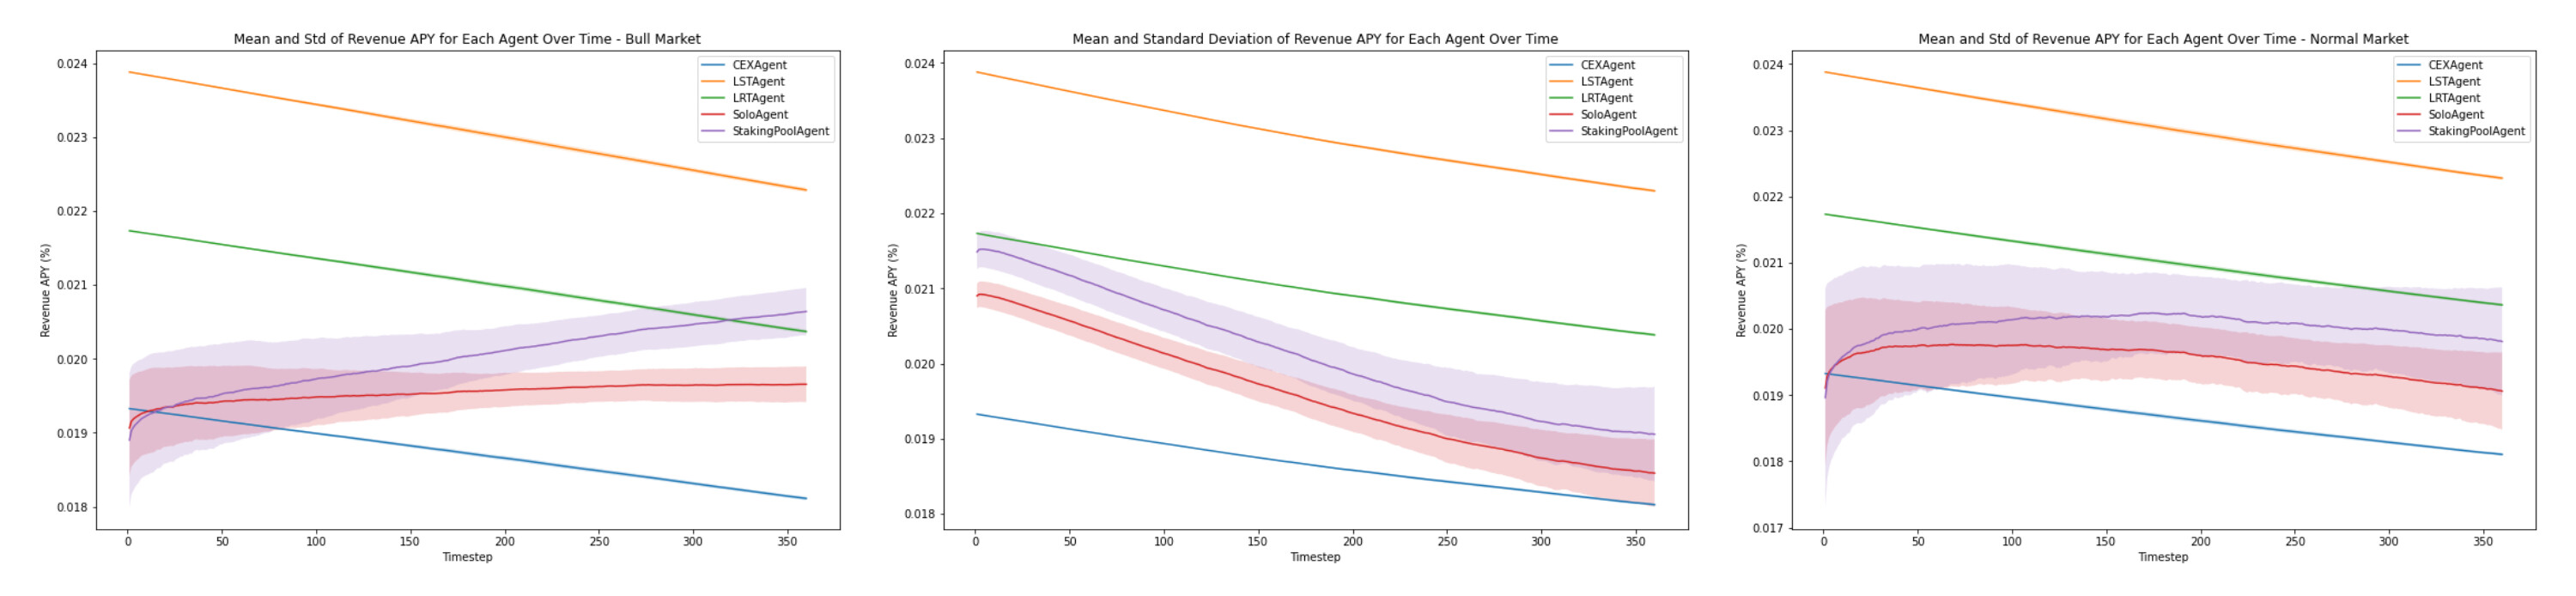
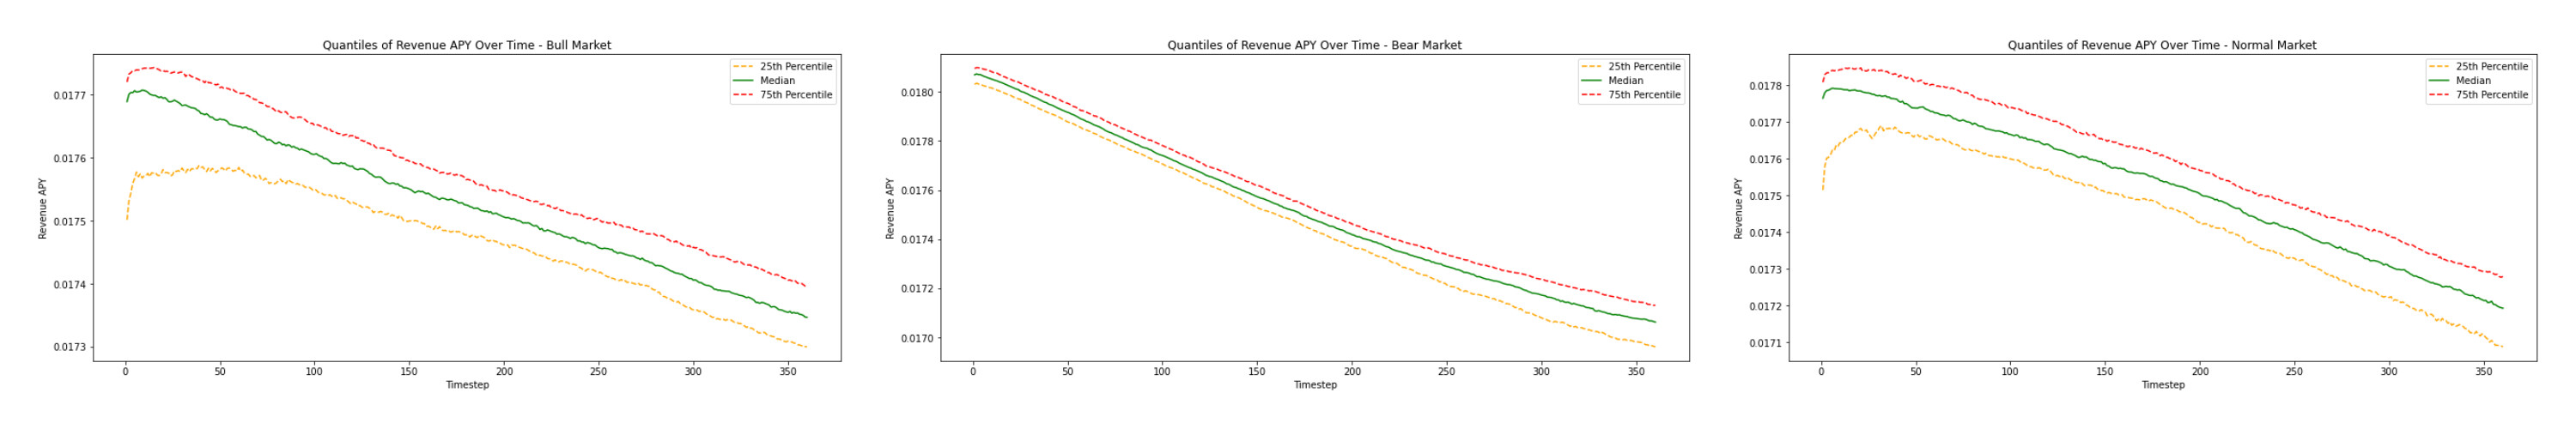
We also examined the average revenue APY across agent categories, and aside from the standard deviation (SD) differences, the general trend remains consistent regardless of market conditions.
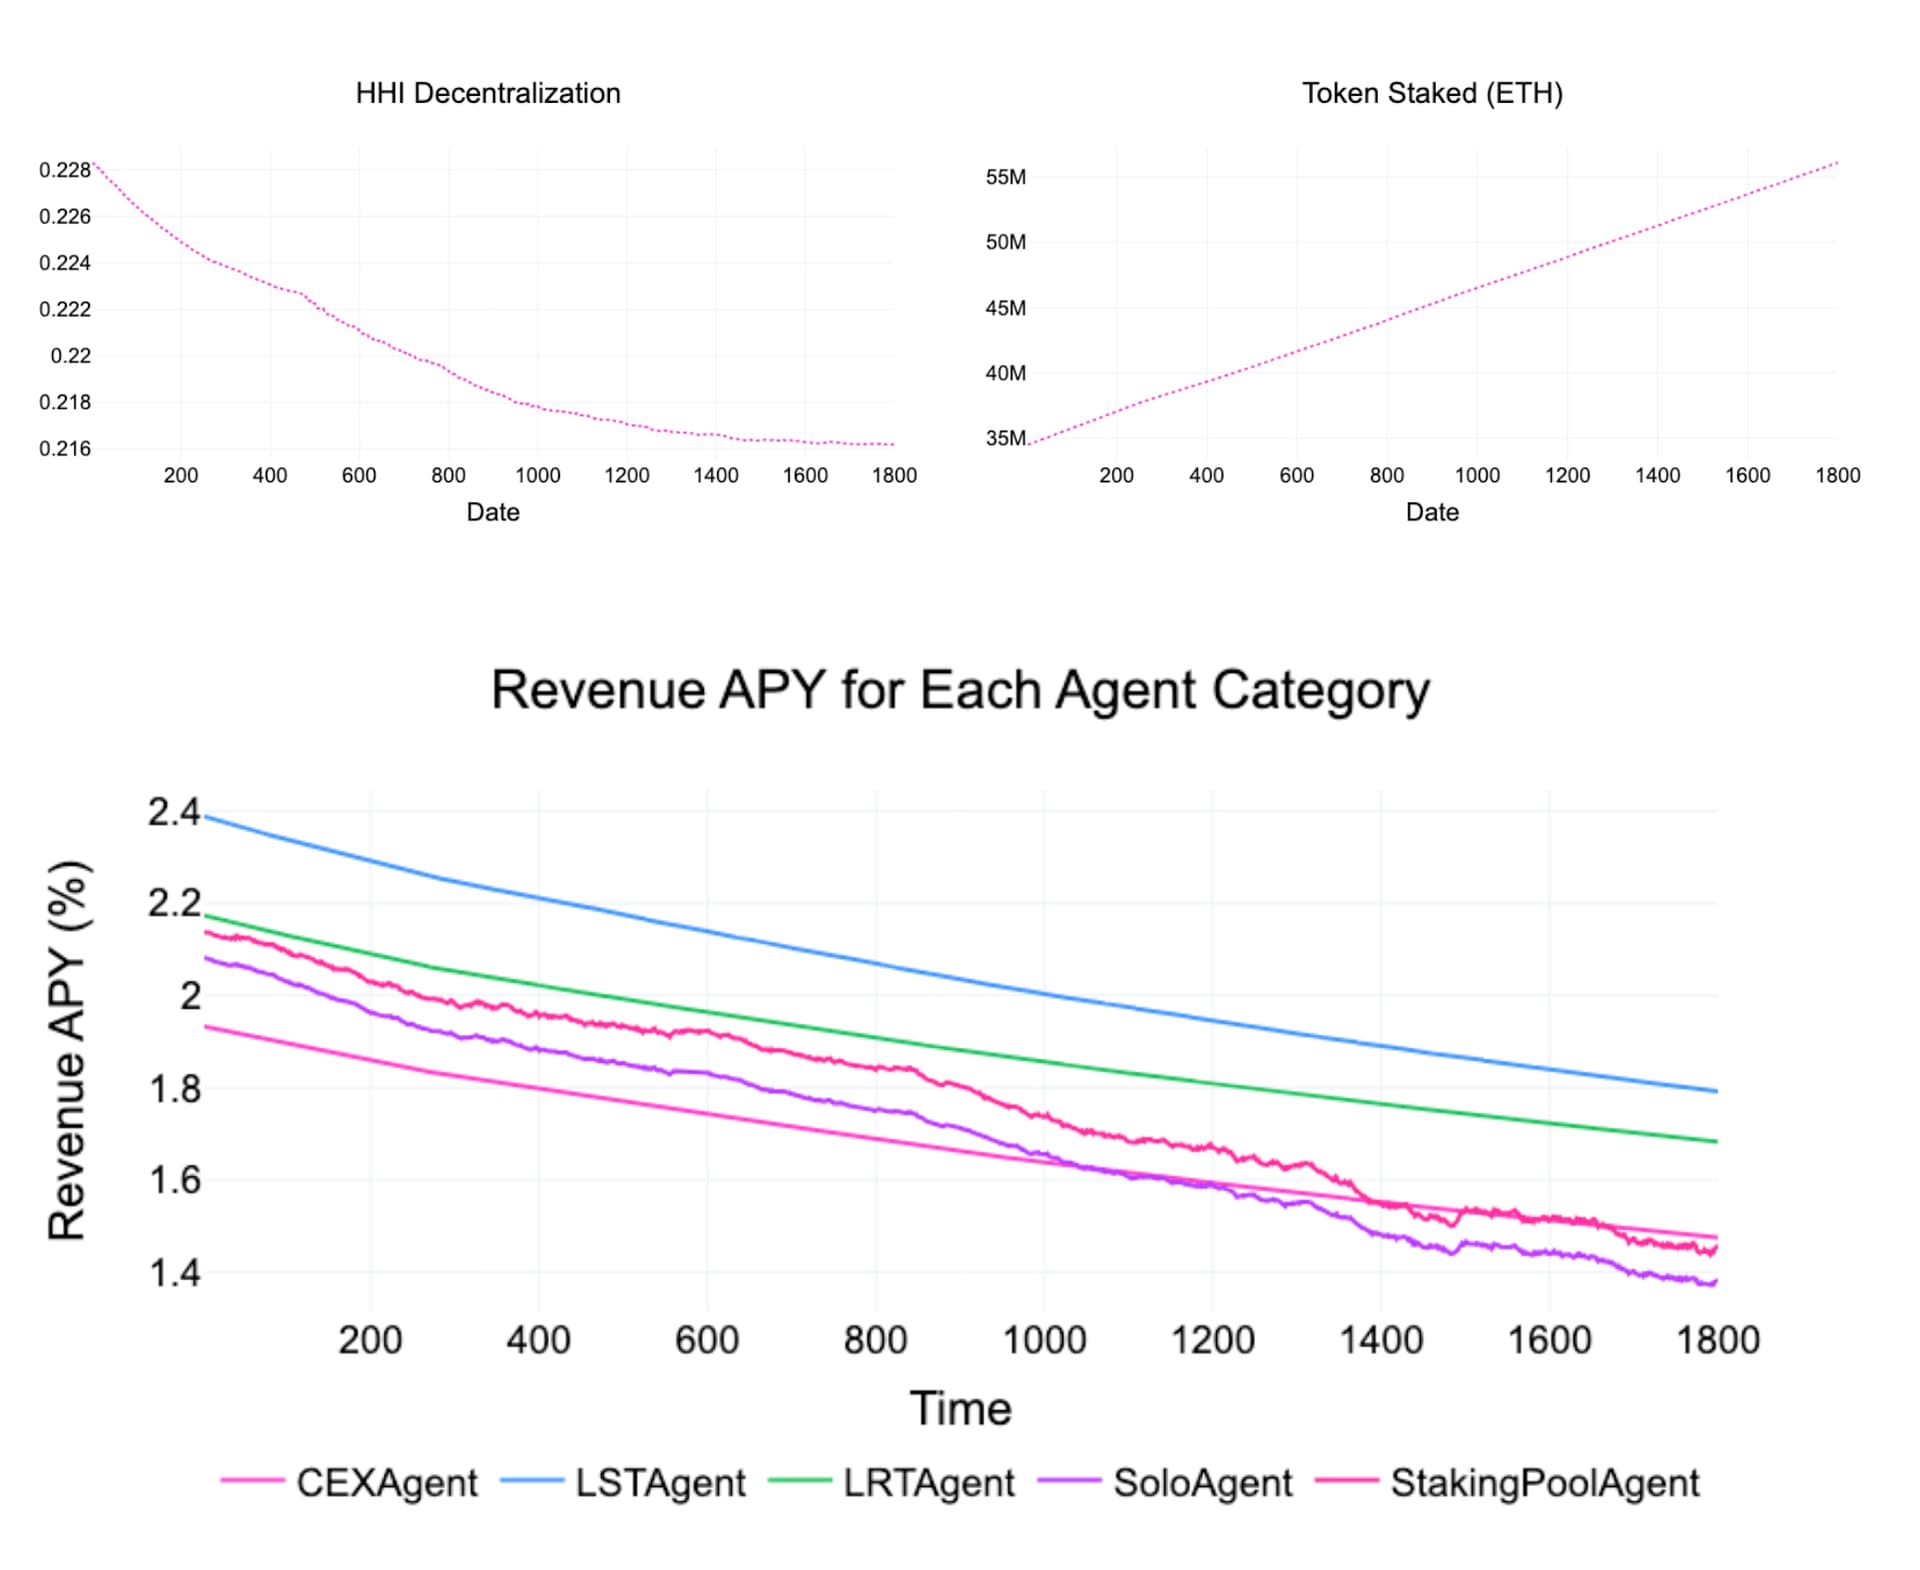
Expanding the simulation period from 1 year to 5 years, we aimed to observe if an equilibrium would emerge, particularly by monitoring the trajectory of total staked ETH. Contrary to a potential stabilization, our model framework instead shows a continuous increase in total staked ETH (as seen in the upper-right plot), with no signs of decline.
Additionally, we observed the HHI consistently decreasing, though the rate of decline gradually slows and eventually levels off. This deceleration is likely due to our sampling approach for stake/unstake behaviors, which results in two dominant categories—CEX and LST—accumulating progressively larger stakes. This suggests that, in practice, decentralization may reach a point of convergence, where ideal decentralization levels may never be fully attainable. As large players continue to accumulate staking share, decentralization might reach a practical limit, with HHI stabilizing at a suboptimal level rather than approaching complete decentralization.
Lastly, we evaluated a proposed new issuance policy suggested by Anders to assess whether this updated policy function would yield different outcomes within our simulation.
y = \frac{CF}{\sqrt{D}+(D/k)^3}
Despite implementing the new policy, there was no significant difference observed across the various metrics we monitored. Additionally, similar to the original setup, we did not observe the emergence of an equilibrium in total staked ETH or in other decentralization metrics. This lack of differentiation suggests that the new issuance policy does not materially impact staking behavior or the progression towards equilibrium within the parameters of our model.
In a Nutshell
While our simulation provides useful insights, there are several limitations worth noting:
Due to limited data, our revenue estimation remains approximate, with certain metrics relying on arbitrary assumptions. Since only solo stakers and staking pools are modeled to incur hardware and operational costs, these two categories are disproportionately affected by price volatility in their revenue APY compared to others.
Despite efforts to identify data-driven factors and causal relationships to better model the utility function for staking behavior, high data noise and limited granularity have restricted our approach. Consequently, the utility function modeling remains somewhat coarse and lacks precision.
One significant takeaway is that altering the issuance policy alone may not effectively influence smaller stakeholders or promote decentralization. Our simulations indicate that simply changing the issuance policy does not provide the incentives needed to significantly shift staking distribution toward smaller players.
Through thousands of independent simulations across various market conditions, we could approximate the general trend of revenue APY, offering a rough but valuable reference for expected revenue behavior under different scenarios.
Event-based analysis with market condition
In this part of the analysis we examine the behavior of Ethereum validators in relation to deposits, unstaking, and exits during significant market events. By analyzing these actions alongside fluctuations in $ETH prices, we provide a more nuanced understanding of how users adjust their staking positions in response to major market shifts. The combination of event-driven analysis and market conditions offers a holistic view of staking behaviors during key moments in the Ethereum ecosystem.
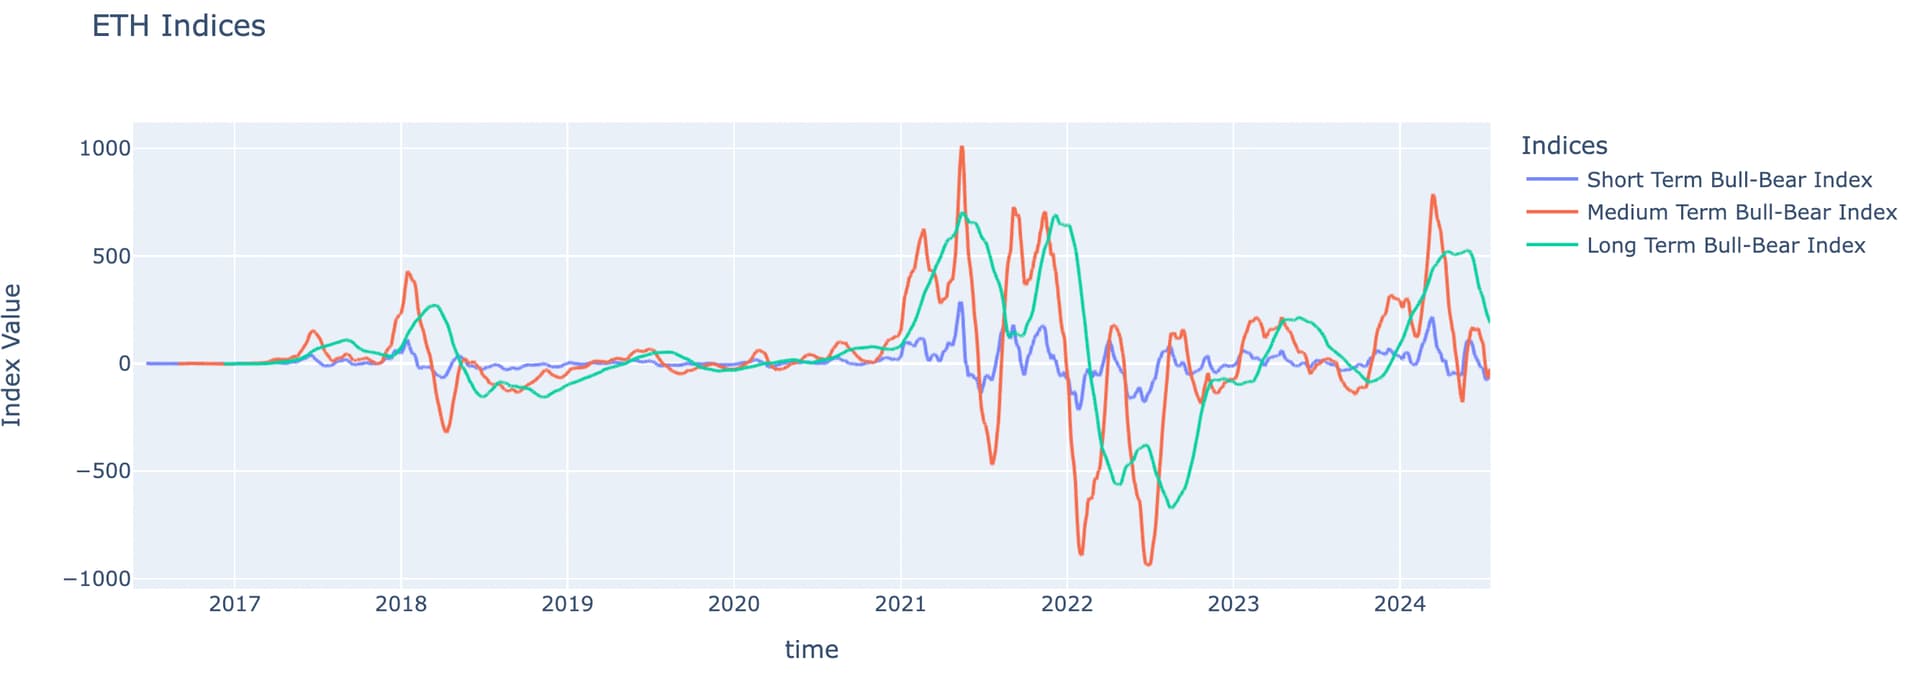
We assess the market across three dimensions: long-term, medium-term, and short-term bull and bear trends. These are defined using moving averages (MA) of eth prices as follows:
- Short-term: MA30 - MA10
- Medium-term: MA100 - MA30
- Long-term: MA200 - MA100
The short-term, medium-term, and long-term bull-bear indices are designed to indicate market trends. When the index is greater than 0, it signals a bullish (bull market) condition, while a value below 0 reflects a bearish (bear market) environment. The magnitude of the index correlates with the strength of the trend: the larger the positive number, the stronger the bullish trend, and vice versa for negative numbers.
This three-dimensional index system allows for a layered analysis of market conditions. For instance, even within a broader macro bullish trend (indicated by a strong positive long-term index), the short-term and medium-term indices can help identify micro-level bullish or bearish trends. This approach provides a comprehensive view of market dynamics across different timeframes, enabling more nuanced decisions based on both macro and micro market signals.
Moreover, we use this three-dimensional index system because staking decisions, especially for larger entities, are often strategic, long-term commitments rather than reactions to daily price volatility. Rolling averages are a standard method to smooth out short-term “noise” and identify underlying market trends and sentiment over different time horizons. This approach is based on the hypothesis that a validator’s propensity to stake or unstake is more closely tied to their perception of the market’s medium-to-long-term direction than to its day-to-day fluctuations. By analyzing these trends, we can better distinguish between transient reactions and sustained, strategic shifts in staking behavior.
The chart below visualizes Ethereum’s historical price using these three indicators. They do not always align consistently. The long-term indicator captures market trends over a 4-6 month window, while the short-term indicator reflects trends within a one-month timeframe.
We selected five events that represent significant market shifts and analyzed how validators responded under varying market landscapes.
Methodology
In this section, we employ an event study methodology to analyze staking behavior around five significant market events. Our approach is as follows:
- Event Selection: We identify key dates corresponding to major protocol upgrades, market shocks, and structural changes.
- Market Trend Analysis: To contextualize validator actions, we define three market trend indices based on the moving averages (MA) of the ETH price: short-term (MA30 - MA10), medium-term (MA100 - MA30), and long-term (MA200 - MA100)
- Behavioral Analysis: We examine staking deposits, withdrawals, and exit queue data for different validator categories (e.g., CEXs, LSTs) in the 60-day window before and after each event.
By combining these analyses, we can draw qualitative conclusions about how different validator groups respond to market shifts, distinguishing between reactions to short-term volatility and strategic repositioning based on long-term sentiment.
The Shanghai Upgrade on 2023-04-12
The Shanghai upgrade, launched on April 12, 2023, enabled ETH stakers to withdraw their funds for the first time since the Beacon Chain’s inception. This upgrade is pivotal for analyzing validator decentralization and behavior due to several factors:
- Staking Liquidity: With withdrawals now possible, we can assess how validator behavior shifts, revealing insights into decentralization and staking strategies.
- Market Sentiment: Observing validators’ reactions to market events post-Shanghai offers clues about network stability and their confidence in Ethereum.
- Validator Distribution: The new flexibility may attract different participants in different ways, reshaping the validator landscape and potentially affecting decentralization.

The bar plot below shows the new ETH deposits 60 days before and after the Shanghai upgrade, categorized by color to represent different types of entities, including CEXs (centralized exchanges) and LSTs (liquid staking tokens). Interestingly, the data reveals that both CEX and LST users actually increased their staking volume post-upgrade.
At the same time, the long-term bull-bear metric showed a gradual shift from bearish to bullish. A positive value for this index indicates a long-term bullish trend, while a negative value signals a bearish environment; the magnitude of the value corresponds to the trend’s strength. This metric peaked right around the Shanghai upgrade before stabilizing, highlighting a growing positive sentiment in the months leading up to the event.

The two charts above depict the withdrawal and exit queue data. Due to the churn rate, the exit queue typically leads withdrawals by 3-7 days, a lag that’s also visible in these plots.
Notably, CEX users exhibited higher withdrawal activity compared to other categories. However, this spike was concentrated primarily in the first week following the Shanghai upgrade, after which the withdrawal activity gradually tapered off. This suggests that while CEX users were quick to act, the initial surge didn’t translate into a sustained exit trend, highlighting the transient nature of the initial reactions.
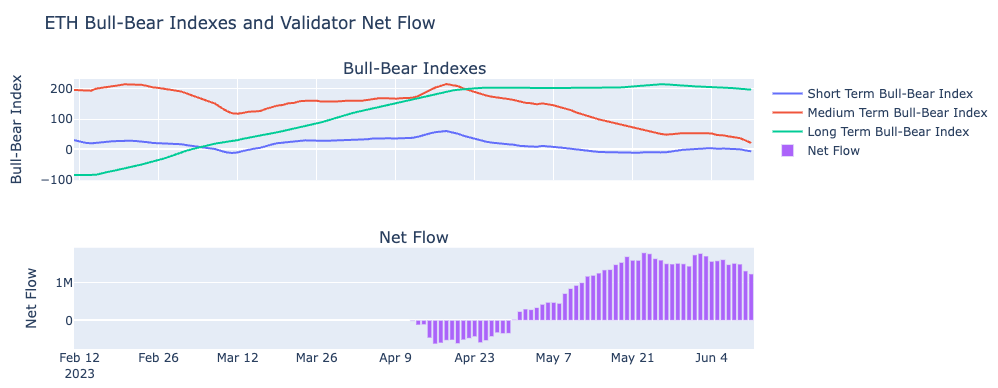
When observing the total daily net flow, it’s clear that withdrawals initially caused a negative net flow right after activation. However, this quickly reversed as deposits surged, turning the net flow positive. This shift reflects the optimistic sentiment among ETH holders and stakers, who responded positively to the market environment and the successful rollout of the upgrade, reinforcing confidence in the ecosystem.
The FTX Collapse on 2022-11-08
The FTX collapse on November 8, 2022, was one of the most shocking events in crypto history, resulting in a rapid unraveling of one of the industry’s largest exchanges. The sudden downfall caused widespread panic, leading to sharp declines in crypto asset prices and a significant loss of trust in centralized entities.
We selected this event for our analysis because of its profound impact on market sentiment and behavior, particularly among Ethereum validators. By examining how validator staking and withdrawal patterns reacted during this crisis, we can gain insights into how major market shocks influence staking decentralization and the confidence levels of different participant groups.
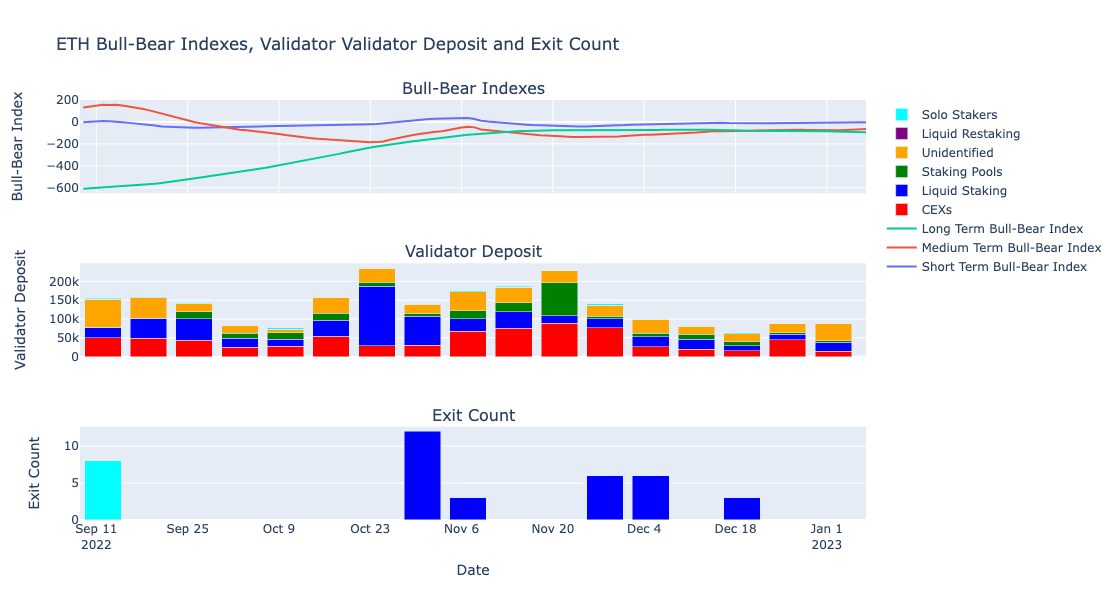
The bar plot above shows new deposits and withdrawals 60 days before and after the FTX collapse. Interestingly, we don’t observe clear market sentiment patterns, even when breaking it down by category. However, our bull-bear metrics indicate that market sentiment was neutral during this period. This suggests that the absence of distinct trends could be due to the fact that the FTX event did not lead to major price swings, resulting in relatively stable validator behavior.
The Three Arrows Capital Bankruptcy on 2022-06-27
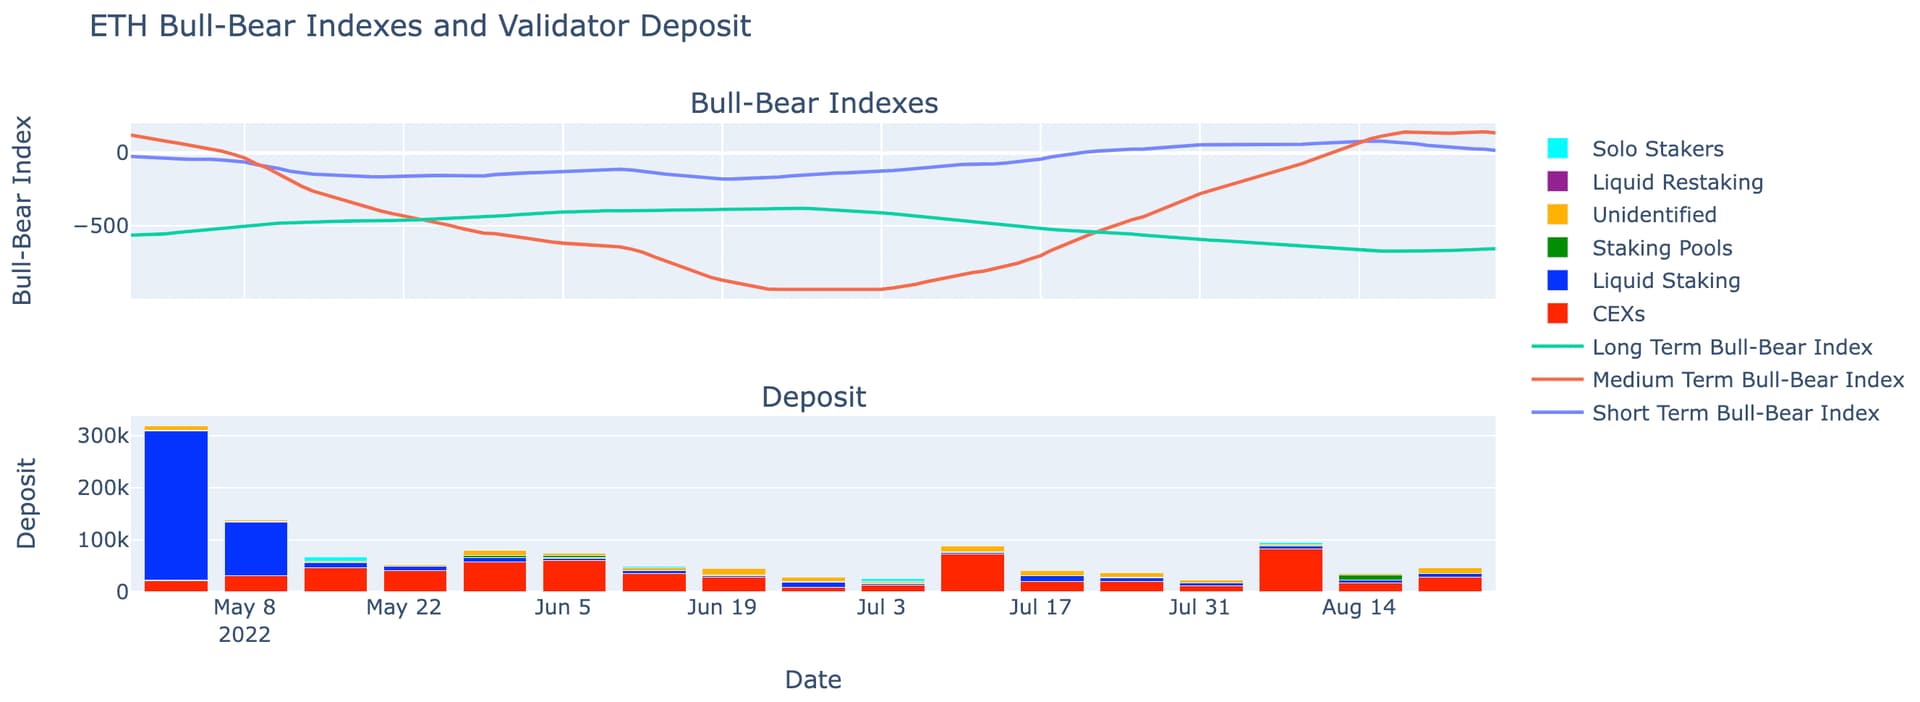
The bankruptcy of Three Arrows Capital (3AC) on June 27, 2022, marked a major crisis in the crypto space, leading to widespread liquidations. However, since withdrawals hadn’t started at that time, our analysis focuses solely on new deposits. Interestingly, CEX users dominated these deposits, yet their behavior didn’t show significant changes in response to the event, highlighting a more resilient stance despite the broader market turmoil.
BTC ETF Annoucement on 2024-01-10
On January 10, 2024, the announcement of a Bitcoin ETF approval created a buzz across the crypto space, marking a significant step for BTC’s mainstream adoption. Such an event is pivotal, as it could potentially trigger a liquidity shift within the crypto market, with capital moving from other assets like ETH into BTC.
We selected this event to analyze whether ETH staking behaviors reflect this shift. Specifically, we’re interested in whether Ethereum validators reduced their staked positions, potentially reallocating funds toward Bitcoin in response to the ETF approval. Understanding these dynamics helps us gauge how such market events could impact ETH staking liquidity and validator strategies.
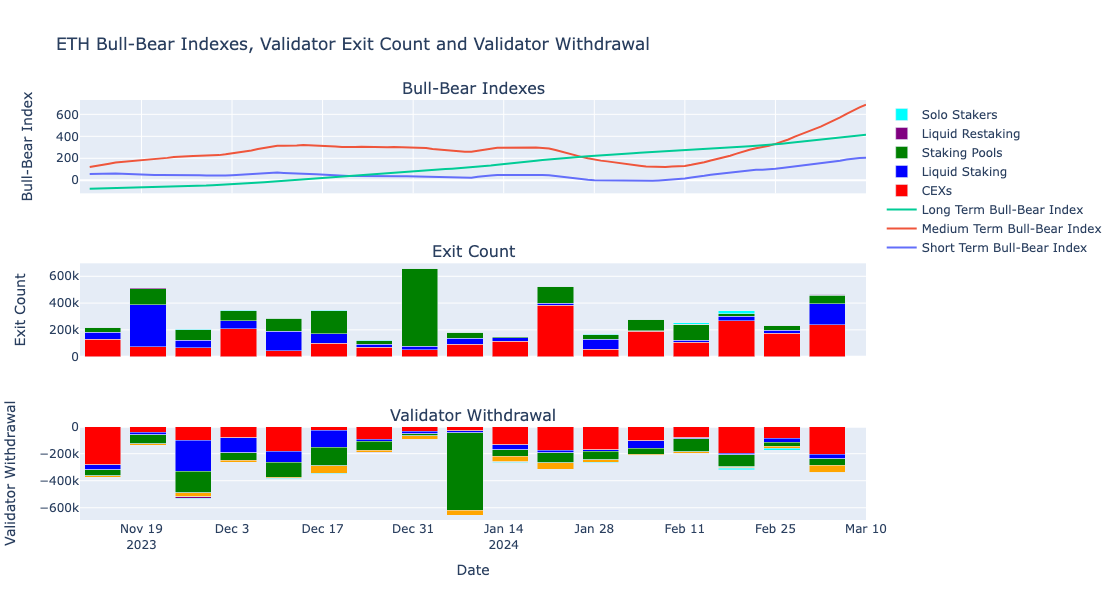
Through the withdrawal and exit queue bar plots, our hypothesis was confirmed, particularly with the noticeable surge in staking pool activity. Interestingly, users from staking pools began entering the exit queue a full week before the BTC ETF announcement. This early exit behavior suggests some market participants may have anticipated the ETF approval, preparing in advance to reallocate their liquidity into BTC.
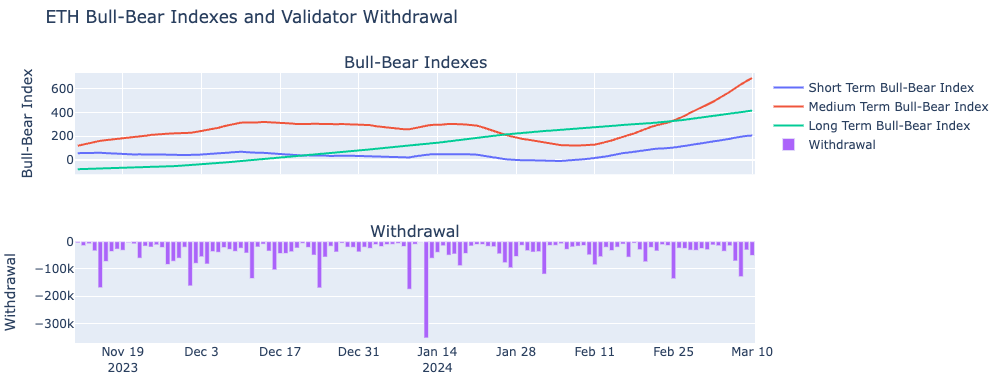
Upon closer inspection of daily withdrawals, we observe a significant surge on the day of the BTC ETF announcement, hitting historically high levels. This further confirms that the BTC ETF attracted considerable ETH liquidity, even from stakers who typically have low turnover. However, considering the timing of the exit queue, we have reason to suspect that some staking pool users might have had prior knowledge of the announcement and chose to unstake in advance to capitalize on the upcoming opportunity.
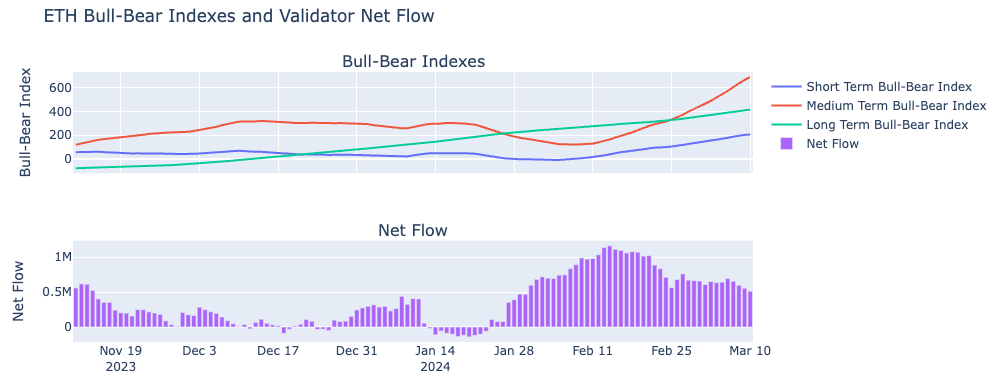
Although there was an initial spike in withdrawals following the BTC ETF announcement, a quick shift in net flow to positive numbers suggests that the ETF ultimately brought mid-term bullish sentiment to the market. This indicates that while some liquidity initially flowed out, the broader market viewed the ETF as favorable, leading to renewed deposits and overall confidence in Ethereum’s ecosystem.
Summary so far
The even studies above suggest that short term market fluctuations are not fundamentally correlated with staking behavior. In this context, we delineate between two types of events. Short-term events, such as the FTX collapse or the 3AC bankruptcy, are treated as sudden, unexpected market shocks that primarily impact immediate sentiment and trust without altering the fundamental mechanics of Ethereum itself. In contrast, long-term or structural events are those that fundamentally alter the protocol’s mechanics or its position in the broader financial market. The Shanghai Upgrade, which enabled withdrawals for the first time, and the Bitcoin ETF approval, which signaled a new level of mainstream crypto adoption, fall into this category. Our analysis indicates that these structural events appear to have a more lasting and significant effect on staking behavior.
Correlations with short term financial parameters
The event studies above focused on teasing out how structural changes can point to root causes of staking behavior. In this section we will briefly turn to analyzing how short-term factors might also influence staking.
Evidently, the possibility which parameters to consider is almost infinite. We will present a select few. As foreshadowed by the market crises event studies, there is little systematic correlation in parameters. The ones we depict here are representative of broader analyses we ran.
Revenue
First, we will focus on internal short term measurements of validator revenue and staking behavior. The revenue metrics include priority fee revenue APY, inflation APY, burn rate APY, and the inflation rate.
Understanding these factors is crucial because they can directly influence a validator’s decision to stake or withdraw. By analyzing how changes in revenue impact staking activity, we gain insights into the economic incentives driving validators. For example, higher APYs or favorable burn rates might encourage more staking, while increased inflation rates could lead to reduced staking as validators seek better returns elsewhere. This analysis helps us better understand the motivations behind validator behavior in different market conditions.
Beginning with the question of how we define APY and which measurement should influence staking behavior, it is not obvious what the best strategy for investigating this relationship is. In addition, as the next picture illustrates, daily APY measurements vary significantly over time - much more wildly compared to staking inflow or outflow.
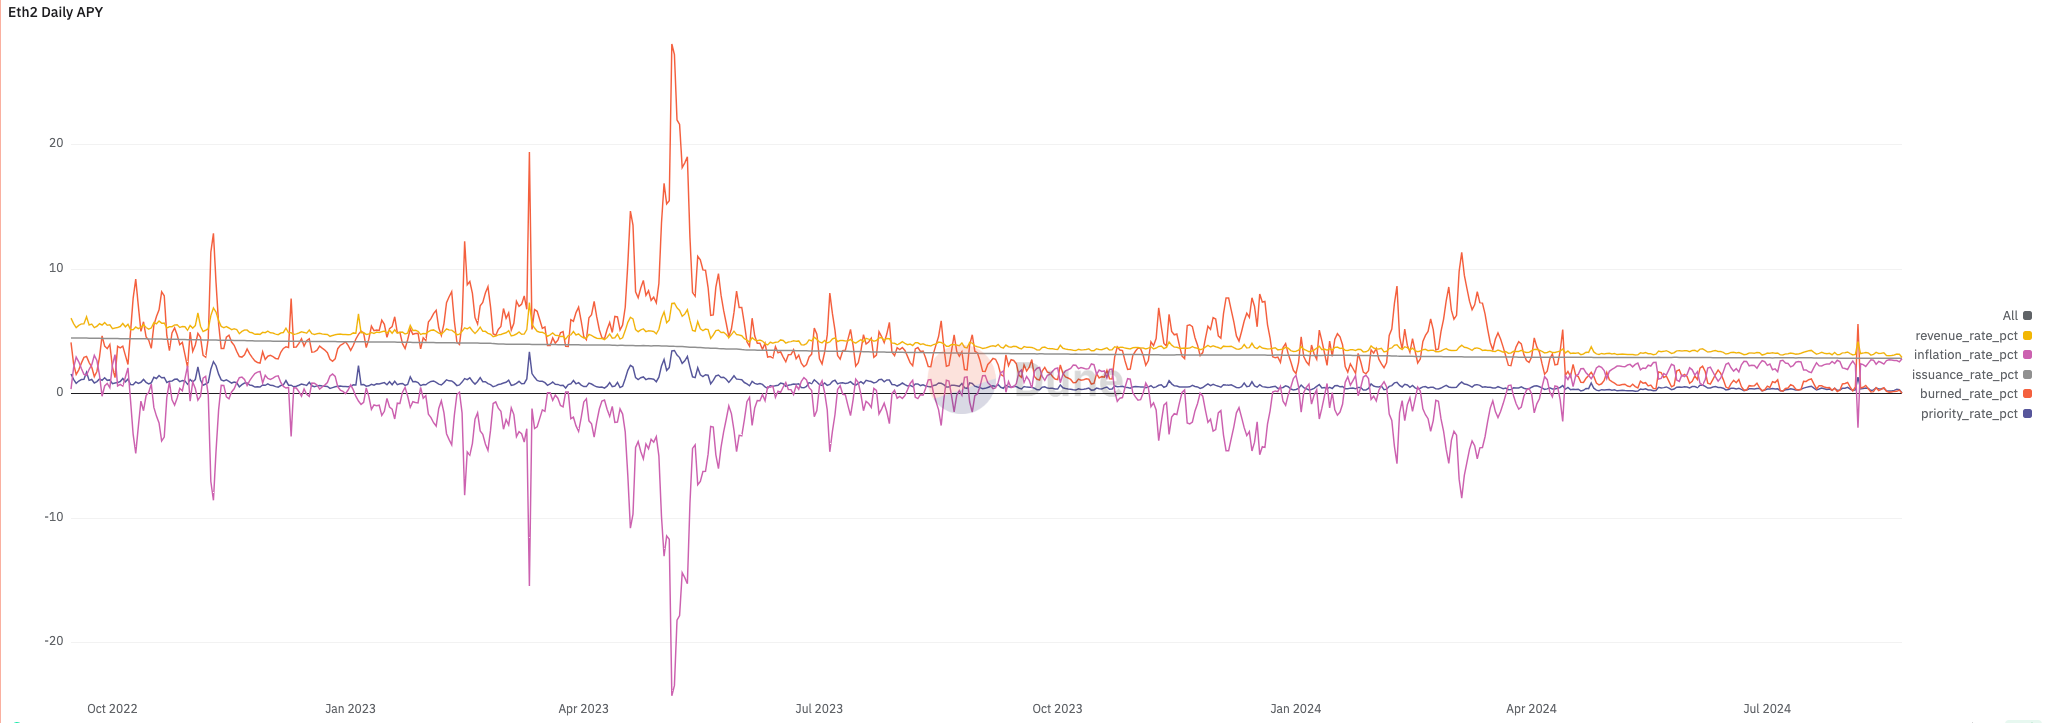
We tested a whole battery of relatively standard time series models - none of it produced any interesting relationships. To reiterate, this does not preclude a causal relationship and a more detailed analysis with different data and a better identification strategy might unearth it. But at least in the most straight-forward ways, no correlation appears. Overall, the tentative conclusion is that other factors, beyond just revenue metrics, play a significant role in influencing validator decisions.
Other factors
As a control measure, we also explored the relationship between staking flow and various US stock indices to determine if there were any correlations. The obvious story behind being that inflow into crypto and then staking could be part of a general investment rationale encompassing other asset classes. However, our analysis did not reveal any true positive causal relationships between these variables. This indicates that staking flow appears to be driven more by crypto-specific factors rather than being directly influenced by broader equity market movements. Again, this might warrant its own more detailed analysis - possibly focusing on more long term sentiments in the market. But this is beyond the scope of this report.[1]
Centralization Analysis
This section provides a descriptive analysis of Ethereum validator centralization by computing the Herfindahl-Hirschman Index (HHI) over time. It is important to note that this analysis is purely empirical and does not use the agent-based model presented earlier. The goal is not to model the causal process of centralization, but rather to quantify the concentration of staking power across different economic entities. This analysis provides an empirical snapshot of the network’s evolution and offers crucial context for the agent composition and starting conditions used in our simulation model.
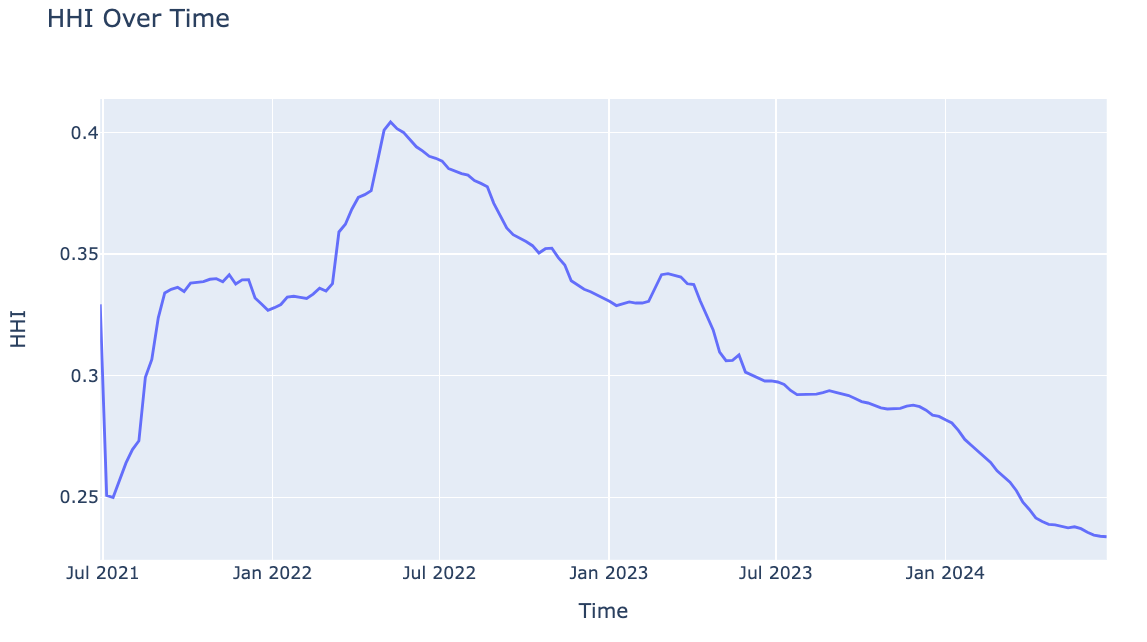
The chart above categorizes centralization based on different staking entities. We observe that centralization peaked in May 2022, coinciding with the 3AC event. However, following this spike, decentralization trends gradually strengthened, indicating a shift towards a more distributed validator landscape over time.
Within Category
The charts focus on centralization within each staking category, calculated using the Herfindahl-Hirschman Index (HHI). This index is computed by squaring the market share of each staking entity within a given category and then summing the results. A higher HHI indicates greater centralization. Notably, there were dramatic shifts in the HHI immediately after the Shanghai upgrade, especially for CEXs and solo stakers.. However, these trends quickly stabilized, reaching a more balanced and steady state as the market adjusted to the new dynamics post-upgrade. This indicates that while the upgrade triggered short-term movements, the long-term impact on staking centralization led to some equilibrium across categories.
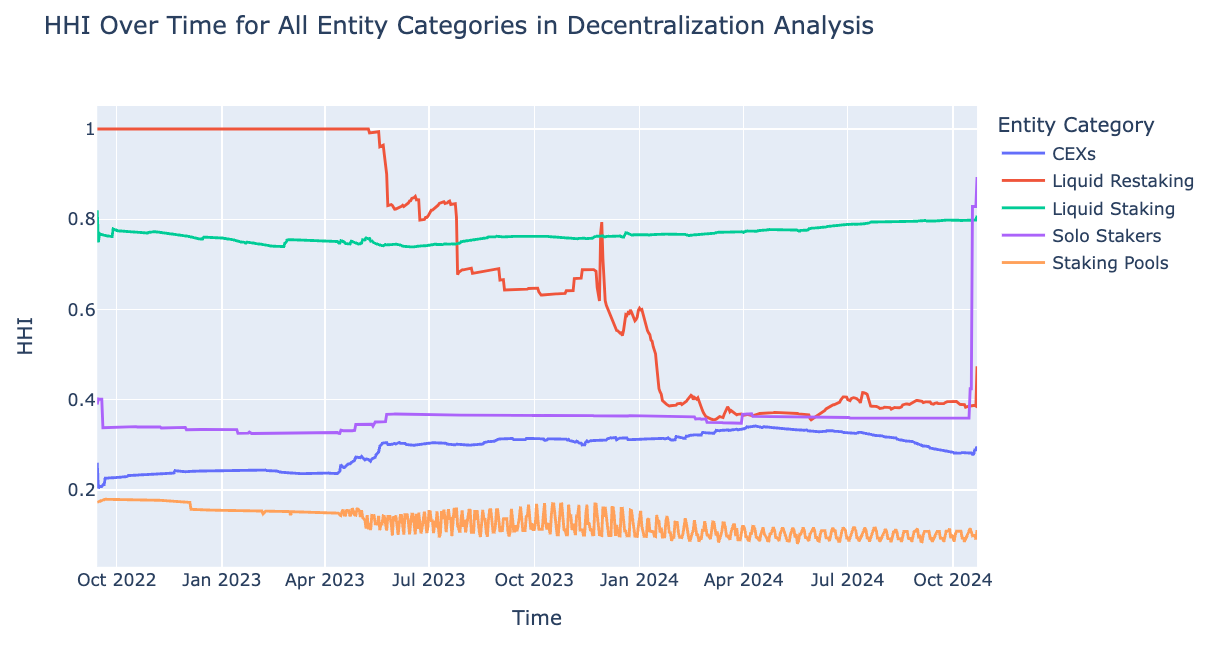
Liquid staking has a stable and consistently increasing high HHI, indicating strong centralization within this category. This suggests that only a few entities (lido) dominate liquid staking activities.
Liquid Restaking began decentralizing in mid-2023 and stabilized by mid-2024, showing a higher level of decentralization than liquid staking. Staking Pools, while the most decentralized, have shown high volatility, especially after the Shanghai upgrade.
Solo Stakers are the most centralized category by Oct 2024, with a significant peak recently.
By Entity
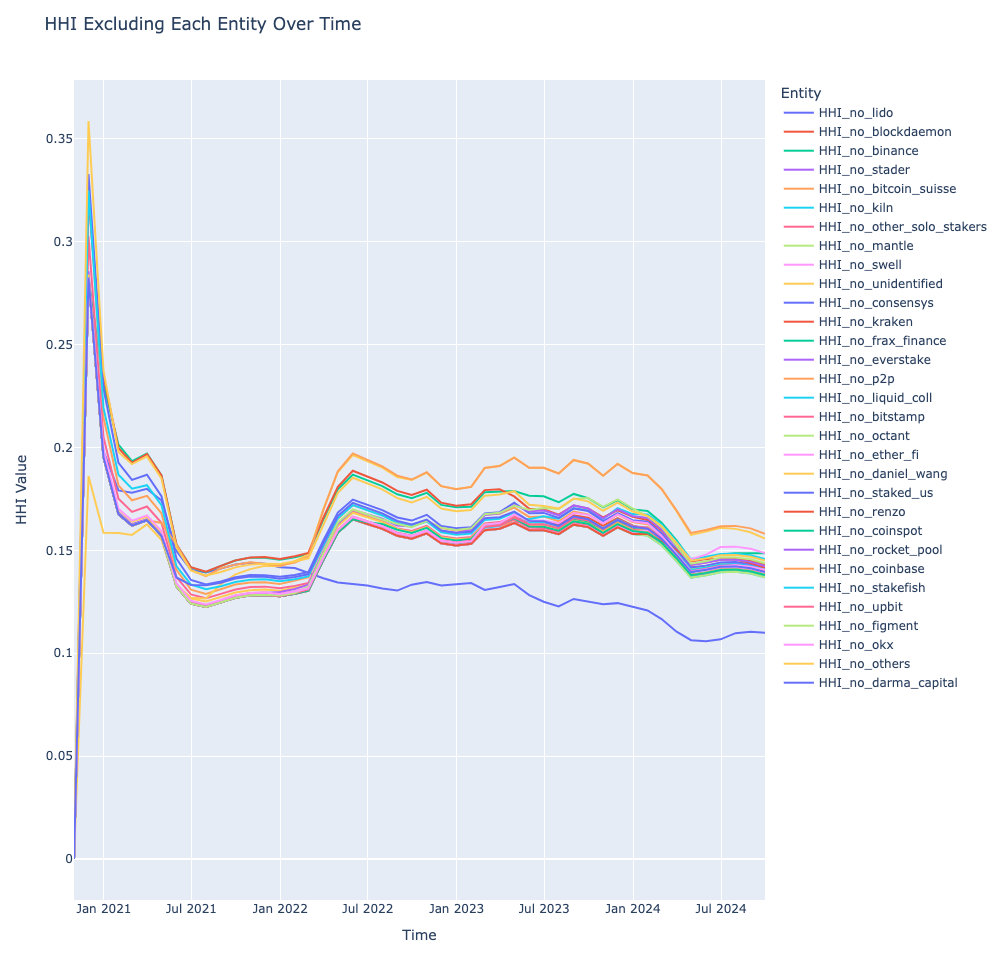
Our analysis as above figure showed that excluding individual entities resulted in only minor differences in HHI across most of them, indicating that most entities have a similar level of influence on staking decentralization. However, when Lido was excluded, staking became significantly more decentralized. This makes sense, as Lido holds 27.9% of the total staking, ranking first.
According to this dashboard, when curated nodes and DVT nodes are considered, Lido has increased its internal decentralization. Despite its large market share, Lido has taken steps to further decentralize internally.
Impact from DVT
Next, we investigated the entities participating in the SSV network to determine if using DVT (Distributed Validator Technology) could increase decentralization. It’s important to note that we do not have operator node data, so in this analysis, the HHI calculation was not based on operator nodes. Instead, we simply categorized nodes as either SSV or non-SSV. The values in the chart below represent the extent to which decentralization increased, measured by how much the HHI value decreased.
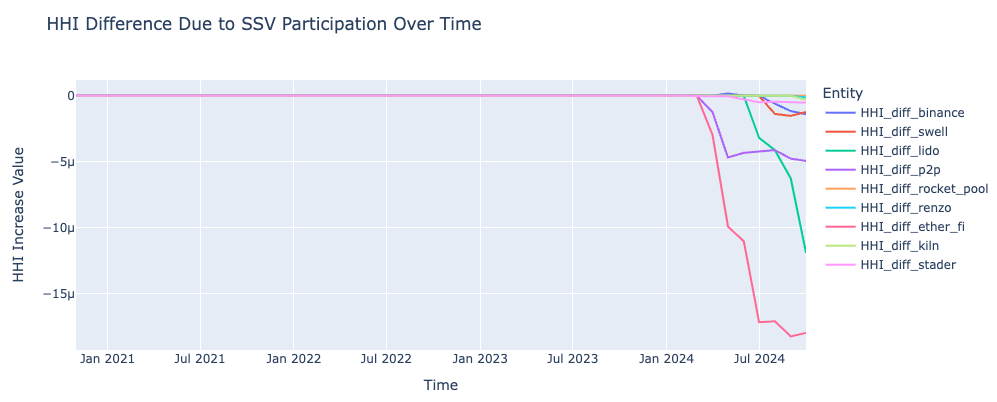
From the chart, we can see that either.fi showed the most significant increase in decentralization by leveraging SSV, followed by Lido, which also shows a growing trend. P2P.org comes next in terms of decentralization improvement.
Due to limited data, the number of entities we can show is constrained. However, this result clearly demonstrates that DVT plays a significant role in promoting decentralization. Even with the available data, it’s evident that entities utilizing DVT experience noticeable improvements in decentralization.
Takeaways and Future Research
Key Takeaways
This report analyzed staking behavior through a combination of agent-based simulation and empirical analysis. Our key findings reveal the complex dynamics of the economic and structural drivers within the Ethereum ecosystem:
- Issuance Policy is Not a Silver Bullet: Our simulations suggest that altering the issuance policy alone is unlikely to be a sufficient tool for promoting decentralization or significantly shifting the staking distribution toward smaller stakeholders. The underlying economic incentives and market structure appear to be more dominant factors. This is consistent with an earlier dynamics-based analysis by 20squares.
- Staker Behavior is Driven by Structural Events: The event-based analysis demonstrates that staking decisions are more significantly influenced by long-term, structural protocol changes (e.g., the Shanghai Upgrade) and fundamental market shifts (e.g., the BTC ETF approval) than by short-term price shocks or volatility (e.g., the FTX collapse). This indicates that stakers generally operate with a long-term perspective.
- Price Volatility Primarily Impacts Revenue via Costs: For entities that bear direct infrastructure costs, like solo stakers and staking pools, ETH price volatility has a more pronounced impact on their revenue APY through fluctuating operational expenses than through changes in the amount of ETH being staked.
Future Research Directions
Our analysis opens several avenues for future work that could build upon these findings and address the limitations of this study:
- Refine Agent Models with Better Data: The current model relies on simplifying assumptions for agent utility, revenue and reinvestment rate. Future work could develop more granular models by incorporating better data on operational costs, unobservable factors like individual price expectations, and more complex opportunity cost calculations to create a more precise simulation of staker decision-making.
- Conduct Deeper Causal Analysis: While our analysis found little correlation between short-term financial parameters and staking flows, a more detailed time-series analysis using advanced econometric techniques or alternative datasets might uncover causal relationships that were not apparent here.
- Perform a Granular DVT Impact Study: Our findings indicate that Distributed Validator Technology (DVT) contributes positively to decentralization. A more granular study, using operator-level data from DVT networks, could precisely quantify this impact and model how widespread DVT adoption might reshape the staking landscape and mitigate risks from large staking entities.
- Investigate Long-Term Macroeconomic Links: This report found links to short-term market indices. An interesting avenue for research would be to investigate the relationship between staking flows and broader, long-term macroeconomic sentiment, combining it with our previous analysis, and exploring whether ETH staking behaves as a “risk-on” or “risk-off” asset within the wider financial ecosystem.
Among other things, we also briefly investigated inflation rates and possible flights into alternative assets classes including crypto-assets. The idea being that this inflow can also affect staking. This also faces several challenges, the most obvious one being that official inflation statistics are measured on very different time-scales than the staking data observations we have. ↩︎