Liveness Analysis of the Beacon Chain
This work was done in close collaboration with @leobago from MigaLabs.
TL;DR
- We study the liveness of the Beacon chain, from Genesis to today, through head attestation correctness scores and missed slots.
- We select relevant markers and do a time-discretization analysis to isolate events.
- We identify 33 periods in which liveness falls to dangerous conditions.
- We categorize those events in four types according to their form and structure.
Introduction
Continuing our reliability analysis of the Beacon chain, this second article in our two-part series focuses on the key property that ensures positive outcomes: liveness. As mentioned in the first article, the Ethereum proof-of-stake (PoS) relies on source, target and head attestations. While source and target attestations are essential for ensuring block finalization and maintaining safety, head attestations are crucial for determining the direction of the chain. They enable validators to agree on which block should be extended further. Simply put, when more than 50% of head attestations align on the same block, validators reach consensus on the latest block for the network to build upon, ensuring that a ‘good thing’ happens and the chain continues to live. However, ensuring the direction of the chain is not the only factor to consider when analyzing liveness. The primary goal of the chain is to propose blocks every 12 seconds. Therefore, it’s crucial to examine missed slots—instances where a block was expected but not proposed—as an indication of failure in the block production process (in other words, when something ‘good’ has not happened).
To maintain coherence with the safety analysis we will follow the same methodology. We will start examining over 340,000 epochs from the Genesis of the Beacon chain to February 8th, 2025. Next, we will perform a time-discrete analysis using 112-epoch intervals (half-day periods). Finally, we will use this time frame and the relevant metrics found in order to identify liveness-critical periods and categorize them. This analysis was made possible by GotEth, a tool developed by MigaLabs, which enabled us to collect all the necessary data.
Liveness Analysis
First, we have to check how the head correctness percentages changed during the whole existence of the Beacon chain. In the figure below, we display the head correctness percentage (in orange) for each epoch. The y-axis represents the percentage of validators who attested correctly and on time, while the x-axis represents time. The background is color-coded to highlight different hard forks.

In this figure, we observe a really stable Beacon chain since 99% of epochs have head correctness percentages that exceed 88%. Some variations between 80% and 60% occurred regularly; however, with the Deneb era, these variations have become less frequent and less severe, as correctness values remain above 70% most of the time. Overall, there is only one instance at the beginning of the Capella era where correctness dropped below 60% on several occasions, and a particularly notable moment in May 2023, when correctness fell below 50%, causing a liveness issue. Analyzing the 30-day average, we can observe that the correctness average is usually above 80%, except for a few moments at the end of Phase 0, one in May 2023, and one at the end of the Bellatrix era. It appears that the transition between hard forks is the primary explanation for dips in head correctness.
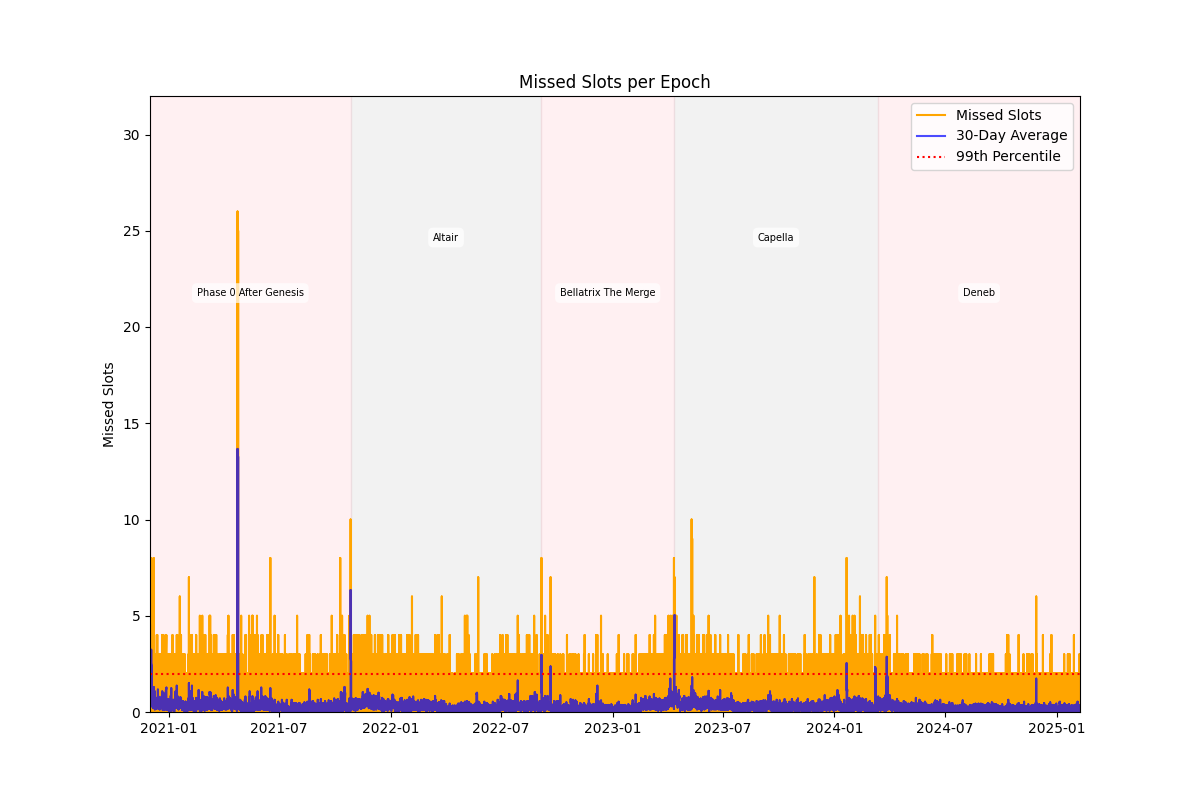
The analysis of missed slots indicates that 99% of epochs had two or fewer missed slots, while the remaining 1% had four to ten missed slots—with the exception of a single event in mid-Phase 0, where 26 slots were missed out of the 32 slots in the epoch. Looking at the 30-day average, we see that the number of missed slots is normally less than two, with the exception of a spike in mid-Phase 0 and during some hard fork transitions.
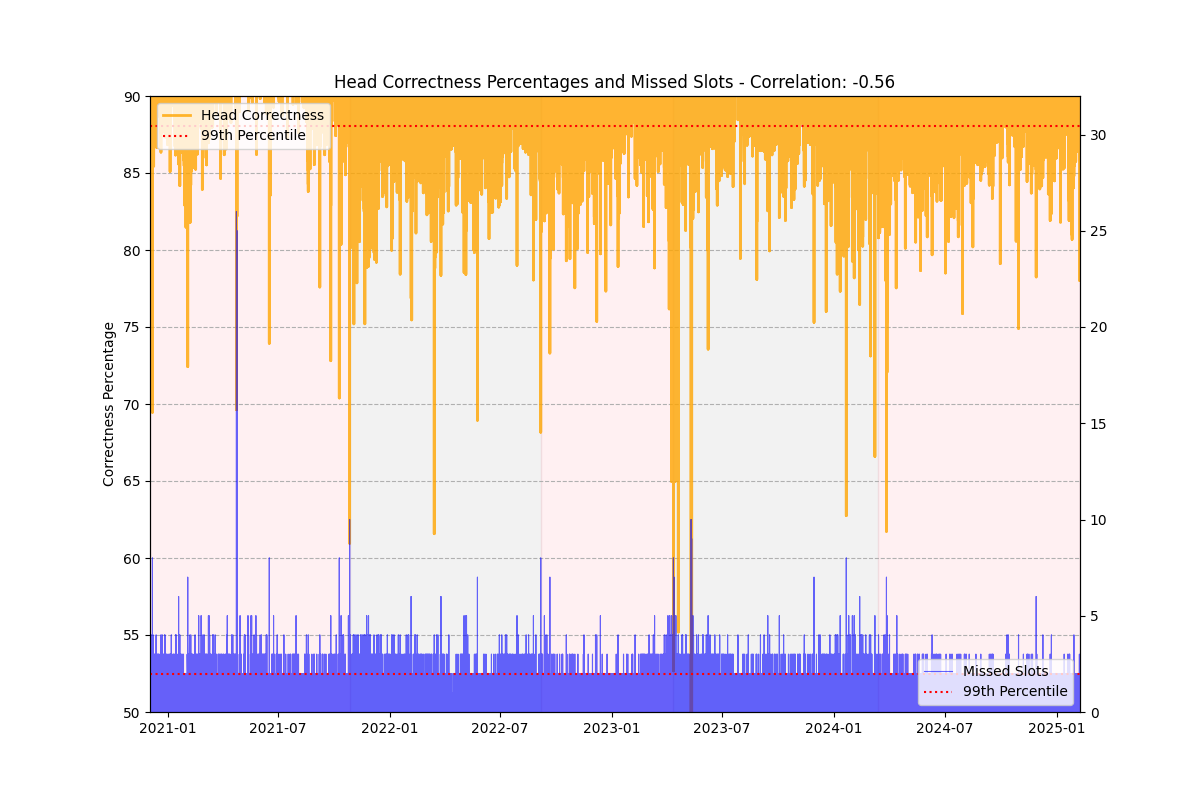
In order to compare head correctness and missed slots, we created the figure below where we can see head correctness percentages (in orange) and missed slots (in blue). In this figure we observe a clear association between drops in head correctness and spikes in missing slots. While missing slots occur seldom, they grow more often when head correctness falls. A significant negative correlation of -0.56 indicates that as correctness drops, the amount of missed slots increases. However, the intensity of this link changes every time it happens. For example, in mid-Phase 0, the greatest increase in missing slots is accompanied by a steep reduction in head correctness below 70%. In contrast, in mid-Altair, we have a significant drop in head correctness—nearly 60%—with only three missed slots, despite being in the 99th percentile. This suggests that while the two metrics are linked, anomalies exist where epochs maintain high head correctness despite a concerning number of missed slots, and vice versa.
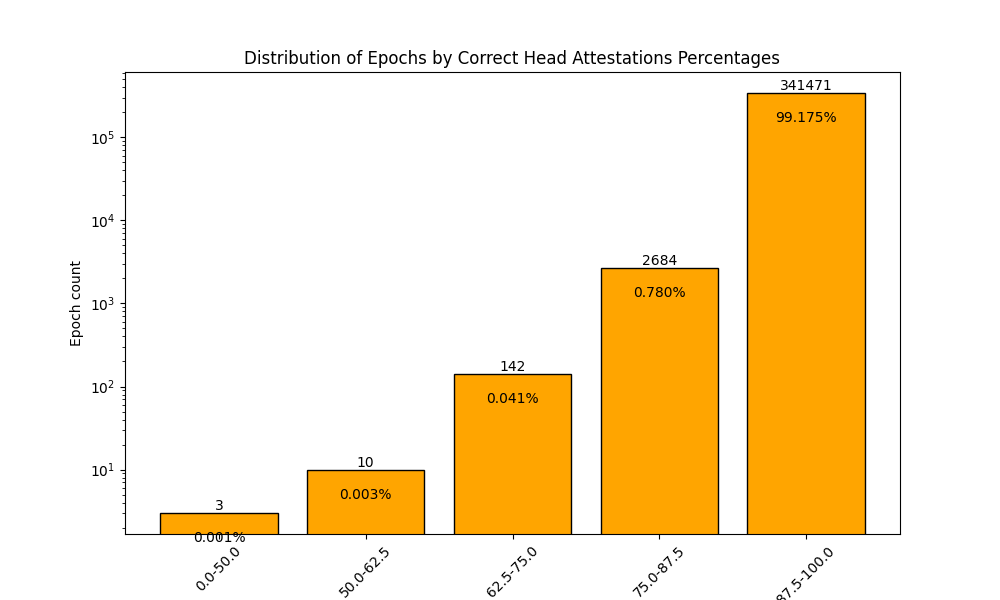
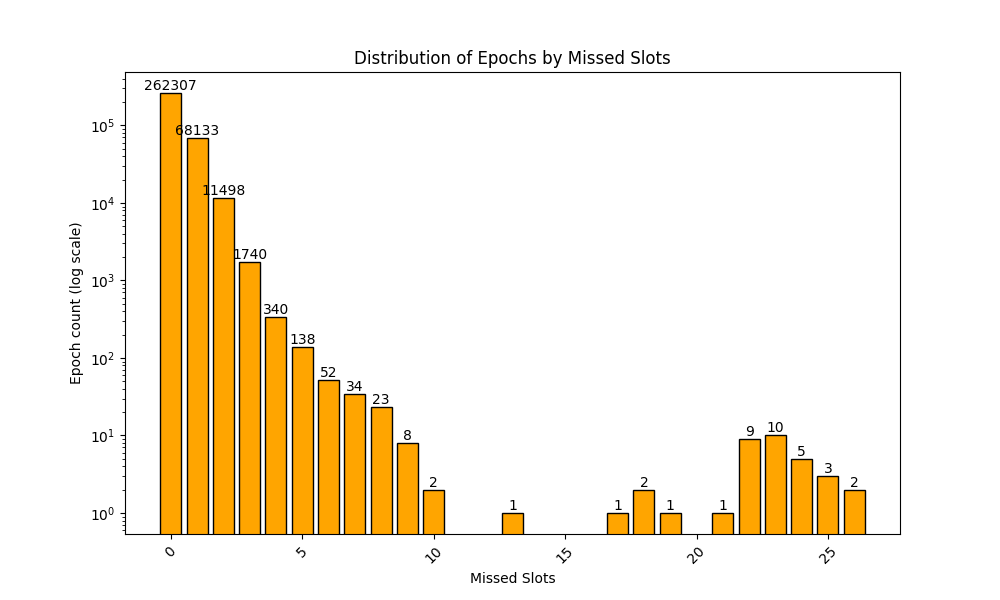
Overall, it is possible to affirm that the Beacon chain is very stable with continuously high head correctness percentages. Although there are regular dips in correctness, the figure below indicates that more than 99% of epochs maintain correctness above 87.5%, suggesting that anomalies tend to be short-lived. However, the same does not hold true for missing slots. Ideally, a proposed slot indicates that the process is functioning correctly, making fewer missed slots preferable. Yet, missed slots are common, occurring in 82,003 out of 344,310 epochs (23.82%). This is largely because block proposals rely entirely on the assigned proposer’s performance, whereas head attestations depend on the collective participation of multiple validators.
In order to capture both isolated critical epochs and prolonged liveness issues, we grouped epochs into half-day periods, or 112-epochs intervals, mirroring the approach used in the safety analysis
Time-discrete Analysis
After an analysis of several metrics, we decided to focus on three metrics for head attestations: i) the average correctness percentage for each 112-epochs period, ii) the minimum head correctness percentage recorded within each period, and iii) the Coefficient of Variation (CV). For missed slots, we used: i) the total number of missed slots for each half-day period, ii) the maximum missed slots per one epoch recorded within each period and iii) the missed slots CV.
The figure below presents three half-day head metrics: the average (orange), the minimum (violet), and the CV (green line following the inverted right-hand y-axis). Each dot represents a half-day period, while the red line marks the 99th percentile of the average values. The data reveals a strong overall performance, with average values typically exceeding 90% and often surpassing 95%, though occasional dips are observed during hard fork transitions. Minimum head correctness values, however, show significant fluctuations across the dataset. While most minimum values range between 95% and 80%, we frequently observe dips below this range. Notably, when minimum values fall below 80%, the drop is often sharp enough to impact average values, suggesting short-lived anomalies.
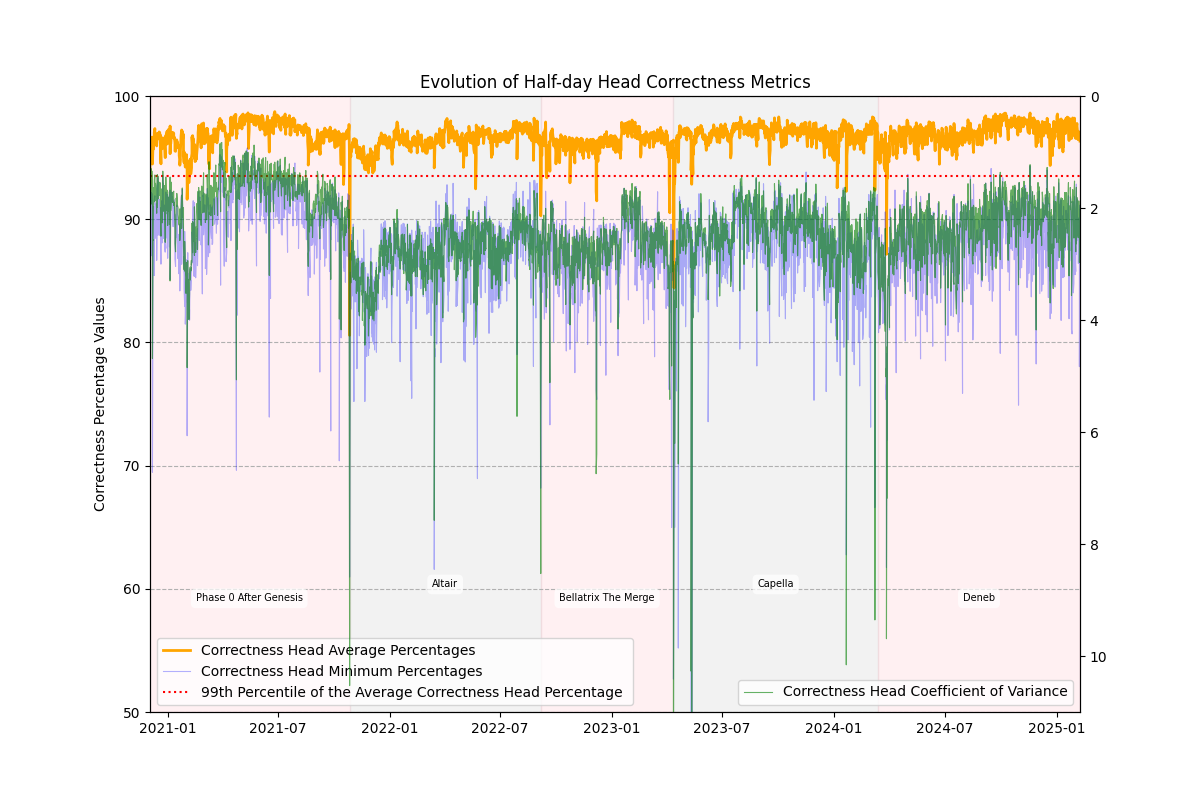
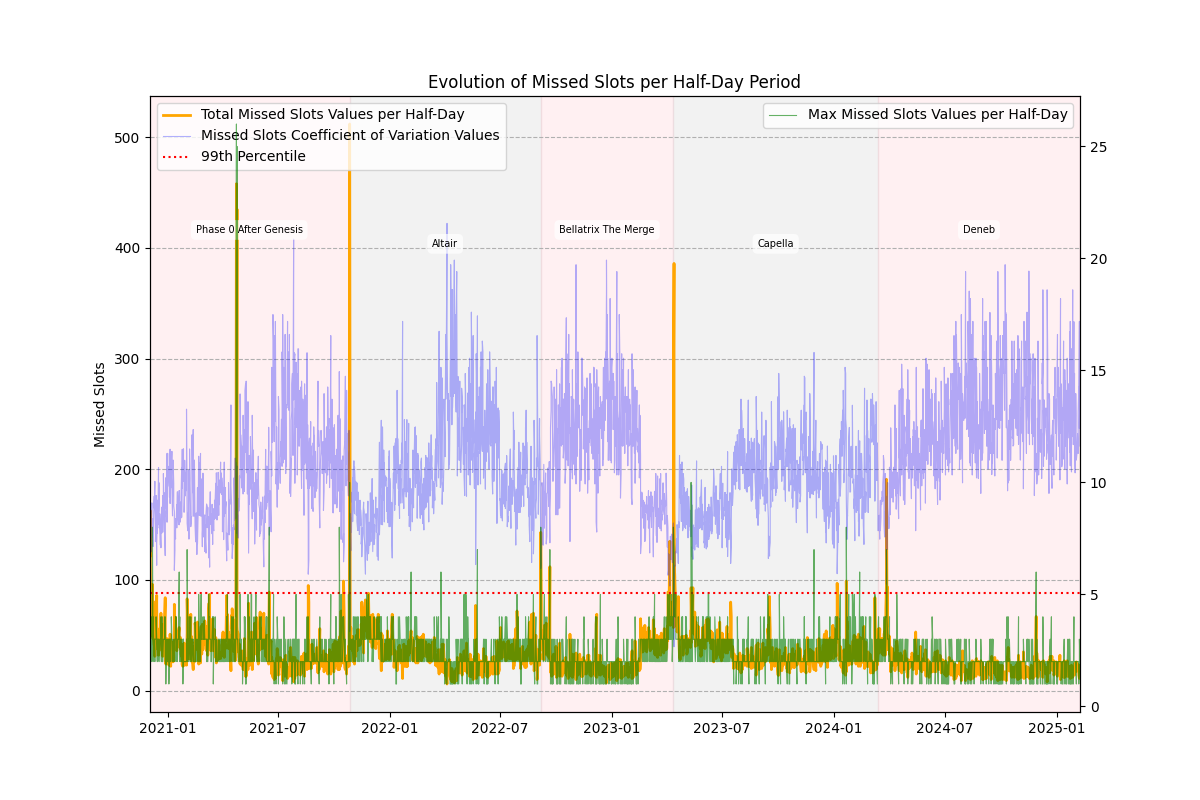
Analyzing missed slot metrics, we observe that the number of missed slots per half-day period is typically below 100. In fact, 99% of periods have 88 or fewer missed slots, averaging 0.76 missed slots per epoch (88 missed slots across 112 epochs). However, several extreme spikes stand out—the most significant occurring in the mid and late Phase 0 era, at the beginning of the Capella era, and, to a lesser extent, during the Deneb era. These spikes often coincide with the highest number of missed slots within a single epoch, indicating that the worst epochs are likely to create critical periods. This pattern suggests that, similar to head correctness, critical periods can experience brief but severe anomalies. That said, not all cases follow this trend. For example, at the beginning of the Capella era, the maximum number of missed slots in a single epoch exceeded seven, while the total missed slots reached nearly 400—the third-highest spike observed. This implies a more prolonged yet relatively mild disturbance rather than a sharp anomaly. When examining the missed slots CV (right-hand y-axis), we see fluctuations between 5% and 20%. However, these variations show little correlation with either the total or maximum number of missed slots, making missed slots CV an unreliable tool for liveness analysis
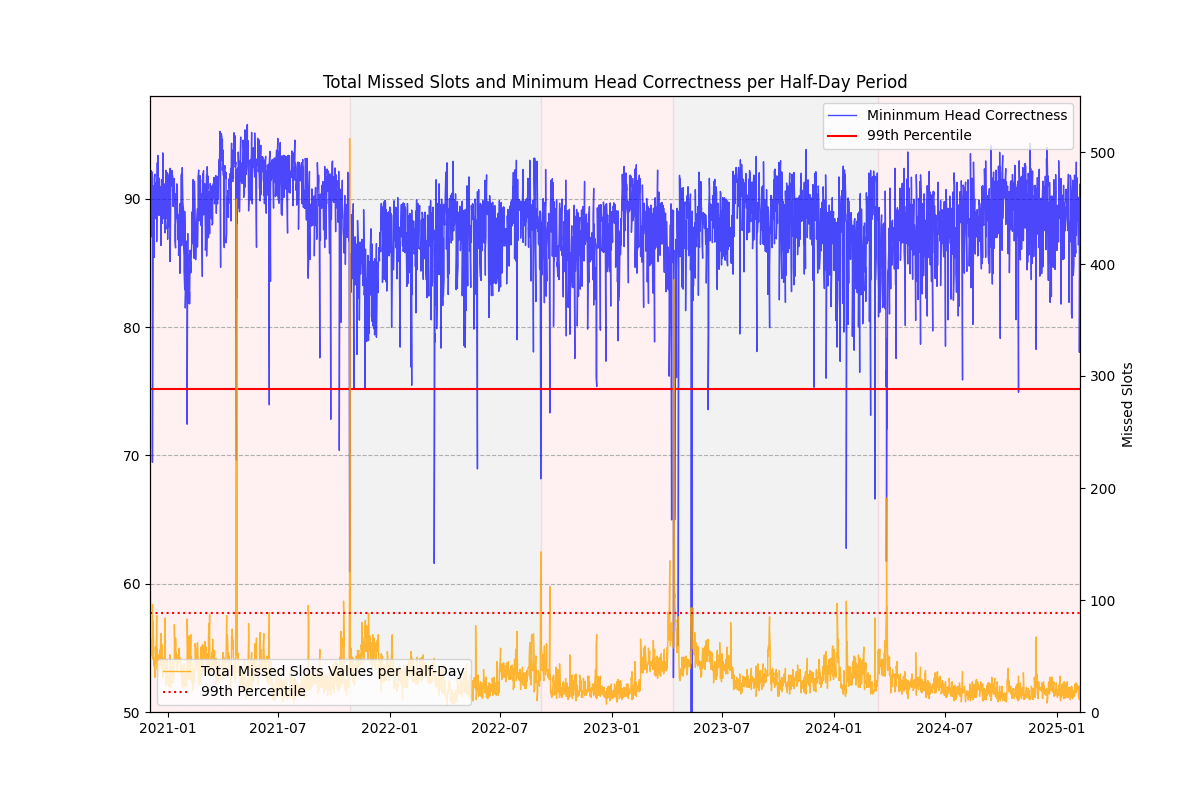
To better understand the relationship between head correctness and missed slots, we compared multiple metrics for both. After several evaluations, we selected the most insightful comparison, shown in the figure below. In this visualization, minimum head correctness is represented in blue (left-hand y-axis), while the total number of missed slots per half-day period is shown in orange (right-hand y-axis). The data reveals a strong negative correlation between these two metrics, though their trends do not always align. In simple terms, a half-day period with fewer than 100 missed slots can still exhibit very poor head correctness. For instance, during mid-Altair, the lowest head correctness dropped below 65%, yet the number of missed slots remained under 55.
From these observations, we conclude that minimum head correctness and total missed slots are effective indicators for identifying liveness-critical periods. Additionally, head CV may serve as a useful metric for defining concerning periods. However, as previously noted, missed slots CV will not be included in the analysis, as it does not effectively aid in identifying or classifying problematic periods.
Identifying Liveness Critical Periods
As done in the safety analysis, the liveness analysis is performed on the bottom 1% of half-day periods based on minimum head correctness percentages and on the top 1% of periods based on total missed slots. We came up with 36 liveness-critical periods, but some of them are contiguous. We thus determined that there were a total of 33 distinct liveness critical periods when we grouped together all consecutive periods. This approach results in longer critical periods having a higher total number of missed slots. To this end, we proposed the use of Average Missed Slots (AMS) as a performance metric.

After identifying the liveness-critical periods, we represented each one in a separate plot in the figure above. Each plot displays head correctness per epoch in blue (left-hand y-axis) and missed slots per epoch in orange (right-hand y-axis). Additionally, we included head CV and AMS in the title for further context. To enhance readability, each plot is color-coded based on the four distinct types of liveness-critical periods identified:
Type 1: Moderately Unstable Periods (14 out of 33 periods) - represented by light yellow plots
- These periods have fairly mild minimum head correctness values and the head CV is always below 4.5%, meaning that there is some instability, but not to a great extent that it should be a concern with respect to liveness.
- When focusing on the minimum head correctness values, we see that some of the periods, for example, periods 7, 10 and 18, do not have a significant drop in correctness but rather a chaotic distribution of moderate low correctness values across the period. However, periods 6, 8 and 9 have clear dips though the minimum values are never below 70%.
- Regarding missed slots, most periods do not exhibit significant spikes. However, brief spikes are observed in periods such as 6, 8, 9, and 15. Despite these occasional increases, these periods maintain the lowest AMS values among all the liveness-critical periods.
- In this category, we find two types of liveness-critical periods: moderately unstable periods with scattered, non-consecutive epochs having low correctness values, and more stable periods with a significant dip at one moment, leading to consecutive epochs with relatively low head correctness and, sometimes, increased missed slots.
Type 2: Highly Unstable Periods in terms of Head Correctness (15 out of 33 periods) - - represented by dark yellow plots
- These periods are characterized by high head CV values, with all values exceeding 4.5%.
- Periods in this category often feature one significant dip in head correctness followed by several epochs with low head correctness values, such as in periods 14 and 30. Other periods, like 20, have multiple significant dips.
- There are also more unstable periods, such as periods 11, 16, 21, and 31, where one notable disruption in head correctness leads to a prolonged period of concerning head correctness levels.
- Although there are spikes in missed slots when head correctness drops significantly (e.g., periods 2, 3, 20, and 28), the AMS is generally below 1.5%, except for periods 11 and 21.
Type 3: Highly Unstable Periods in terms of Missed Slots (2 out of 33 periods) - represented by orange plots
- These periods are marked by a significant spike in missed slots, which causes the number of missed slots to rise dramatically, leading to the highest AMS values.
- Example periods include 4 and 5, where the spikes in missed slots are the highest among all liveness-critical periods.
- The head correctness line and head CV in these periods resemble those of Type 1.
- These periods are concerning primarily due to the number of missed slots.
Type 4: Highly Liveness Critical Periods (2 out of 33 periods) - represented by red plots
- This category contains the periods where liveness was most severely affected, to the point where the chain could fail to converge to a single canonical chain, leading to instability.
- Only periods 23 and 24 belong to this category. These periods show multiple dips in head correctness, but mainly one extremely low dip below 50%.
- Missed slots in these periods show a significant spike that overlaps with the dip in head correctness in each figure. However, the AMS remains relatively low, with less than 1 missed slot per epoch.
- While these periods are considered highly unstable due to head correctness issues, they also show concerning AMS values, as they rank in the upper two-thirds of liveness-critical periods.
Conclusions
From this analysis, we can determine that since head correctness percentages are consistently high across all epochs, it is not a good indicator of the worst-performing periods. Minimum head correctness and total missed slots, or AMS due to consecutive liveness-critical periods, are useful metrics for identifying periods with high liveness risk. Concerning CV values we observe two distinct results. Since 99% of epochs have head correctness above 86%, head CV serves as an effective metric for identifying and categorizing liveness-critical periods. However, this is not the case for missed slots, as epochs exhibit significantly more fluctuations. For this reason, AMS was decided to be a much more helpful metric.
Regarding the 112-epoch time frame, we can conclude that it is valuable, as it allows us to identify periods with sharp, short-lived issues and longer anomalies characterized by scattered low head correctness and/or high missed slots. Using the metrics mentioned above and this time frame, we identified 33 liveness-critical periods where the Beacon chain performed poorly. Two main critical periods stand out, as their performances could impact liveness by increasing fork risk and creating network delays.