Safety Analysis of the Beacon Chain
This work was done in close collaboration with @leobago from MigaLabs.
TL;DR
- We study the finality of the Beacon chain, from Genesis to today, through source and target attestation correctness scores.
- We select relevant markers and do a time-discretization analysis to isolate events.
- We identify 33 periods in which safety falls to dangerous conditions.
- We categorize those events in three types according to their form and structure.
Introduction
Since the creation of the Beacon Chain—and especially after its Merge with the Execution Layer —Ethereum’s consensus mechanism, like any distributed system, must remain both secure and functional to operate effectively. To assess its performance, we will focus on two fundamental properties: safety and liveness. In this first article of a two-part series, we will analyze the safety property.
First, we need to understand the notion of ‘safety.’ As described here:
This means we must examine the functioning of the consensus mechanism and identify the key parameters that ensure its robustness.
As a reminder, the Ethereum proof-of-stake (PoS) consensus relies on validators voting for the state of the blockchain through three types of attestations:
- Source Attestations: Validators confirm that they are building on top of the previously justified block.
- Target Attestations: Validators propose a checkpoint that should become the next justified block.
- Head Attestations: Validators agree on the best block to build upon, determining the chain’s direction.
To prevent malicious actions and ensure resilience, the Beacon chain relies on the correctness of attestations. In this context, correctness refers to the percentage of validators performing their duties correctly—submitting votes on time and agreeing on the correct chain state. For safety, the correctness of source and target attestations must exceed 66% (i.e., two-thirds of validators must agree) to finalize blocks, making them irreversible. This means that an attacker would need to control over one-third of the validators to attack the consensus, or over one-third of the validators must experience network or software failures to disrupt block finalization. Since safety is about preventing “bad things” from happening (i.e., ensuring the blockchain remains secure and cannot be altered), we focus on source and target attestations, as they guarantee that blocks are finalized and irreversible. Head attestations, which will be analyzed in the second part of this series (the liveness analysis), are outside the scope of this article.
For this analysis, we will examine over 340,000 epochs from the genesis of the Beacon chain on December 1st, 2020, to February 8th, 2025, using data collected through the GotEth tool, developed by MigaLabs. Next, we will conduct a time-discrete analysis in 112-epoch intervals (equivalent to half-day periods). Finally, using this time frame and the relevant metrics, we will identify safety-critical periods and analyze them.
Finality Analysis
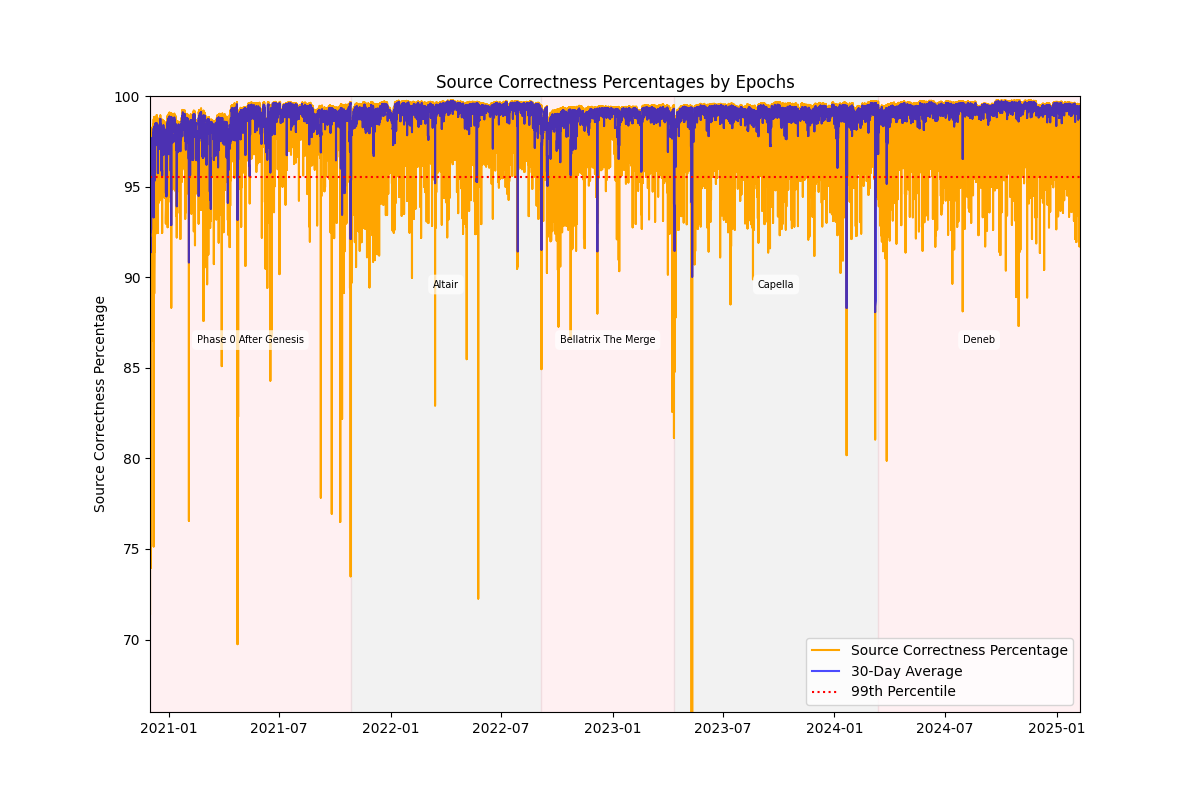
First, we analyze the source correctness percentages throughout the lifetime of the Beacon chain. In the figure below, we plot (in orange) the source correctness percentage for every epoch, that is to say, the percentage of validators (y-axis) that attested to the correct source across time (x-axis). We color the background in two colors to highlight the different hard forks and their transitions. We observe that the Beacon chain is highly stable, with 99% of epochs maintaining source correctness percentages above 95% (dotted red line). There is only one instance where correctness dropped below 66% (May 2023). Looking at the 30-day average (purple curve), we see that correctness remains above 85% and is often above 95%, even when important drops in correctness occur. Additionally, periodic fluctuations between 70% and 90% are observed, with an important amount happening around hard fork transitions. However, the overall trend shows increasing resilience, as episodes of correctness falling below 90% have become less frequent over time.
The analysis of target correctness reveals a pattern similar to the one observed in the previous figure, underscoring the stability of the Beacon chain. Notably, 99% of epochs exhibit target correctness above 94%, with occasional dips ranging from 95% to 70%. A significant decline below 66% occurred in May 2023, mirroring trends seen in source correctness. Despite these fluctuations, the 30-day average consistently remains above 90%, except for two brief episodes towards the end of the Capella era, where it decreased but stayed above 87%.
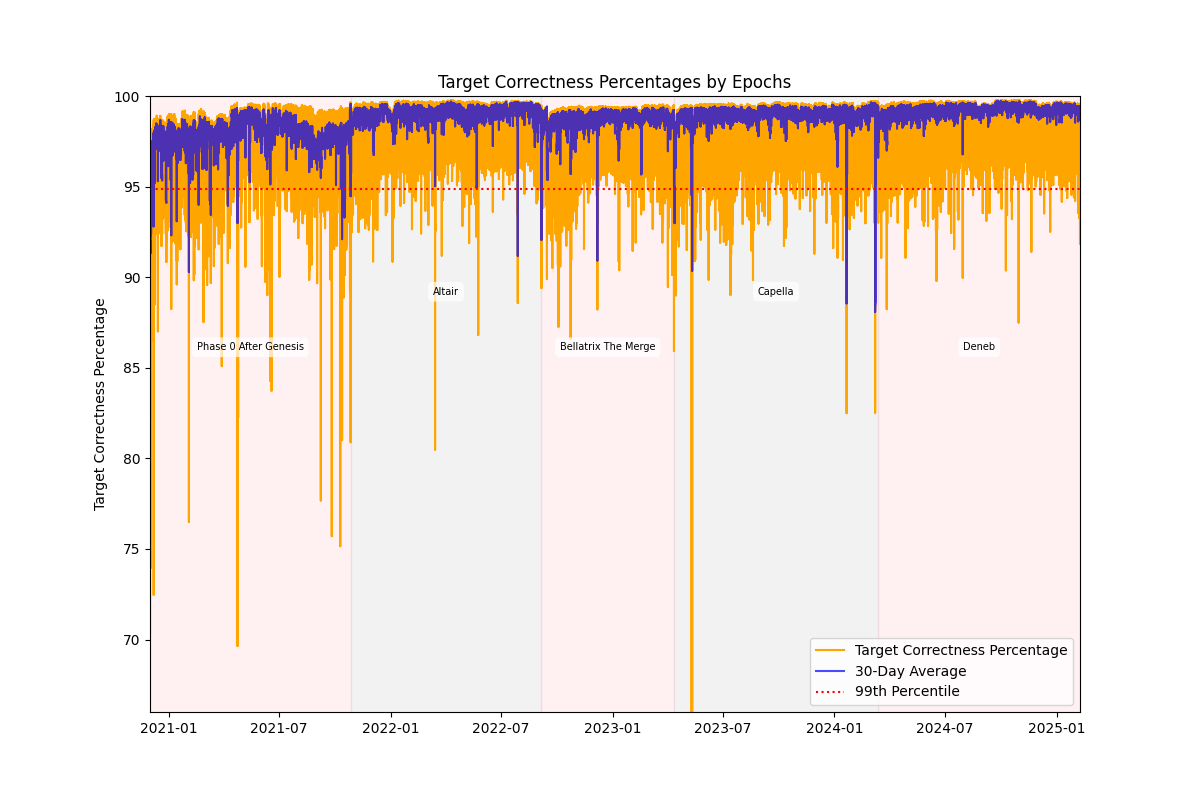
A comparative analysis of source and target correctness shows that drops in both metrics often align, though their magnitudes can vary. For example, during mid-Altair, two declines were observed:
- April 2022: target correctness dropped to 80%, while source correctness remained higher at 84%.
- June 2022: target correctness stayed above 86%, whereas source correctness fell closer to 70%.
These variations suggest that while both attestation types generally behave similarly, discrepancies can occur, leading to one epoch displaying high correctness in one type and lower in the other. Therefore, analyzing epochs having low correctness levels in each attestation type is essential to identify periods of concern.
While the Beacon chain generally performs well, there are moments when either source correctness or head correctness were particularly low, indicating periods of lower performance. However, to assess how concerning these periods truly are, we need to define what constitutes “concern” and select an appropriate time frame for analysis.
Defining Concern
Theoretically, an epoch is considered problematic if correctness drops below 66%; otherwise, it is deemed acceptable. However, for an effective identification of safety-critical periods, a more nuanced understanding of low-performance periods is required.
Choosing the Right Time Frame
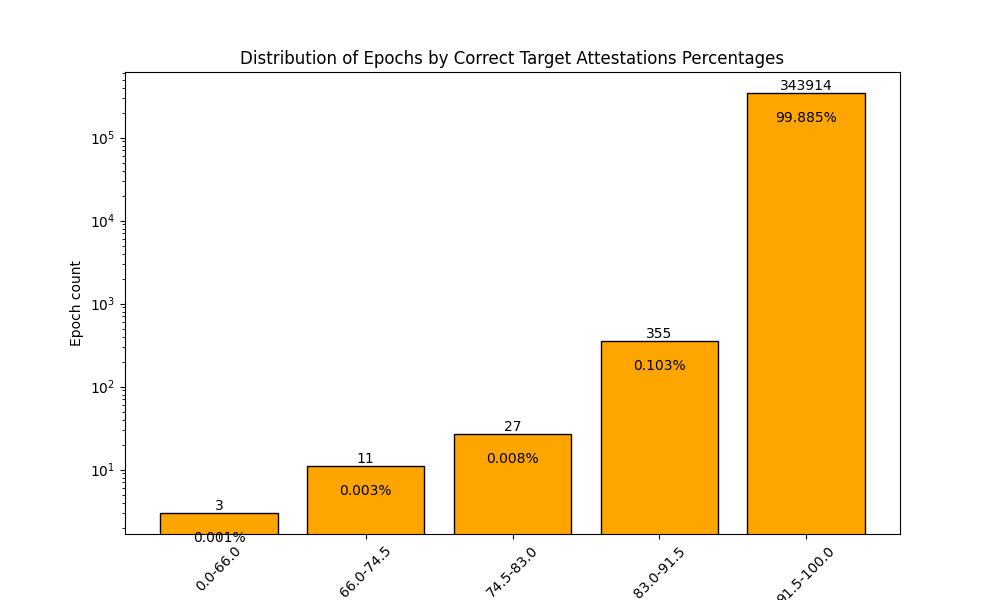
To accurately identify concerning periods, we need a granularity that captures both sustained issues and isolated dips. Looking at the previous figures, which cover over 340,000 epochs, we see that the vast majority maintain correctness levels above 90%. This means that a single dip does not necessarily indicate a prolonged issue—it could be just a brief anomaly. Additionally, the figures below show that 99.85% of epochs maintain source and target correctness above 91.5%, suggesting that anomalies are short-lived.

After testing various granularities, we found that half-day periods (112 epochs) provide the best balance. This approach allows us to capture isolated anomalies and sustained correctness issues, enabling a more precise identification of potential concerns.
Time-discrete Analysis
After analyzing several metrics for the half-day period analysis, we decided to focus on three key metrics for both source and target attestations: i) the average correctness percentage for each period, ii) the minimum correctness percentage recorded within the period, and iii) the coefficient of variation (CV).
Analyzing source correctness over half-day periods, we observe that 99% of time periods have average correctness above 96%. In the figure below, we show the source correctness minimum (purple), average (orange) and CV (green line following the inverted right-hand y-axis). In this figure, each dot is not an epoch, but an interval of 112 epochs.
The source correctness minimum percentages occasionally show significant dips, but these are relatively rare and become less frequent over time. These dips do not always visibly impact overall average correctness. For example, around mid-Altair we can see three periods where the minimum source correctness recorded was significantly low compared to the rest, ranging from 86% to 73%, but these values did not last long enough to substantially affect the overall average. Despite this, such dips are concerning as they stand out compared to the rest of the periods.
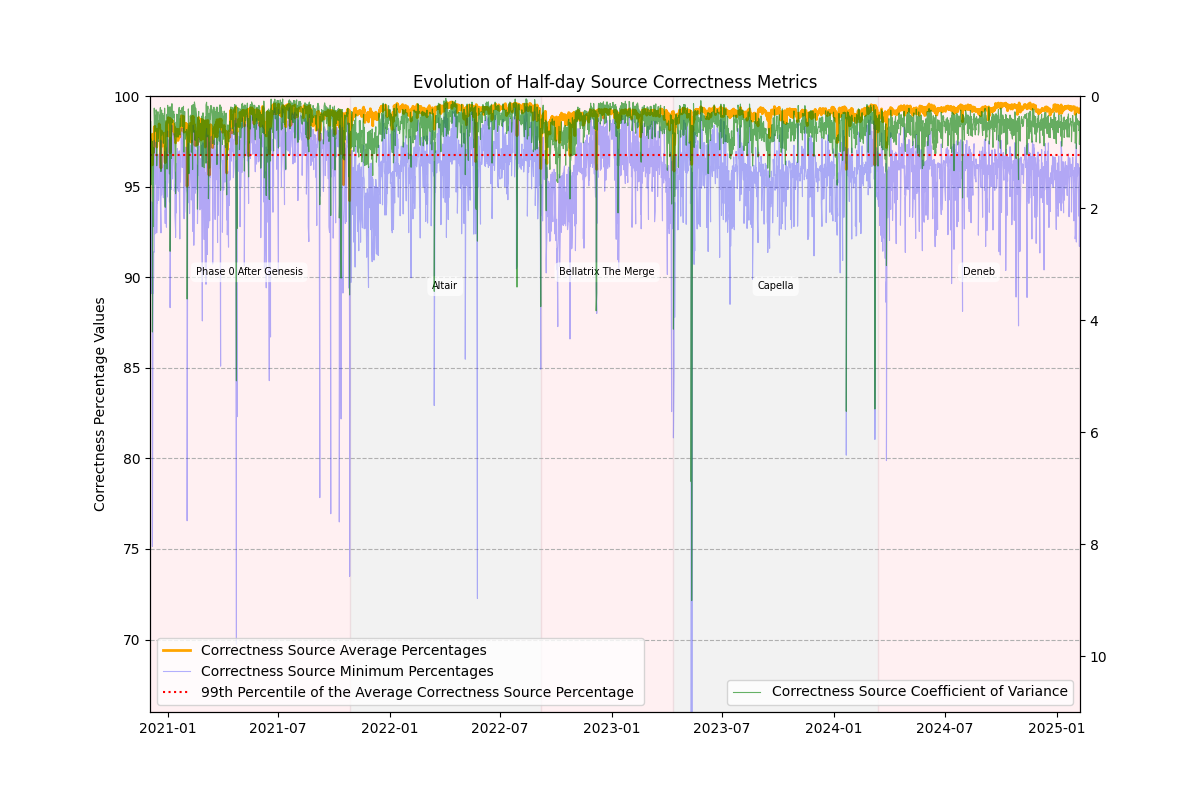
The source CV analysis reveals that while some fluctuations occur, CV remains relatively low, with most time periods showing values below 3%. Notably, at the beginning and end of the Capella era, we observe that high CV values align with the lowest correctness percentages. This suggests that spikes in CV are primarily caused by isolated sharp drops in correctness rather than scattered periods of moderate or consistently low correctness levels.
Analyzing half-day target correctness, we observe a similar trend to source correctness, with 99% of periods maintaining an average correctness above 95%. The only exceptions occur mid and late Phase 0, though even then, the average never dropped below 94%. Looking at minimum correctness values, most periods fall between 90% and 95%, though some dips reach as low as 66%, with one instance dropping even further. When analyzing target CV, we see that most periods have values below 3%, and as observed in the source correctness figure, head CV spikes tend to align with minimum correctness dips.
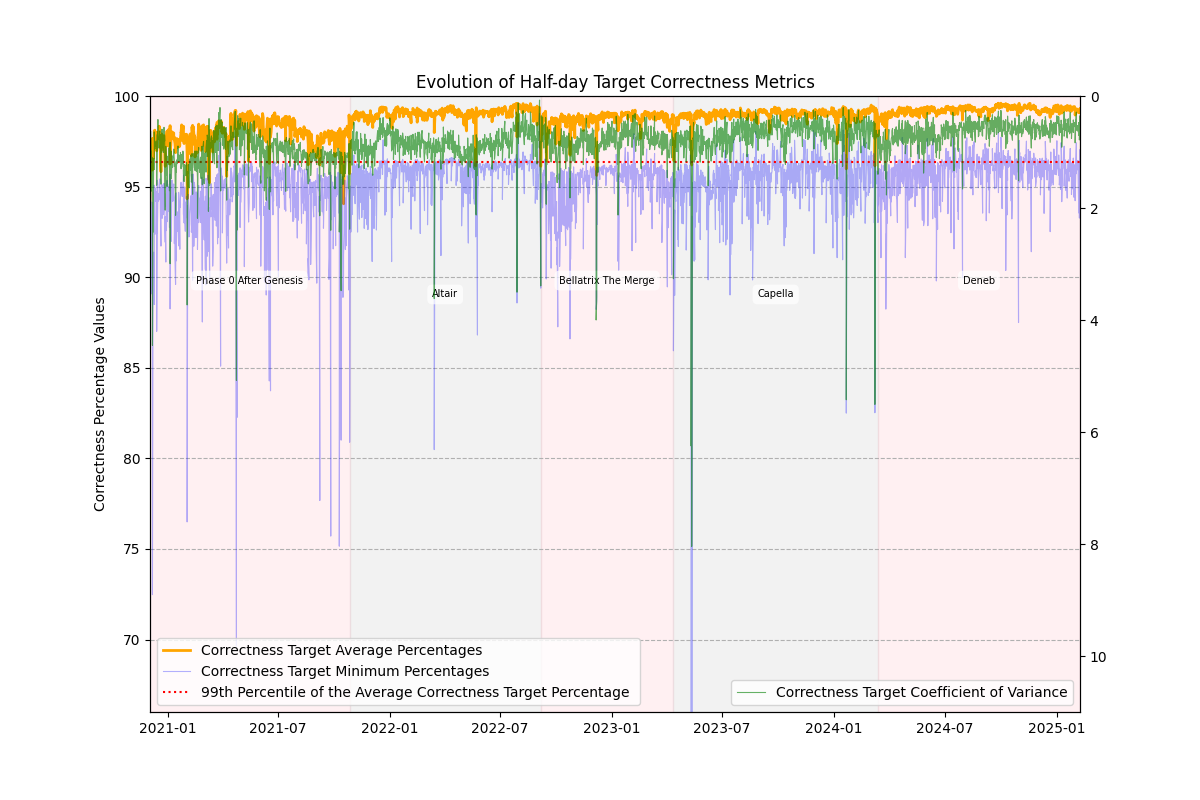
Comparing both figures, we see that source and target correctness evolve similarly, though target correctness is slightly lower overall. In the target correctness figure, the three metrics—average correctness, minimum correctness, and CV—are more clearly separated, highlighting that minimum values tend to be lower and CV values higher.
Identifying Safety-Critical Periods
Now, we want to identify periods where the safety of the chain dropped well below the standard, into potentially critical conditions. Then, we want to characterize those events according to how they affected the chain (amplitude, duration, etc.) To achieve this, we used the minimum value metric and focused on time periods that fell below the 99th percentile of the worst-performing source, target, or both metrics. In other words, we identified whether a given period ranked in the bottom 1% for each attestation type. If this condition was met, we labeled the period as critical. Through this approach, we identified 37 safety critical periods. However, four of these were consecutive to other critical periods. To avoid redundancy, we grouped consecutive periods together, resulting in a final total of 33 distinct critical periods.
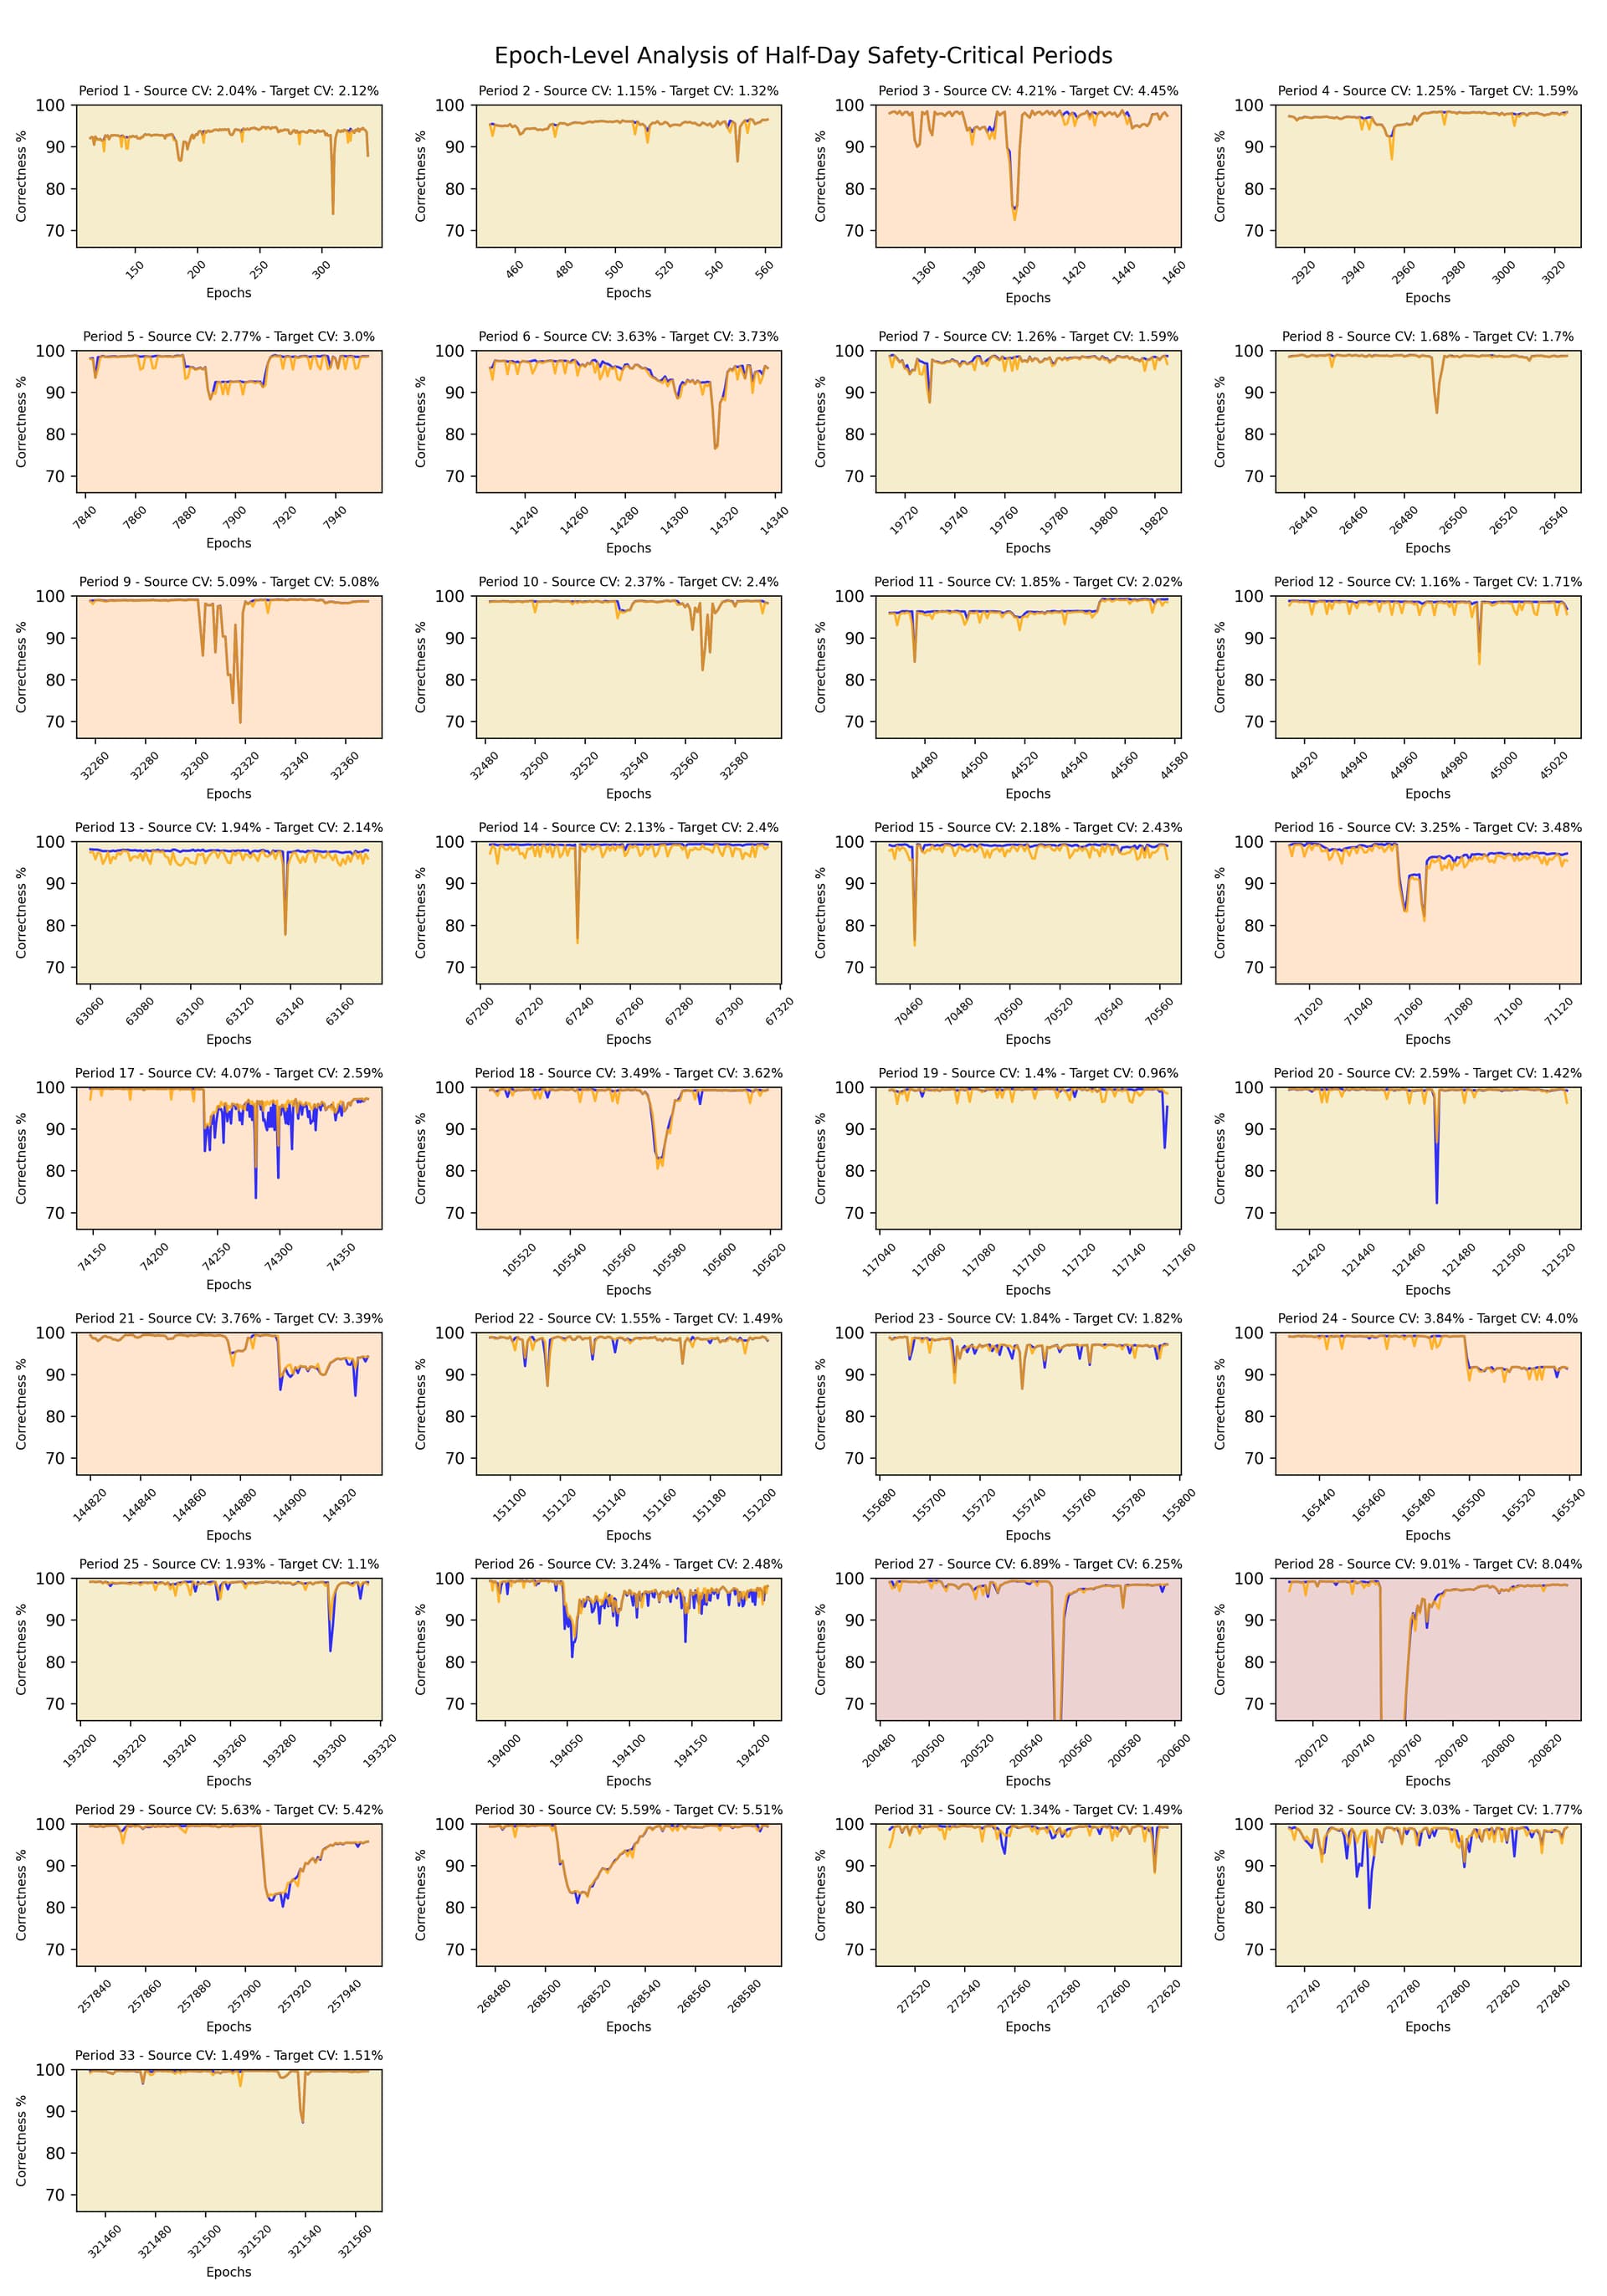
In the figure above, each critical period is represented by a separate plot, showing the source and target correctness percentages for each epoch within each period. Additionally, we have included the source and target CV in the title to help identify patterns between these values and the trends in each figure. To enhance readability, each plot is color-coded according to the following types of safety-critical periods:
Type 1: Moderately Unstable Periods (20 out of 33 periods) - represented by dark yellow plots
- These periods show minimum correctness values dropping as low as 80% and source CV values below 3.5% and target CV below 3%, indicating some instability but no severe disruptions.
- The correctness percentages appear chaotically distributed, with weaker correctness values scattered throughout.
- Example periods: 2, 11, and 23—where dips in correctness are present but not particularly severe.
- Some exceptions, such as periods 14, 15, and 20, exhibit noticeable dips below 80%. However, these disruptions are brief, and the remainder of the period remains relatively stable.
Type 2: Highly Unstable Periods (11 out of 33 periods) - represented by orange plots
- These periods experience significant correctness drops below 80%, often with multiple consecutive epochs of low correctness.
- Example periods: 3, 6, and 9—where instability is sustained across multiple epochs.
- Other cases (e.g., periods 5, 24, 29, and 30) remain relatively stable but feature one major drop, followed by a prolonged recovery phase lasting 20-30 epochs.
- These periods are characterized by strong instability, lower minimum correctness values, and CV values above 3%.
Type 3: Highly Critical Periods (2 out of 33 periods) - represented by red plots
- This category includes only periods 27 and 28, which display extreme dips below 66% correctness.
- While these dips are brief, they are severe enough to classify the period as highly dangerous, as one or more epochs failed to finalize on time.
- Despite most epochs maintaining strong correctness levels, the contrast between normal and low correctness is so sharp that CV values exceed 6%, highlighting extreme volatility.
Conclusions
From these observations, we can conclude that average correctness alone is not a reliable indicator of the worst-performing periods, as it remains consistently high. Instead, minimum correctness values provide a better metric for identifying periods where the safety of the chain was approaching high risk conditions. Given that these concerning periods tend to be short-lived, the half-day granularity appears sufficient to capture their full duration. Regarding the CV metric, we can conclude that since 99% of epochs maintain correctness above 95%, CV is particularly useful for identifying unstable periods. These may include periods with isolated sharp drops as well as periods where minimum correctness values appear acceptable but strong fluctuations indicate high instability.
Analyzing the Beacon chain from its Genesis to today, we have identified 33 events in which the safety of the chain was at its worst, including two critical events, in which the chain finality was at risk. To complement this study, in its second part we will perform a liveness study and isolate periods where liveness was at risk.