This report is a follow-up to our analyses of aggregation functions under different elasticity regimes and the empirical estimation of price elasticities. Those analysis identified the key trade-off between throughput and state growth and estimated the empirical elasticity ranges. Here, we combine both to find the optimal aggregation function and repricing multiplier for EIP-8037.
We introduce two new asymmetric aggregation functions that generalize the existing max function by adding a tunable state weight w_s. They were originally proposed by Anders. We then search over the full parameter space (m, w_s, \text{agg}) to find the configuration that maximizes throughput while keeping state growth below 100 GiB/year for all elasticity pairs in the empirically estimated range.
The analysis can be reproduced by running this notebook.
Key findings:
- All four aggregation functions can meet the 100 GiB/year state growth constraint, but require different repricing multipliers to do so. The asymmetric functions require higher multipliers (m=45) while sum and max work with m=25 and m=30, respectively.
- Throughput gains are modest across the board (1.3x-1.4x median), far below the theoretical 5x gas limit increase. This is a direct consequence of the low empirical burst elasticity (\varepsilon_b \approx 0-0.2): with inelastic burst demand, higher capacity does not translate into proportionally higher usage.
- Asymmetric functions provide a small throughput advantage (~1.4x vs ~1.3x median) over sum and max, but the difference is limited. They also require higher multipliers than sum and max functions.
- The effective price of state creation increases 1.6x-2.3x relative to baseline across all optimal configurations, while the effective burst price drops to 4-9% of baseline. Asymmetric functions lead to slightly smaller effective prices than the max and sum functions.
Background
Our first report analyzed three aggregation functions (sum, max, burst) across a wide grid of elasticities (\varepsilon_s, \varepsilon_b \in [0.1, 1.5]) and two fixed repricing multipliers (m=10 and m=18). That analysis showed a fundamental trade-off between throughput and state growth, and recommended empirical measurement of elasticities to choose between functions.
Our second report estimated those elasticities using daily Ethereum mainnet data and three gas limit increase events from 2025. The central result was that state demand is moderately elastic (\varepsilon_s \approx 0.3-0.6) while burst demand is nearly inelastic (\varepsilon_b \approx 0.0-0.2).
This report builds on both: we use the empirical elasticity ranges to narrow the analysis and jointly optimize the aggregation function, repricing multiplier, and (for the new asymmetric functions) the state weight.
Aggregation functions
We evaluate four aggregation functions. The first two (sum and max) are the same as in our first report. The last two are new generalizations that introduce an asymmetric weight parameter w_s for state resources (with w_r = 1 for burst resources).
| Function | Equilibrium condition | Description |
|---|---|---|
| Sum | s \cdot m^{1-\varepsilon_s} \cdot r^{-\varepsilon_s} + (1-s) \cdot r^{-\varepsilon_b} = n | Resources share block space additively (current EIP-1559). |
| Max | \max(s \cdot m^{1-\varepsilon_s} \cdot r^{-\varepsilon_s},\; (1-s) \cdot r^{-\varepsilon_b}) = n | Bottleneck resource sets the price (current EIP-8037 proposal). |
| Asymmetric max | \max(w_s \cdot s \cdot m^{1-\varepsilon_s} \cdot r^{-\varepsilon_s},\; w_r \cdot (1-s) \cdot r^{-\varepsilon_b}) = n | Like max, but with tunable weights on each resource. A lower w_s reduces the influence of state on pricing. |
| Asymmetric Euclidean | \sqrt{(w_s \cdot s \cdot m^{1-\varepsilon_s} \cdot r^{-\varepsilon_s})^2 + (w_r \cdot (1-s) \cdot r^{-\varepsilon_b})^2} = n | Smooth combination of both resources with tunable weights. Reduces to the L2 norm of the weighted resource usages. |
Here, r = b^*/b^0 is the equilibrium base fee ratio, s is the initial state share, m is the repricing multiplier, and n is the gas limit multiplier.
The asymmetric functions generalize the max function: when w_s = w_r = 1, asymmetric max reduces to standard max, while asymmetric Euclidean interpolates smoothly between sum-like and max-like behavior. By lowering w_s, we reduce the penalty for state usage in the base fee update, allowing higher repricing multipliers before state becomes the bottleneck.
Methodology
Robust optimization
Previous analyses evaluated fixed parameter combinations. Here, we adopt a grid search over the aggregation functions and repricing multipliers that accounts for elasticity uncertainty:
-
Parameter grid: We sweep over repricing multipliers m \in \{10, 15, 20, ..., 50\} and state weights w_s \in \{0.2, 0.4, 0.6, ..., 2.0\} for each of the four aggregation functions. For sum and max, w_s has no effect.
-
Elasticity range: For each configuration, we evaluate all 25 combinations of \varepsilon_s \in \{0.3, 0.375, 0.45, 0.525, 0.6\} and \varepsilon_b \in \{0.0, 0.05, 0.1, 0.15, 0.2\}, based on the empirical estimates from our previous analysis.
-
Robust feasibility: A configuration (m, w_s, \text{agg}) is robustly feasible if annual state growth \leq 100 GiB for every elasticity pair:
- Optimal configuration: Among robustly feasible configurations, the optimal is the one with the highest median throughput gain across all elasticity pairs:
Updated parameters
We use the same equilibrium model as the first report, with parameters updated to reflect the latest empirical data:
| Parameter | Value | Description |
|---|---|---|
| n | 5 | Gas limit multiplier (5x increase) |
| m | 10-50 | State gas cost multiplier (swept) |
| s | 0.23 | Initial state share of gas usage (from empirical analysis) |
| G^0 | 60M gas | Current gas limit |
| b^0 | 1 gwei | Baseline base fee |
| S^0 | 47.3 kB/block | Current state growth (325 MiB/day) |
| \varepsilon_s | 0.3-0.6 | State price elasticity (from empirical estimates) |
| \varepsilon_b | 0.0-0.2 | Burst price elasticity (from empirical estimates) |
Note that the state share s = 0.23 is lower than the s = 0.4 used in the first report, reflecting updated empirical measurements. This means state operations currently consume about 23% of block gas, with the remaining 77% used for burst resources.
Results
Optimal configurations
The best robust configuration per aggregation function is:
| Aggregation function | Optimal m | Optimal w_s | Median throughput gain | Max state growth (GiB/yr) |
|---|---|---|---|---|
| Asymmetric max | 45 | 0.6 | 1.39x | 93 |
| Asymmetric Euclidean | 45 | 0.6 | 1.39x | 92 |
| Max | 30 | - | 1.31x | 84 |
| Sum | 25 | - | 1.27x | 85 |
The plots below show the distribution of throughput gains across all 25 elasticity pairs for each optimal configuration.
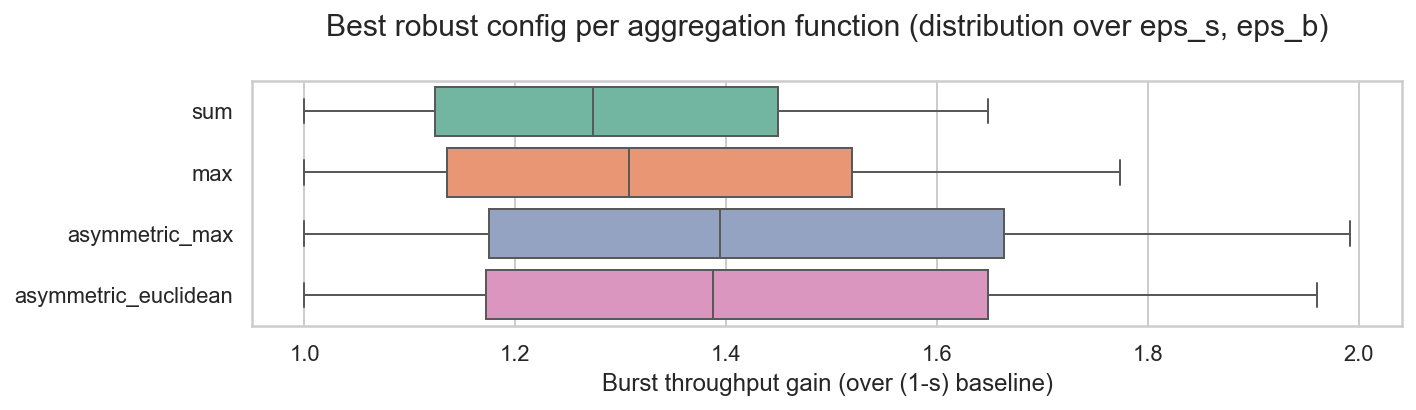
Key observations:
-
Asymmetric functions achieve the highest throughput gains (1.39x median) by enabling higher repricing multipliers (m=45 vs m=25-30). A lower state weight (w_s = 0.6) reduces the influence of state on pricing, allowing a higher m before state growth exceeds the cap.
-
The throughput differences are small: only ~0.1x separates the best (asymmetric max) from the worst (sum). This reflects the dominant effect of the inelastic burst demand.
-
Sum and max achieve comparable state growth control with smaller repricing multipliers (m=25-30 vs m=45), meaning less disruption to current state pricing. The asymmetric functions require higher m to compensate for the reduced state weight, trading a gentler effective price increase for a modest throughput advantage.
Feasibility landscape
For the asymmetric functions, the feasibility landscape shows how the choice of (m, w_s) affects both feasibility and throughput. The heatmaps below show the median throughput gain for each parameter combination, with white cells indicating infeasible configurations and the star marking the optimal.
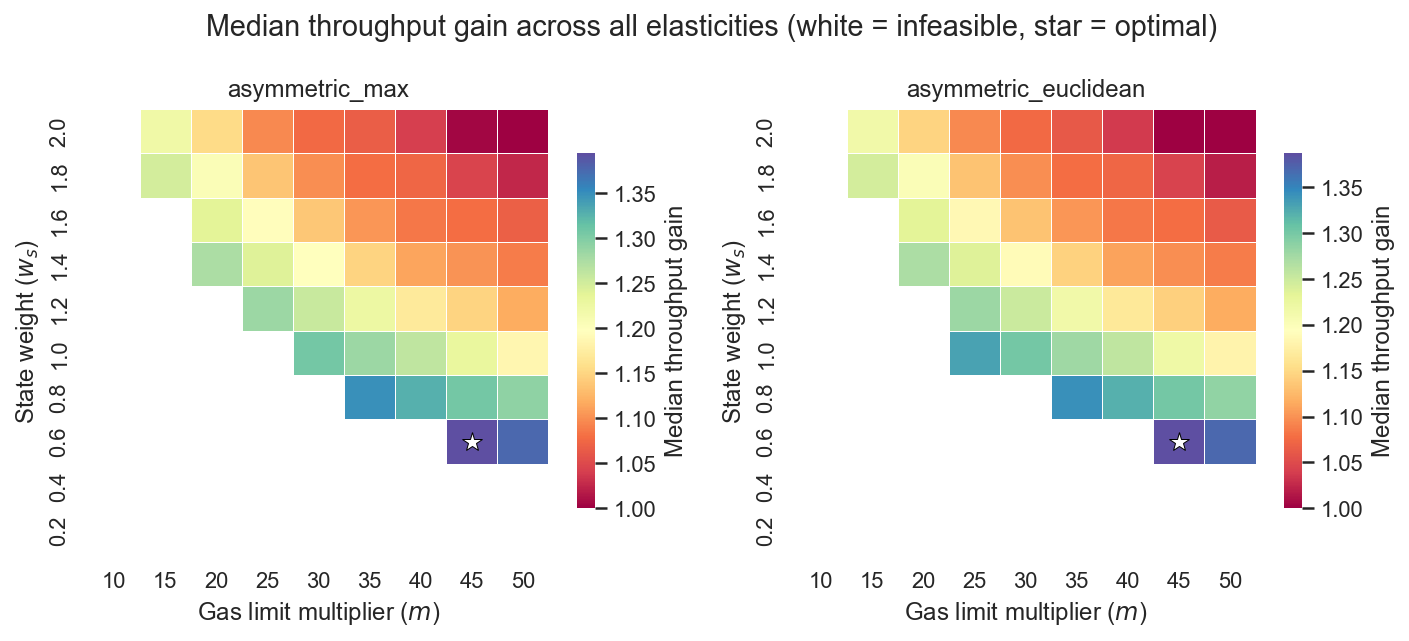
Feasibility requires either a high m (larger state repricing) or a high w_s (more state penalization in the base fee update). The optimal configurations sit at the boundary of the feasible region, balancing a high m with a moderate w_s.
Throughput gain by repricing multiplier
For each aggregation function, the plot below shows the best achievable median throughput gain at each repricing multiplier m, subject to robust feasibility.
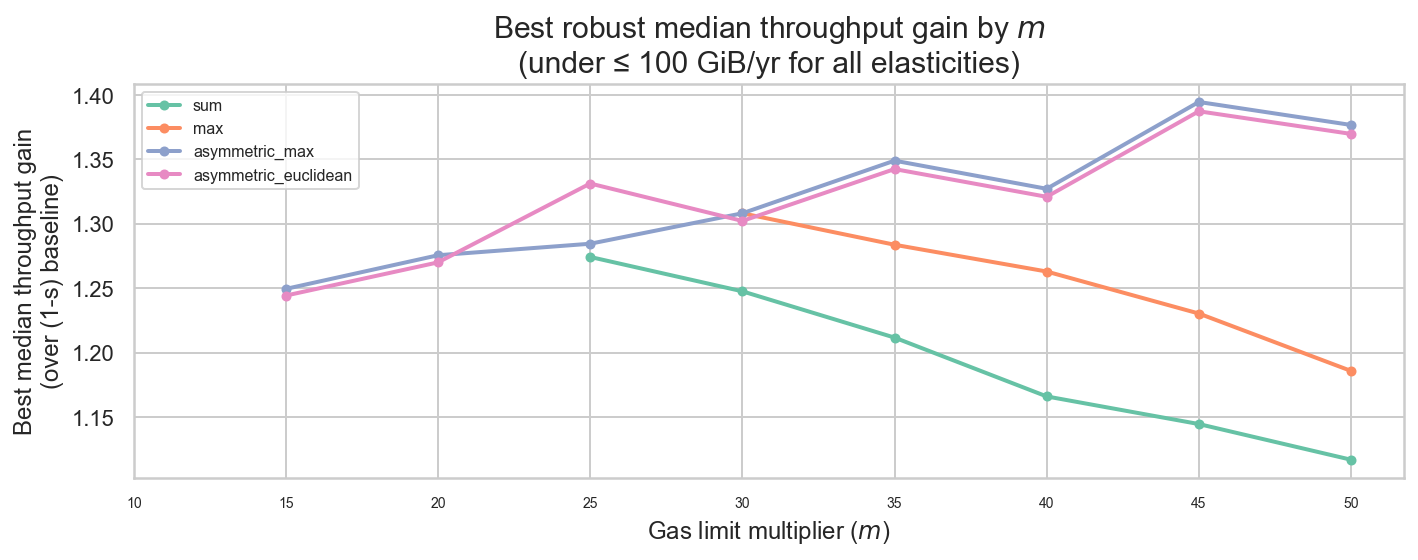
At low m values, the asymmetric functions perform similarly. The asymmetric functions improve as m increases because their tunable weight partially offsets the state cost increase, allowing them to extract more throughput at higher multipliers.
Sum and max only achieve feasible configurations after m=25 and m=30, respectively. They peak at these values and then decline — higher m over-penalizes state, reducing total throughput.
Sensitivity to elasticity
The heatmaps below show how throughput gain vary across the full (\varepsilon_s, \varepsilon_b) range for each optimal configuration. We are not reporting the same metrics for state growth as it is nearly constant across elasticities.
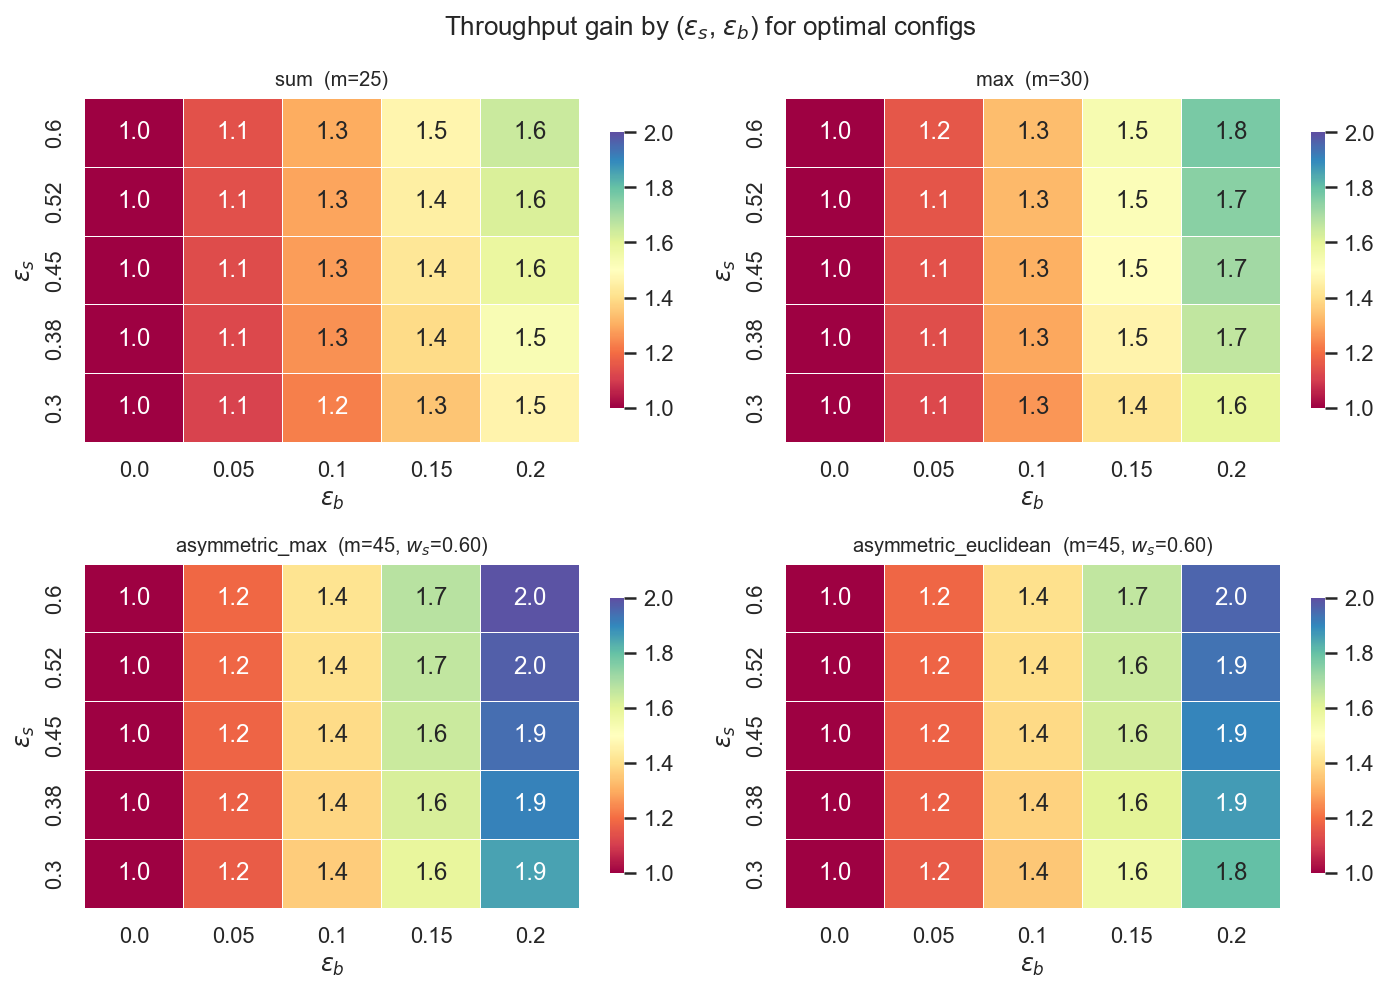
Throughput gains increase with both elasticities across all functions, ranging from 1.0x (at \varepsilon_s = 0.3, \varepsilon_b = 0) to ~2.0x (at \varepsilon_s = 0.6, \varepsilon_b = 0.2) for the asymmetric functions, and up to ~1.8x for max and ~1.6x for sum. The worst case (both elasticities at their minimum) yields no throughput improvement — burst demand is too inelastic to expand with the increased capacity.
Effective price changes
Under EIP-8037, the effective price paid per unit of each resource depends on both the equilibrium base fee b^* and the repricing multiplier m:
- Burst resource: effective price ratio is r^*
- State resource: effective price ratio is r^* \cdot m
Even though the base fee drops substantially, the repricing multiplier dominates for state operations, making them more expensive overall. Concretely, burst operations get substantially cheaper across all configurations (a median of 4-9% of baseline), while state operations become 1.6x-2.3x more expensive (median).
| Aggregation function | m | Median burst price (r^*) | Median state price (r^* \cdot m) |
|---|---|---|---|
| Asymmetric max | 45 | 0.04x | 1.6x |
| Asymmetric Euclidean | 45 | 0.04x | 1.7x |
| Max | 30 | 0.07x | 2.1x |
| Sum | 25 | 0.09x | 2.3x |
The heatmaps below show how the effective state price change varies across elasticity pairs for each optimal configuration.
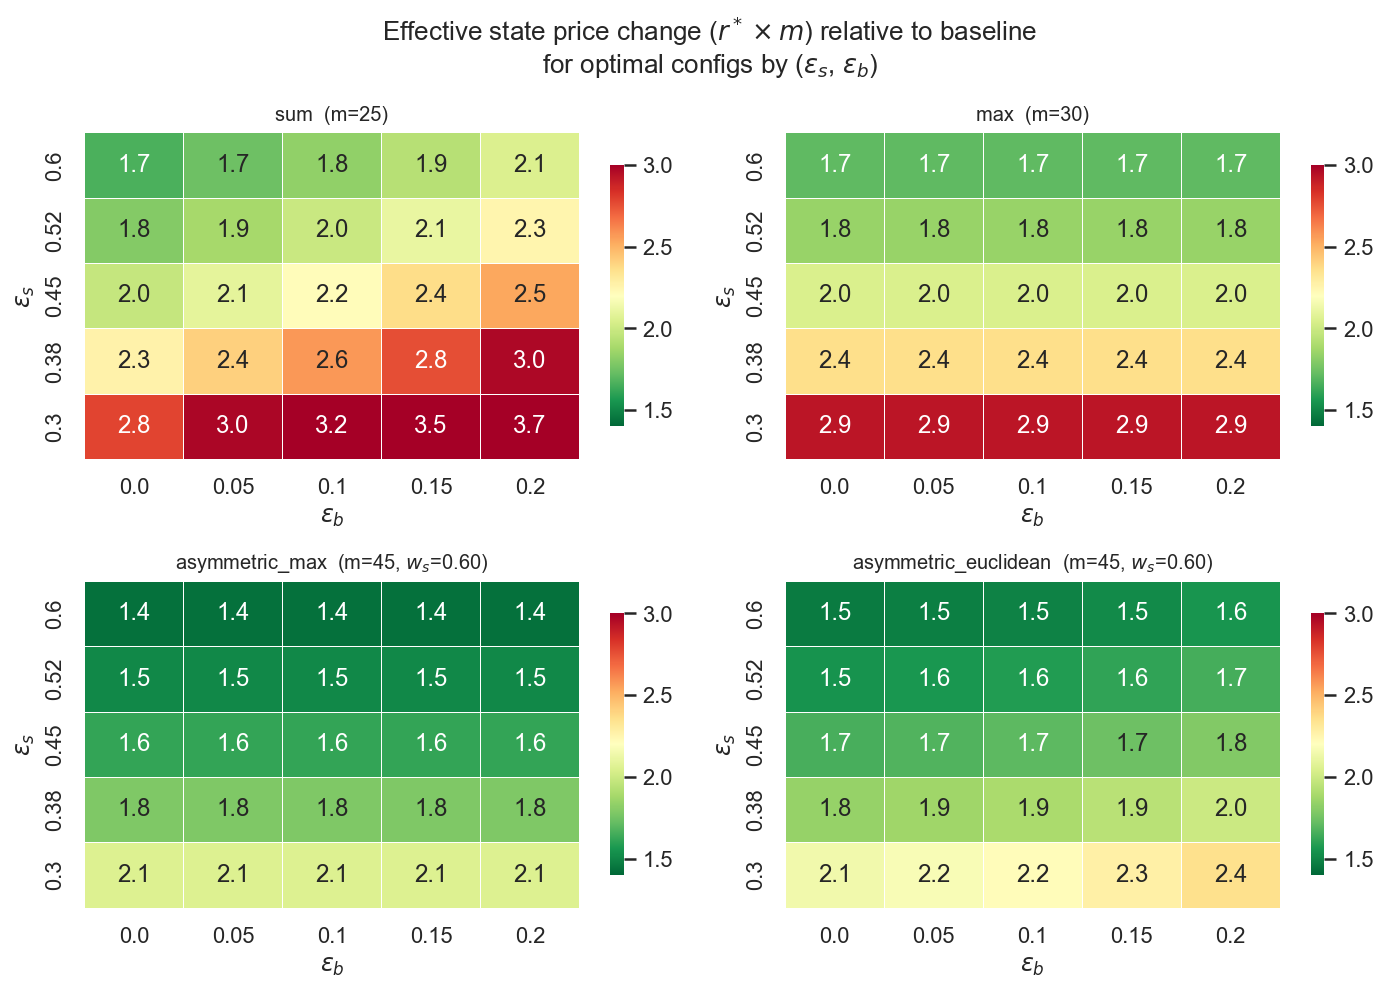
The asymmetric functions achieve the lowest effective state price increase while still meeting the state growth constraint. This is because their higher m is partially offset by a lower equilibrium base fee.
Sum produces the widest state price range, meaning the effective cost of state creation is more sensitive to the actual elasticity values.
Across the board, higher burst price elasticity and lower state price elasticity leads to higher effective state prices.
Conclusions
This analysis narrows the design space for EIP-8037 by using empirically estimated elasticities and a robust optimization approach. The main findings are:
-
Low burst elasticity limits throughput gains. Across all aggregation functions, the median throughput gain is only 1.3x-1.4x - well below the 5x gas limit increase. This is driven by the empirical finding that burst demand is nearly inelastic (\varepsilon_b \approx 0-0.2). With inelastic demand, lower prices from increased capacity do not translate into proportionally higher usage.
-
Asymmetric functions offer marginal improvements. The asymmetric max and asymmetric Euclidean functions require higher repricing multipliers (m=45) to achieve the same state growth rate by reducing the weight of state in the base fee update. They also yield ~0.1x more throughput than sum or max. Whether this marginal gain justifies the added complexity is a design choice.
-
All functions can meet the 100 GiB/year state growth constraint. The constraint is achievable with repricing multipliers of m=25 (sum), m=30 (max), or m=45 (asymmetric functions with w_s = 0.6).
-
Effective state prices increase moderately (1.6x-2.3x). This is substantially less than the raw repricing multiplier because the equilibrium base fee drops. The asymmetric functions achieve the gentlest effective state price increase.