Antero Eloranta, Santeri Helminen - January 28th, 2025
This research has received funding from cyber•Fund. Any opinions in this post are our own.
TL;DR
This study reveals key dynamics in Ethereum’s validator ecosystem. Findings highlight the need to balance execution rewards and staking yields across validator segments. Implementing MEV-Burn with gradual issuance adjustments could promote a decentralized, diverse validator set.
Key Findings:
-
The study reveals notable competitive disparities among Ethereum validators, with large pools currently enjoying a 12% higher mean return compared to single-validator pools. This advantage could potentially increase to 13-15% under proposed issuance curve reductions without MEV-Burn implementation.
-
Economically capped curves might create scenarios where large pools remain profitable while smaller ones incur losses.
-
Elasticity analysis shows solo stakers are particularly sensitive to relative yield decreases, emphasizing the importance of maintaining a balanced competitive landscape. This underscores the potential vulnerability of individual stakers to changes in the ecosystem’s dynamics.
-
Positive market events like the Ethereum Shanghai/Capella upgrade or the Bitcoin ETF launch had significantly more positive net effects on the validator counts of larger stakers compared to smaller ones.
Introduction
The current consensus issuance of Ethereum rewards is proportional to the square root of the deposit size. On top of these rewards, the block proposer is rewarded with execution rewards that depend on how much block builders are paying the proposer to include the block they propose as the next block.
The Ethereum community has discussed changing the issuance curve, e.g. [1, 2, 3, 4]. Some of the most widely discussed curve candidates include a reward curve with gradual reward reduction proposed by Anders, a reward curve with substantial reward reduction proposed by Anders [4] and a reward curve with an economically capped reward issuance proposed by Vitalik [5].
Figure 1: Mean validator rewards under different reward curves

Figure 2: Mean validator rewards under different current and economically capped reward curves

This study analyzes competitive dynamics, elasticities, and event responses within the Ethereum validator ecosystem. Using historical blockchain data from the Beacon Chain genesis to May 2024, we examine differences in competitive advantages between validator subgroups under current and proposed issuance curves. We find that large validator pools (100+ validators) currently have 12-15% higher mean returns compared to solo validators, with proposed issuance reductions potentially exacerbating this advantage.
Elasticity analysis reveals solo stakers are highly sensitive to relative yield decreases compared to other staking categories, while being less responsive to absolute yield changes or DeFi yield fluctuations. Event studies show significant validator behavior changes in response to major ecosystem developments like withdrawal enabling and Bitcoin ETF launches, but limited impact from new staking protocols or macroeconomic events.
Our findings highlight the importance of addressing execution reward imbalances and maintaining relative yield competitiveness across validator segments to preserve a decentralized validator set. We conclude that a balanced approach combining MEV-Burn implementation with gradual issuance adjustments may best maintain a healthy, diverse validator ecosystem. Future research directions are proposed to further explore technological and alternative staking model impacts on validator behavior.
Competitive Advantages Analysis
Current Competitive Landscape
There are differences in the mean consensus and the mean execution rewards as well as the combination of the two between different groups formed based on pool size, category, and entity. The consensus rewards increase as the pool size increases. The mean execution rewards for pools with 1 validator are lower than the mean execution rewards of pools with 100+ validators. The median of execution rewards increases as the pool size increases. Combining the consensus and execution rewards results, pools with size 1 have lower total rewards compared to pools with size of 100+ with the mean rewards for pools with size of 100+ being 12% higher.
When grouped by category liquid restaking and solo stakers have lower than mean consensus rewards while CEX, liquid staking, and staking pools have higher than mean consensus rewards. Considering execution rewards no category’s execution rewards statistically significantly differ from the sample mean. Combining both consensus and execution rewards, no category has statistically significantly different rewards from the mean.
Observing the 10 biggest individual entities. Out of the entities Lido, Binance, Kraken, and OKX have higher than mean consensus rewards while Coinbase, Rocketpool, Bitcoin Suisse, and Ether.Fi have lower than mean consensus rewards. No individual entity has execution rewards statistically significantly different from the mean. Combining consensus and execution rewards Lido has higher than average rewards while Rockerpool has lower than average rewards.
Gradual Reward Curve Reduction
Anders proposed a reward curve with gradual reward reduction where the yield of consensus rewards follows a formula y_i = \frac{cF}{\sqrt{D}(1 + \frac{D}{k})} where k = 2^{26}. Based on the analyzed sample if the issuance curve was to be changed and MEV-burn was not implemented this would result in a situation where staking pools with the size of 1 validator would have a mean APY of 3.13% while the pools with the size of 100+ validators would have a mean APY of 3.55% when considering the execution rewards. This means rewards for pools with a size of 100+ would be 13% higher than that of pools with a size of 1.
Figure 3: Validator rewards for different size of validators under gradual reduction curve

Substantial Reward Curve Reduction
Anders also proposed an alternative reward curve with substantial reward reduction where the yield of consensus rewards follows a formula y_i = \frac{cF}{\sqrt{D}(1 + \frac{D}{k})} where k = 2^{25}. Based on the analyzed sample if the issuance curve was to be changed and MEV-burn was not implemented this would result in a situation where staking pools with the size of 1 validator would have a mean APY of 2.63% while the pools with the size of 100+ validators would have a mean APY of 3.02% when considering the execution rewards. This means rewards for pools with a size of 100+ would be 15% higher than that of pools with a size of 1.
Figure 4: Validator rewards for different size of validators under substantial reduction curve

Economically Capped Curve
Vitalik proposed an economically capped reward issuance curve in his blog post. Under this curve, staking yield would follow y_i = cF(\frac{1}{\sqrt{D}} - \frac{0.5}{\sqrt{2^{25} - D}}) and become negative after a certain threshold staking amount is met. Based on the analyzed sample if the issuance curve were to be changed and MEV-burn was not implemented this would result in a situation where staking pools with the size of 1 validator would have a mean APY of 1.65% while the pools with the size of 100+ validators would have a mean APY of 1.97% when considering the execution rewards. Adopting such curve might create a scenario where the biggest pools could operate profitably while smaller pools would be losing money.
Figure 5: Validator rewards for different size of validators under economically capped curve

Elasticity Analysis
Staker behavior and elasticity were studied through validator yield and external market factors, examining deposits, withdrawals, and changes in total validator count. Validator yield was analyzed both in absolute terms and relative to other stakers. External market factors included Ethereum market price and DeFi yields from liquid staking tokens on Aave lending and Curve liquidity.
Validator APY
Solo stakers show negative elasticity in deposits when their yields fall relative to other staking options. They’re less responsive to changes in total staking yield or DeFi yields. This could suggest solo stakers prioritize their competitive position over general market conditions when making staking decisions.
Figure 6: Staking APY difference elasticity

External Market Factors
Our analysis shows distinct ETH price elasticity patterns across validator groups. Solo stakers and major entities like Lido and Binance are less likely to exit during price increases, showing negative elasticity (-0.4031 to -0.7476). Conversely, staking pools (1.1772) and entities like Ledger Live (4.1524) demonstrate higher exit rates as prices rise. Liquid restaking services show notably strong negative elasticity (-6.2982).
DeFi yields from Aave and Curve protocols showed no significant impact on validator behavior, suggesting stakers’ decisions are primarily influenced by ETH price movements rather than DeFi opportunities.
Events Study
The study also investigates staker reactions to major events. The Rocket Pool mainnet launch and the FED’s first major interest rate hike did not significantly impact validator deposits, indicating limited immediate influence on staking behavior.
The Shanghai/Capella upgrade, which enabled staking withdrawals, led to increased deposits for larger pools and more exits from centralized exchanges and liquid staking providers.
Figure 7: Validator deposits one week before and after the Ethereum Shanghai/Capella upgrade that allowed staker withdrawals. The deposits have been normalized by the net deposits of the subgroup.

Figure 8: Cumulative validator exits by pool size for one month after the Shanghai/Capella upgrade. The exits have been normalized by the subgroup validator count at slot 6202800.
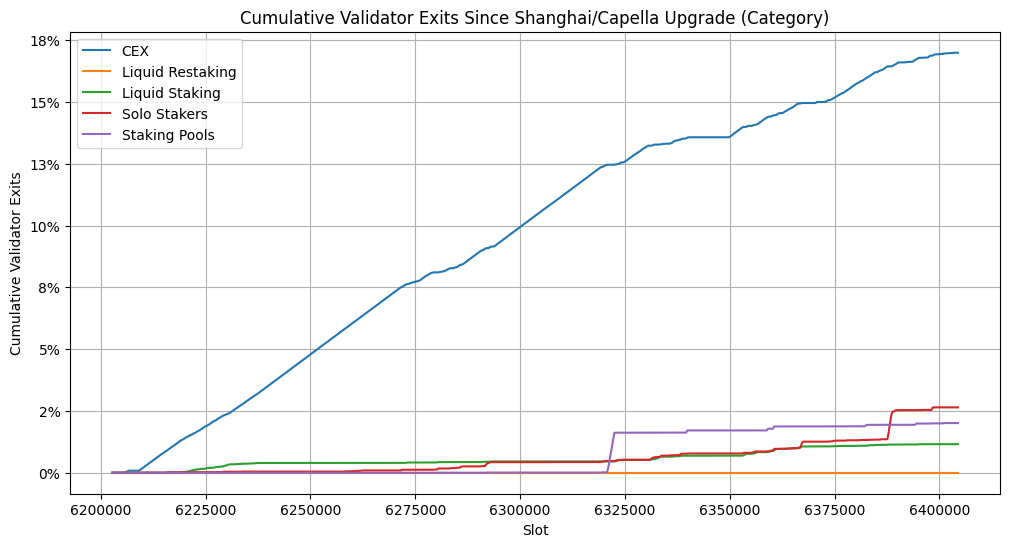
The launch of the first Bitcoin ETF significantly increased validator exits across most pool sizes and categories, except for the largest pools and staking pools. This behavior, prevalent in the retail-heavy CEX category, may reflect a “sell the news” phenomenon where stakers capitalized on positive news by exiting their positions in anticipation of a price correction.
Figure 9: Validator exits one week before and after the launch of the first Bitcoin ETF. The exits have been normalized by the active validator count of the subgroup.

Conclusion
In conclusion, this study provides insights into the competitive dynamics, elasticities, and event responses within the Ethereum validator ecosystem. The findings underscore the importance of addressing execution reward imbalances and balancing relative staking yield differences among validator segments. A balanced approach involving MEV-Burn and gradual issuance adjustments may better maintain a healthy, decentralized validator set, preserving incentives for diverse participation. Future research could explore the impact of regulatory changes, technological advancements, and alternative staking models on validator behavior, accounting for potential time lags and non-linear effects.