by Fei Wu - This work was partially conducted during my internship at the EF. I thank my mentor @misilva73 for valuable discussions, feedback, and comments.
Overview
In the previous analysis, we study the multi-dimensional fee market across a range of EIP-7999 configurations. It is not yet clear whether moving from a one-dimensional mechanism with a single base fee shared by all resources to a multi-dimensional mechanism with separate resource prices will bring benefits. In this post, we analyze a post-Glamsterdam one-dimensional fee market under three one-dimensional benchmarks.
We begin with a baseline configuration, which retains the specified transaction floor price of 64 gas per byte in EIP-8131/8279 and CPSB = 1530 in EIP-8037. We then construct two adjusted benchmarks by adjusting the floor price according to different slot-time allocations and recalibrating CPSB, which are considered in EIP-8368 and EIP-8372. We simulate these one-dimensional benchmarks under the same constructed demand conditions as we simulated EIP-7999, and compare with selected EIP-7999 configurations.
The results presented in this post can be reproduced from this repository.
Main results
- The baseline one-dimensional fee mechanism with 64-gas-per-byte floor and
CPSB = 1530permits substantial state growth while limiting execution. It delivers 82.0M–92.6M execution gas per block and approximately 288–403 GiB/year of state growth. - EIP-8368-style
CPSBrecalibration restores the state-growth budget but retains the relative-price mismatch. Physical state growth falls to approximately 121–122 GiB/year, while the higher shared base fee reduces delivered execution to 67.5M–70.2M. - EIP-8372-style calibration recovers much of the execution shortfall, but both branches underutilize the target. It delivers 151.9M–177.9M execution, but regular and normalized-state utilization on average remain below their targets, producing approximately 86–88 GiB/year of realized state growth.
- EIP-7999 supports more execution while keeping state gas near its separate target. The maximum-throughput configurations deliver 252.9M–272.6M execution gas, while historically anchored configurations deliver 173.6M–223.0M. Both maintain 120 GiB/year of state growth.
Mechanism and notation
One-dimensional means a shared-fee, two-dimensional metering mechanism. The shared base fee responds to the larger of regular gas and state gas. EIP-7999 instead maintains separate execution, data, and state base fees, and its bundle-priced demand model includes the data cost of BAL in parent execution and state prices.
| Benchmark | Floor price | State pricing | Fee update rules |
|---|---|---|---|
| one-dimensional: baseline | 64 gas per counted byte | CPSB = 1530 |
One shared base fee with EIP-1559 update rule |
| one-dimensional: floor-adjusted + EIP-8368 | Derived for each slot-time allocation | CPSB matched to the gas limit |
One shared base fee with EIP-1559 update rule |
| one-dimensional: floor-adjusted + EIP-8372 | Derived for each slot-time allocation | Normalized state gas limit and CPSB |
One shared base fee with EIP-1559 update rule |
| EIP-7999 | No floor, separately priced data resource | 75M state target with CPSB = 1530 |
Three separate base fees with fake-exponential update rule |
The one-dimensional specification combines EIP-8037 state accounting, EIP-8038 and EIP-2780 execution repricing, and data pricing which includes the static data and runtime BAL in the transaction floor in EIP-8131 and EIP-8279.
| Notation | Meaning |
|---|---|
| i\in\{E,D,S\} | Resource index: execution (E), data (D), or state growth (S) |
| q_i | Activity of resource i in the historical gas-equivalent units used by the demand model |
| q_i^0 | Historical mean activity of resource i per block over February–May 2026, used as its quantity anchor |
| m_i | Counterfactual metering multiplier for resource i |
| \epsilon_i | Positive demand-elasticity magnitude governing the response of resource i to its effective price |
| F | Floor price in gas per byte |
| \mathrm{CPSB} | State gas charged per state byte under EIP-8037 |
| p^0 | Historical reference base fee used as the price anchor, expressed in the same units as b |
| b | Base fee shared by all resources |
| m_i b/p^0 | Effective price of resource i relative to the historical price anchor |
| g_{\mathrm{regular}} | Repriced execution gas plus transaction-floor/data gas |
| g_{\mathrm{state}} | EIP-8037 state gas, m_Sq_S |
| g_{\mathrm{shared}} | Fee-controlled usage, \max(g_{\mathrm{regular}},g_{\mathrm{state}}) |
| L_G,T_G | Common gas limit and target, with T_G=L_G/2 |
| B_{\max}(t_{\mathrm{prop}}) | Payload-byte capacity implied by the empirical-p90 propagation fit |
The superscript 0 denotes the anchor.
The central benchmark uses the 35-day independent elasticity estimates (\epsilon_E,\epsilon_D,\epsilon_S)=(0.1212,0.2295,0.3349). One shared base fee controls the three activity quantities through their counterfactual effective prices:
The two metered gas branches are:
EIP-1559-style update rule. For block t, the update rule uses gas usage of the bottleneck branch in the block: g_{\mathrm{bottleneck},t}^{\mathrm{included}}=\max(g_{\mathrm{regular},t}^{\mathrm{included}},g_{\mathrm{state},t}^{\mathrm{included}}). With b_t measured in wei, the next block’s base fee is
All comparisons use the same demand conditions with 32 bootstrap paths constructed from the 60-day block panel from April to May 2026. Each path has 7,200 burn-in blocks followed by 50,400 measured blocks. Gas usage and block limit frequencies are averaged over measured blocks and then over simulated paths.
Baseline: 64-gas-per-byte floor and CPSB=1530
The baseline keeps the EIP-8131 and EIP-8279 floor price at 64 gas per byte and CPSB = 1530. For each propagation time t_{\mathrm{prop}}, the execution-time gas capacity and the payload-byte budget are:
The gas limit is the smaller of the execution-time gas capacity and the gas usage of a worst-case payload:
The derived gas limit is 359.6M at 3 seconds and 433.6M at 3.5 seconds because the data capacity is the constraint. From 4 seconds onward, execution capacity sets the gas limit. Unlike EIP-7999 configurations, where we fix the execution/data target and change the limit, we keep the target-to-limit ratio fixed at 1/2.
Data pricing
Under the one-dimensional fee mechanism, EIP-8131 static transaction content bytes and EIP-8279 runtime BAL are priced through the transaction floor. As is in the previous analysis, we sample 6,000 deterministic blocks containing 1,899,748 transactions from February through May 2026, and reconstruct the repriced execution gas, static-content floor, and EIP-8279 runtime BAL bytes.
Let F be the floor price, E_j be repriced regular execution gas for transaction j, C_j its static data bytes in the floor, and M_j its runtime-metered BAL bytes. The metered regular-branch gas is:
At a floor price of 64 gas per byte, ordinary execution charges absorb most of the runtime BAL floor extension in the historical sample. A cold storage access illustrates the coverage under this floor price: its 32-byte key contributes 32\times64=2{,}048 gas in the floor through runtime BAL, while it consumes 2,100 execution gas. Adding runtime BAL increases regular-branch gas for 2.05% of sampled transactions. Transactions already bound by the static floor or within 10% of it account for approximately 75% of the BAL-induced gas uplift, while deployed-code-driven floor exposure contributes another 16% because code deployment consumes state gas under EIP-8037 rather than regular gas.
Consequently, this increment is calibrated into a larger data multiplier of 2.1615.
Simulation results

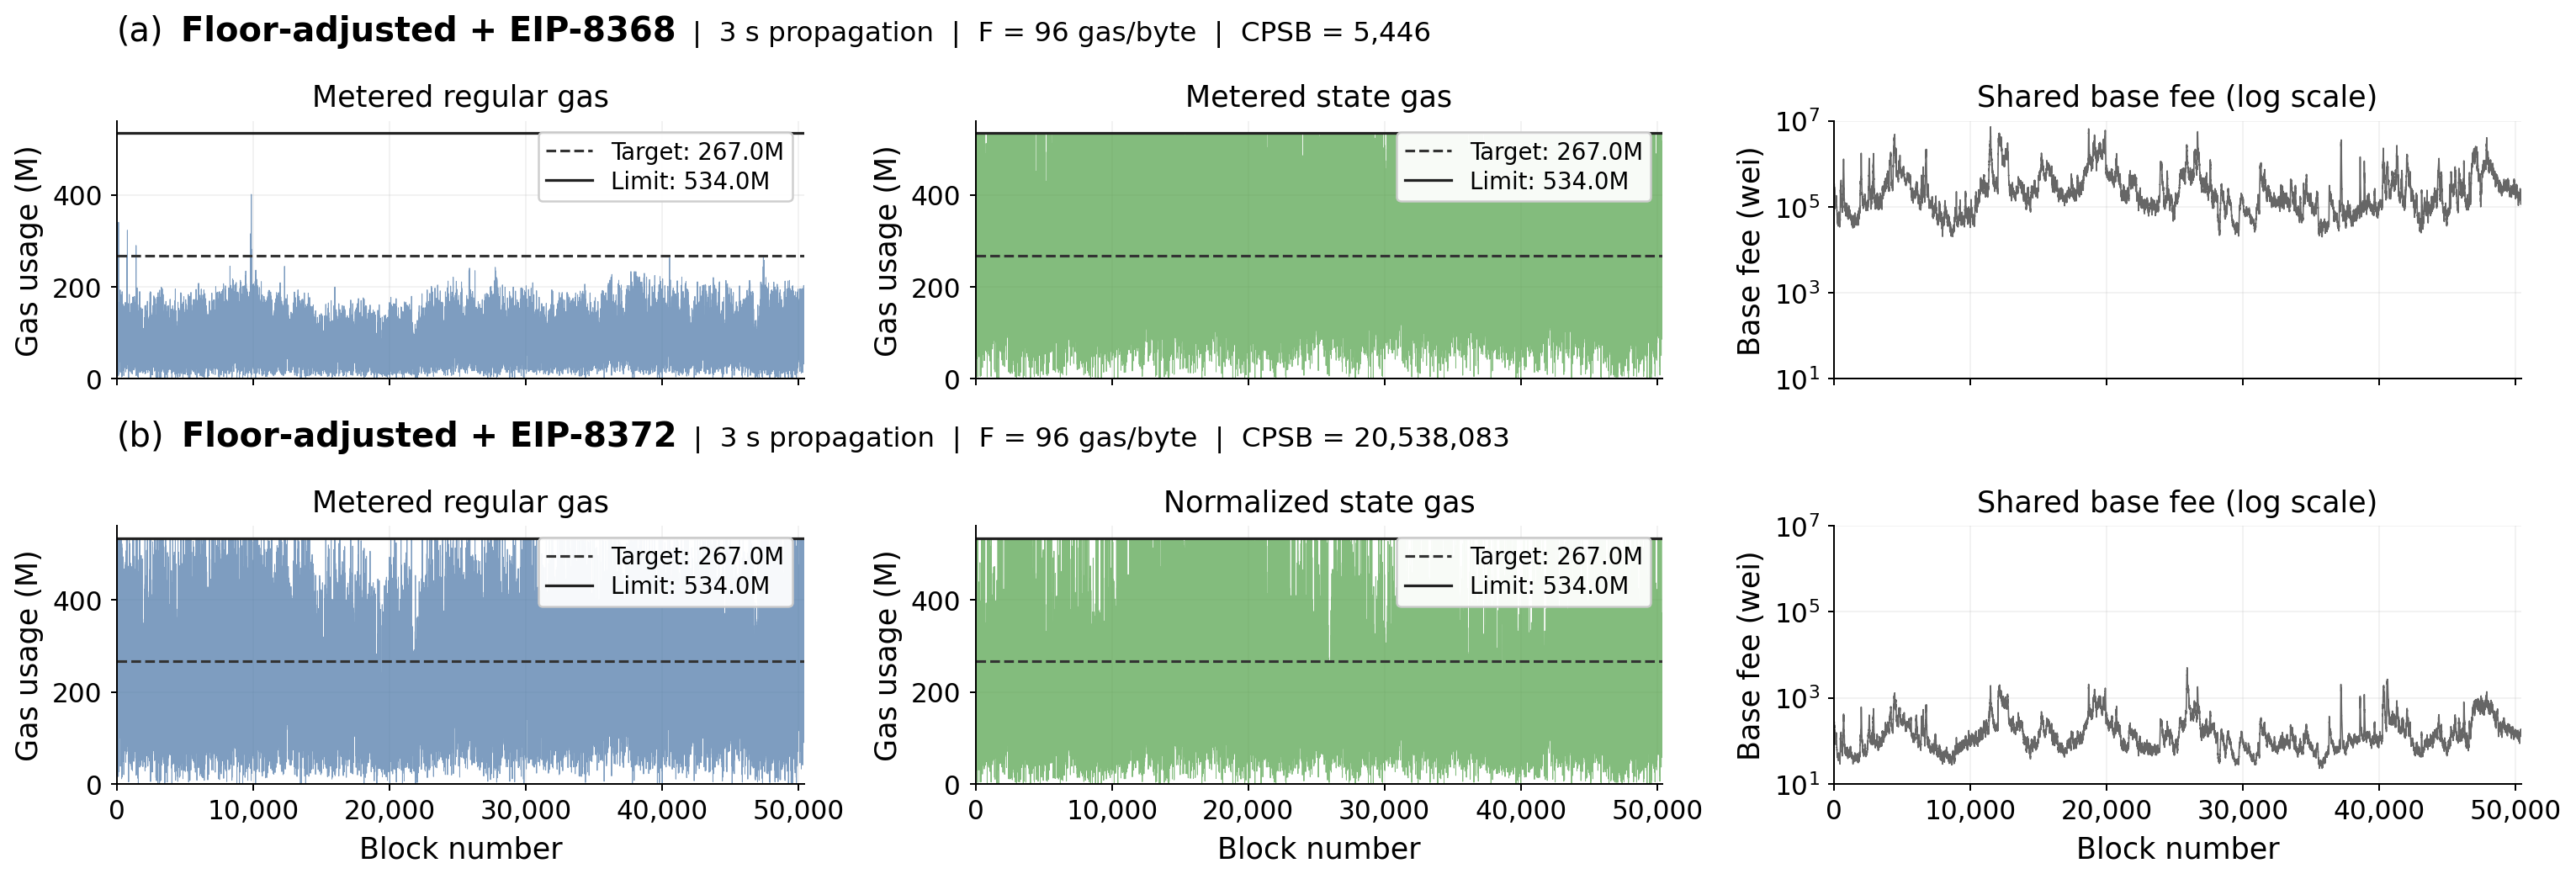
Metered regular gas, metered state gas, and the shared base fee over the 50,400 simulated blocks. The three-second propagation configuration has a common target of 179.8M gas (dashed) and limit of 359.6M gas (solid), with a floor of 64 gas per byte and
CPSB = 1,530. The shared fee responds to the larger of the two metered branches and is displayed in wei on a logarithmic scale. The simulation uses the 35-day elasticity vector.
| Propagation | Target / limit | Equilibrium base fee | Mean metered execution | Mean data/floor gas | Mean state gas | State growth (GiB/year) | Blocks at limit | Fee variation | State as bottleneck |
|---|---|---|---|---|---|---|---|---|---|
| 3.0s | 179.8M / 359.6M | 86,981 wei | 82.0M | 12.0M | 180.1M | 288.1 | 7.99% | 0.0608 | 92.49% |
| 3.5s | 216.8M / 433.6M | 49,756 wei | 87.9M | 13.7M | 218.2M | 349.0 | 8.17% | 0.0611 | 95.02% |
| 4.0s | 250.0M / 500.0M | 32,513 wei | 92.6M | 15.1M | 252.2M | 403.4 | 8.27% | 0.0613 | 96.27% |
| 4.5s | 225.0M / 450.0M | 44,535 wei | 89.1M | 14.0M | 226.6M | 362.5 | 8.20% | 0.0612 | 95.39% |
| 5.0s | 200.0M / 400.0M | 63,308 wei | 85.3M | 12.9M | 200.9M | 321.4 | 8.10% | 0.0610 | 94.08% |
Similar to what we have observed in the Glamsterdam fee market equilibrium analysis, under the unrestricted isoelastic model, state is the bottleneck branch in equilibrium and determines the fee in more than 90% of the simulated blocks. State activity expands more strongly as the shared base fee falls because it has the highest estimated elasticity, while EIP-8037’s repricing assigns substantially more metered gas to each unit of state creation activity. Together, these effects make the state branch reach the common target at a fee that leaves regular-branch usage below target. Thus, the shared base fee needed to accommodate state demand limits the expansion of execution.
Because CPSB remains calibrated to a 75M state target with 150M gas limit, while the simulated targets range from 179.8M to 250M, physical state growth rises far above the original 120 GiB/year target.
Adjusted floor + EIP-8368 recalibrated CPSB
Under a floor price of 64 gas per byte and shorter propagation times, the gas limit is determined by the amount of gas allowed in the worst-case payload. The floor price can be adjusted according to the propagation time so that the execution capacity equals the worst-case payload gas usage, bringing the allowed gas limit to its maximum. In addition, we adjust the CPSB value according to the derived gas limit under each propagation time, so that actual state growth approximates the 120 GiB/year target.
Choosing the floor price
As mentioned above, the gas limit can be given by
When L_E(t_{\mathrm{prop}}) = FB_{\max}(t_{\mathrm{prop}}), the gas limit reaches its maximum.
However, as mentioned in this post, a block full of ETH transfers imposes an additional payload constraint. An ETH transfer transaction uses 21,000 gas and contributes 221 physical payload bytes, giving 96 gas per byte after integer rounding. Therefore, further increasing the floor price above 96 does not allow a higher gas limit because the worst-case payload defined by a block full of ETH transfers. Therefore, the gas limit and the floor price can be given by
EIP-8368: CPSB recalibration for new gas limit
EIP-8037’s CPSB = 1530 is derived from a 75M state-gas target and 120 GiB of annual state growth. In EIP-8368, if the gas target changes, preserving the same physical state budget requires:
With T_G=L_G/2, this is approximately:
The state multiplier scales with the same ratio.
Data multiplier
For each floor price F, we repeat the transaction-level floor calculation on the same historical sample and recalibrate the data multiplier m_D(F). The multiplier reproduces the weighted historical mean of the data/floor contribution. In the dynamic model, this contribution scales with aggregate static-data activity, and runtime BAL is not treated as an independently demanded resource.
The historical composition provides some support for this approximation. At F=96, adding runtime BAL increases metered regular-branch gas for 6.79% of sampled transactions, including transactions whose static floor was already binding. The resulting uplift is approximately 2.75% of total counterfactual regular gas at the historical anchor, and 87.16% of the additional metered gas comes from the 10% of sampled transactions containing the most static transaction data. Thus, the extra charge is concentrated in transactions already carrying substantial static data content.
This concentration does not make the multiplier a structural demand model. At floor rates of 82 and 96, a 32-byte cold storage access contributes 2,624 and 3,072 floor gas through runtime BAL, respectively, exceeding its 2,100-gas execution charge. Therefore, access-intensive transactions can become floor-exposed through the BAL they generate. Representing the resulting uplift through m_D(F) assumes that its aggregate contribution continues to follow static-data activity as prices and transaction composition change.
The static-data demand curve responds to the effective price m_D(F)b. The model omits the execution and state-demand response of transactions whose total bills change through BAL-related floor exposure. Unlike the EIP-7999 bundle pricing model, it does not explicitly feed those charges into parent execution/state activity prices. We interpret the higher floor-rate results as an anchor-calibrated reduced form.
The table below summarizes the one-dimensional configurations with adjusted floor price and CPSB.
| Propagation | Shared gas limit | Floor price (gas/byte) | CPSB |
State multiplier m_S | Data multiplier m_D | Bottleneck setting the limit |
|---|---|---|---|---|---|---|
| 3.0s | 534.0M | 96 | 5,446 | 20.1349 | 4.0325 | ETH-transfer payload |
| 3.5s | 550.0M | 82 | 5,610 | 20.7398 | 3.0875 | Execution time |
| 4.0s | 500.0M | 64 | 5,100 | 18.8544 | 2.1615 | Execution time |
| 4.5s | 450.0M | 50 | 4,590 | 16.9689 | 1.7634 | Execution time |
| 5.0s | 400.0M | 40 | 4,080 | 15.0835 | 1.5887 | Execution time |
Simulation results
| Propagation | Target / limit | Equilibrium fee | Mean metered execution | Mean data/floor gas | Mean state gas | State growth (GiB/year) | Blocks at limit | Fee variation | State as bottleneck |
|---|---|---|---|---|---|---|---|---|---|
| 3.0s | 267.0M / 534.0M | 332,742 wei | 70.0M | 14.4M | 270.5M | 121.6 | 8.47% | 0.0618 | 98.51% |
| 3.5s | 275.0M / 550.0M | 323,038 wei | 70.2M | 11.8M | 278.8M | 121.6 | 8.49% | 0.0618 | 98.73% |
| 4.0s | 250.0M / 500.0M | 355,342 wei | 69.4M | 8.8M | 253.3M | 121.6 | 8.48% | 0.0618 | 98.57% |
| 4.5s | 225.0M / 450.0M | 394,824 wei | 68.5M | 7.3M | 227.9M | 121.5 | 8.44% | 0.0617 | 98.25% |
| 5.0s | 200.0M / 400.0M | 444,177 wei | 67.5M | 6.6M | 202.3M | 121.4 | 8.39% | 0.0616 | 97.73% |
In the floor-adjusted EIP-8368 configuration, the recalibrated CPSB keeps physical state growth close to the 120 GiB/year objective. Under the estimated demand curves, keeping metered state gas near the target then requires a higher base fee. State determines the fee update in an even larger fraction of blocks than in the baseline. Since execution also pays this higher shared fee, despite the higher gas limit with an adjusted floor price under shorter propagation times, the execution gas usage is even lower than in the baseline.
Adjusted floor + EIP-8372: calibrating relative state prices
Recalibrating CPSB under EIP-8368 preserves the physical state-growth associated with the gas target, but does not ensure that execution/data and state demand reach their targets at the same shared base fee. In the preceding benchmark, state reaches the target at a fee that leaves much of the regular-gas capacity unused.
EIP-8372 introduces an additional calibration parameter: the raw state-gas limit can be scaled together with CPSB, while state gas usage is normalized before entering the fee update. This separates the relative price of state creation from the number of state bytes that fill its target.
Let c_0 be the baseline CPSB derived from the common target and the 120 GiB/year state-growth objective. For a scale k>0, the benchmark sets
If a block creates z_t metered state bytes, its raw and normalized state gas are
Scaling CPSB and the raw limit together therefore leaves physical state-byte capacity approximately unchanged. The scale still enters the price of state creation, kc_0b_t, but cancels from its normalized capacity accounting. Within the aggregate demand model, we first find the base fee b_R at which regular gas alone reaches the common target:
Regular gas includes execution and the transaction-floor/data component, so this condition does not imply that execution alone reaches the target.
Let b_S be the state-target-clearing fee before scaling, at k=1. Because modeled state demand depends on kb, choosing k^*=\frac{b_S}{b_R} aligns both normalized branches at the same equilibrium fee b_R.
In the EIP-8368 benchmark, lowering the floor at the longer propagation allocations changes regular-gas demand but leaves the equilibrium base fee unchanged because state remains the bottleneck. This invariance does not generally extend to this EIP-8372 benchmark, where the relative-price scale is calibrated using the regular branch target-clearing fee. We also note that this calibration assumes that changing CPSB leaves the aggregate regular-demand curve unchanged. The table below summarizes the shared equilibrium base fee and the calibrated CPSB under each gas limit.
| Propagation | Common target / limit | Floor price | Baseline CPSB c_0 |
Calibrated CPSB |
Scale k | Shared equilibrium base fee |
|---|---|---|---|---|---|---|
| 3.0s | 267.0M / 534.0M | 96 | 5,446 | 20,538,083 | 3,771.22 | 88.22 wei |
| 3.5s | 275.0M / 550.0M | 82 | 5,610 | 37,466,671 | 6,678.55 | 48.37 wei |
| 4.0s | 250.0M / 500.0M | 64 | 5,100 | 32,147,026 | 6,303.33 | 56.37 wei |
| 4.5s | 225.0M / 450.0M | 50 | 4,590 | 19,653,155 | 4,281.73 | 92.21 wei |
| 5.0s | 200.0M / 400.0M | 40 | 4,080 | 9,512,074 | 2,331.39 | 190.52 wei |
At 3.5-second propagation time, the calibration selects k\approx6{,}679, increasing CPSB from 5,610 to approximately 37.5 million while reducing the shared equilibrium fee from 323,038 wei to 48.37 wei. The large CPSB gas coefficient compensates for the much lower fee, so it does not imply a comparable increase in the ETH price of a state byte at equilibrium.
Simulation results
The calibration substantially improves execution relative to the EIP-8368 benchmark. At the same 3.5-second propagation time, mean execution gas rises from 70.2M to 177.9M gas per block. Across the five allocations, the calibrated mechanism delivers 151.9M–177.9M execution.
| Propagation | Mean execution | Regular target utilization | Normalized state target utilization | State growth (GiB/year) | State as bottleneck | Blocks at limit | Fee variation |
|---|---|---|---|---|---|---|---|
| 3.0s | 166.9M | 89.2% | 73.4% | 88.1 | 27.89% | 4.05% | 0.0522 |
| 3.5s | 177.9M | 88.5% | 71.6% | 86.0 | 26.50% | 3.65% | 0.0502 |
| 4.0s | 174.7M | 89.2% | 71.7% | 86.0 | 25.78% | 3.56% | 0.0504 |
| 4.5s | 165.3M | 90.0% | 72.5% | 87.0 | 25.82% | 3.67% | 0.0515 |
| 5.0s | 151.9M | 90.6% | 73.2% | 87.8 | 25.92% | 3.80% | 0.0528 |
However, matching the two targets in equilibrium does not make both resources remain at target under dynamic demand shocks. Regular gas utilization averages 88.5%–90.6% of the target, while normalized state gas utilization averages 71.6%–73.4% of the target. Realized state growth is approximately 86–88 GiB/year rather than the 120 GiB/year target.
The reason is that the fee update rule responds to the bottleneck resource after state is normalized:
A positive state-demand shock can raise the fee paid by regular activity even when regular usage is below target. Conversely, a regular-demand shock can raise the price of state creation while state usage is below target. The same fee cannot independently adjust the prices of the two branches. For illustration, consider the following fixed-price accounting case:
- In one block, regular usage is 100% of target and state usage is 50%. The mechanism sees 100% target utilization, so it leaves the fee unchanged.
- In another, regular usage is 100% and state usage is 150%. The mechanism sees 150%, so it raises the fee.
State demand averages 100% across two blocks. But the one-dimensional fee mechanism sees an average of 125%, because it responds to the bottleneck resource separately in each block. In other words, the shared base fee responds to the larger normalized resource and cannot independently lower the price of the underutilized resource.
We note that this benchmark is calibrated to the equilibrium, not optimized to maximize average utilization under the simulated workload.
Comparison with EIP-7999
The table summarizes one setting per design family across the five propagation allocations. For each one-dimensional benchmark and the EIP-7999 maximum-throughput design, we select the tested configuration with the highest mean delivered execution. For historically anchored EIP-7999, we select the one with maximum execution among eligible configurations. The one-dimensional central selections are four seconds for baseline and 3.5 seconds for both floor-adjusted benchmarks.
| Design | Configuration | Mean execution | State growth (GiB/year) | Blocks at limit | Mean block fee charge (ETH) |
|---|---|---|---|---|---|
| Baseline | 4.0s, 500M limit | 92.6M | 403.4 | 8.27% | 0.00001927 |
| Floor-adjusted + EIP-8368 | 3.5s, 550M limit | 70.2M | 121.6 | 8.49% | 0.00019206 |
| Floor-adjusted + EIP-8372 | 3.5s, 550M limit | 177.9M | 86.0 | 3.65% | 0.00026769 |
| EIP-7999 historically anchored | 4.0s, E225/D60 | 223.0M | 120.0 | 4.82% | 0.00023807 |
| EIP-7999 maximum-throughput | 4.5s, E300/D90 | 272.6M | 120.0 | 19.53% | 0.00022223 |
Execution gain
EIP-8372 recalibration and normalization recover much of the execution lost under equal-raw-limit state accounting in the one-dimensional mechanisms. EIP-7999 still delivers more execution in the tested central configurations, while encountering hard limits more frequently under the maximum throughput configuration.
Since the selected propagation times and capacity vectors differ, the figure also compares all five configurations at each common propagation time.
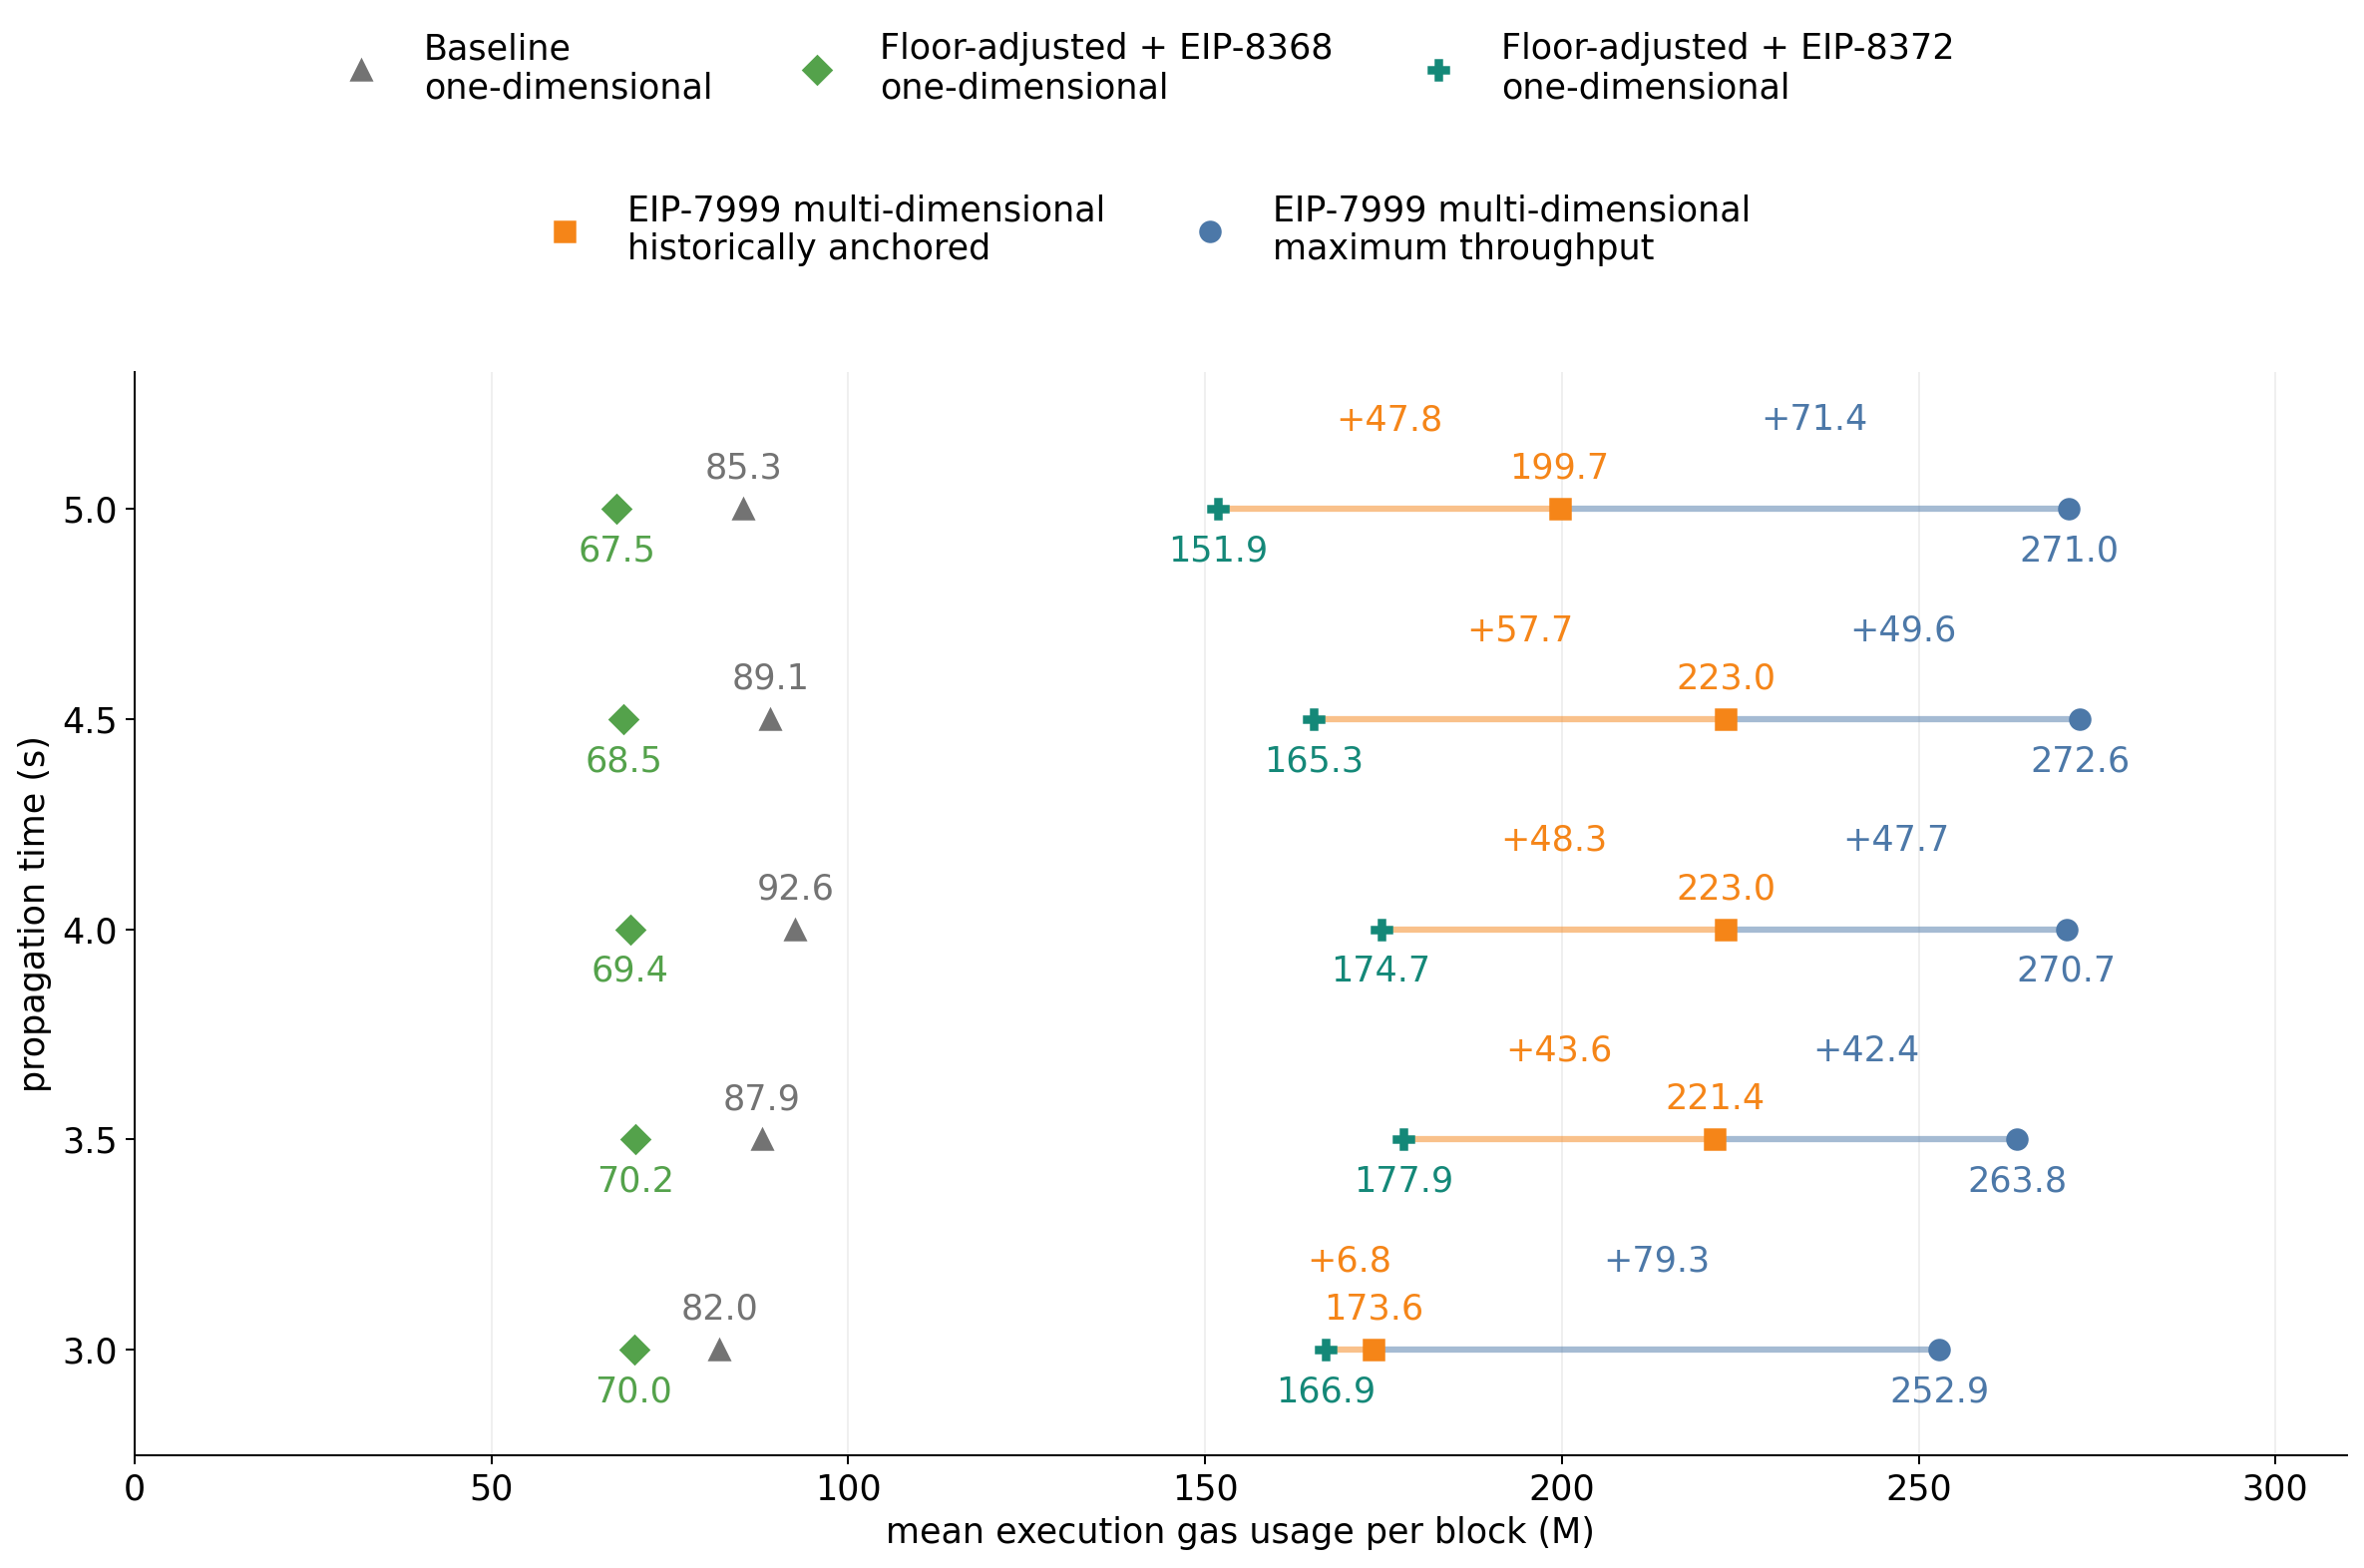
Each point shows mean included metered execution gas per block across the same 32 simulation workload paths. Orange gap labels compare floor-adjusted + EIP-8372 with historically anchored EIP-7999; blue labels show the additional gain from maximum-throughput selection. All numerical labels are in millions of gas per block.
We note that a small relaxation from 20% to 25% on the tolerance of historically anchored restrictions admits a substantially stronger candidate under 3-second propagation time. E200/D45 will be selected instead of E175/D36 and delivers 198.1M mean execution gas, a 31.2M increase from the floor-adjusted + EIP-8372 configuration.
State growth
In the baseline, state usually determines the shared base fee, but CPSB remains calibrated to a 150M limit rather than the selected 500M limit, permitting 403.4 GiB/year of state growth. EIP-8368 recalibrates CPSB and brings state growth to 121.6 GiB/year, slightly above the 120 GiB/year budget with EIP-1559 update rules. EIP-8372 aligns both branches at the equilibrium, but regular gas more often determines the shared base fee under fluctuating demand conditions, leaving regular and normalized state utilization at 88.5% and 71.6% of target. State growth therefore falls to 86.0 GiB/year. Instead, EIP-7999 adjusts the state base fee independently through its excess-gas-based fake-exponential update, keeping growth near 120 GiB/year in these simulations.
Mean fee burn / charge
The fee comparison averages each block’s gas usage multiplied by its applicable base fee, summed across resources. For the one-dimensional mechanisms, regular plus state gas gives a charge proxy because transaction-floor accounting can overcount paid gas.
The baseline has a low charge per block because its unchanged CPSB permits substantial state creation at a relatively low shared fee. EIP-8368 raises the price of state bytes, and the higher shared base fee also increases regular-gas charges. EIP-8372 lowers the equilibrium shared base fee but pairs it with a much larger CPSB. During simulation, the average price paid per state byte reaches 7.62 gwei, compared with 3.17 gwei under EIP-8368, producing a higher charge despite lower state growth. Moving to EIP-7999 supports more execution at very low execution fees, while state fee remains high and accounts for over 99% of the block charge in the selected configurations. Thus, cheaper execution does not translate into a similarly large reduction in the total charge.
Sensitivity to demand assumptions
We investigate how all three one-dimensional configurations respond to alternative elasticity estimates, looking at both metered execution and physical state growth. We then check whether the additional execution throughput from EIP-7999 survives under different elasticity estimates. For EIP-7999 configurations, we maintain the central assumption about BAL allocation \lambda = 0 and state-access intensity \rho_A = 1, because they change the delivered execution only minimally.
| Estimation window | \epsilon_E | \epsilon_D | \epsilon_S |
|---|---|---|---|
| 21 days | 0.117067 | 0.201790 | 0.478438 |
| 35 days | 0.121160 | 0.229476 | 0.334864 |
| 60 days | 0.081668 | 0.204691 | 0.279676 |
| 75 days | 0.078511 | 0.201391 | 0.253556 |
How one-dimensional performance changes
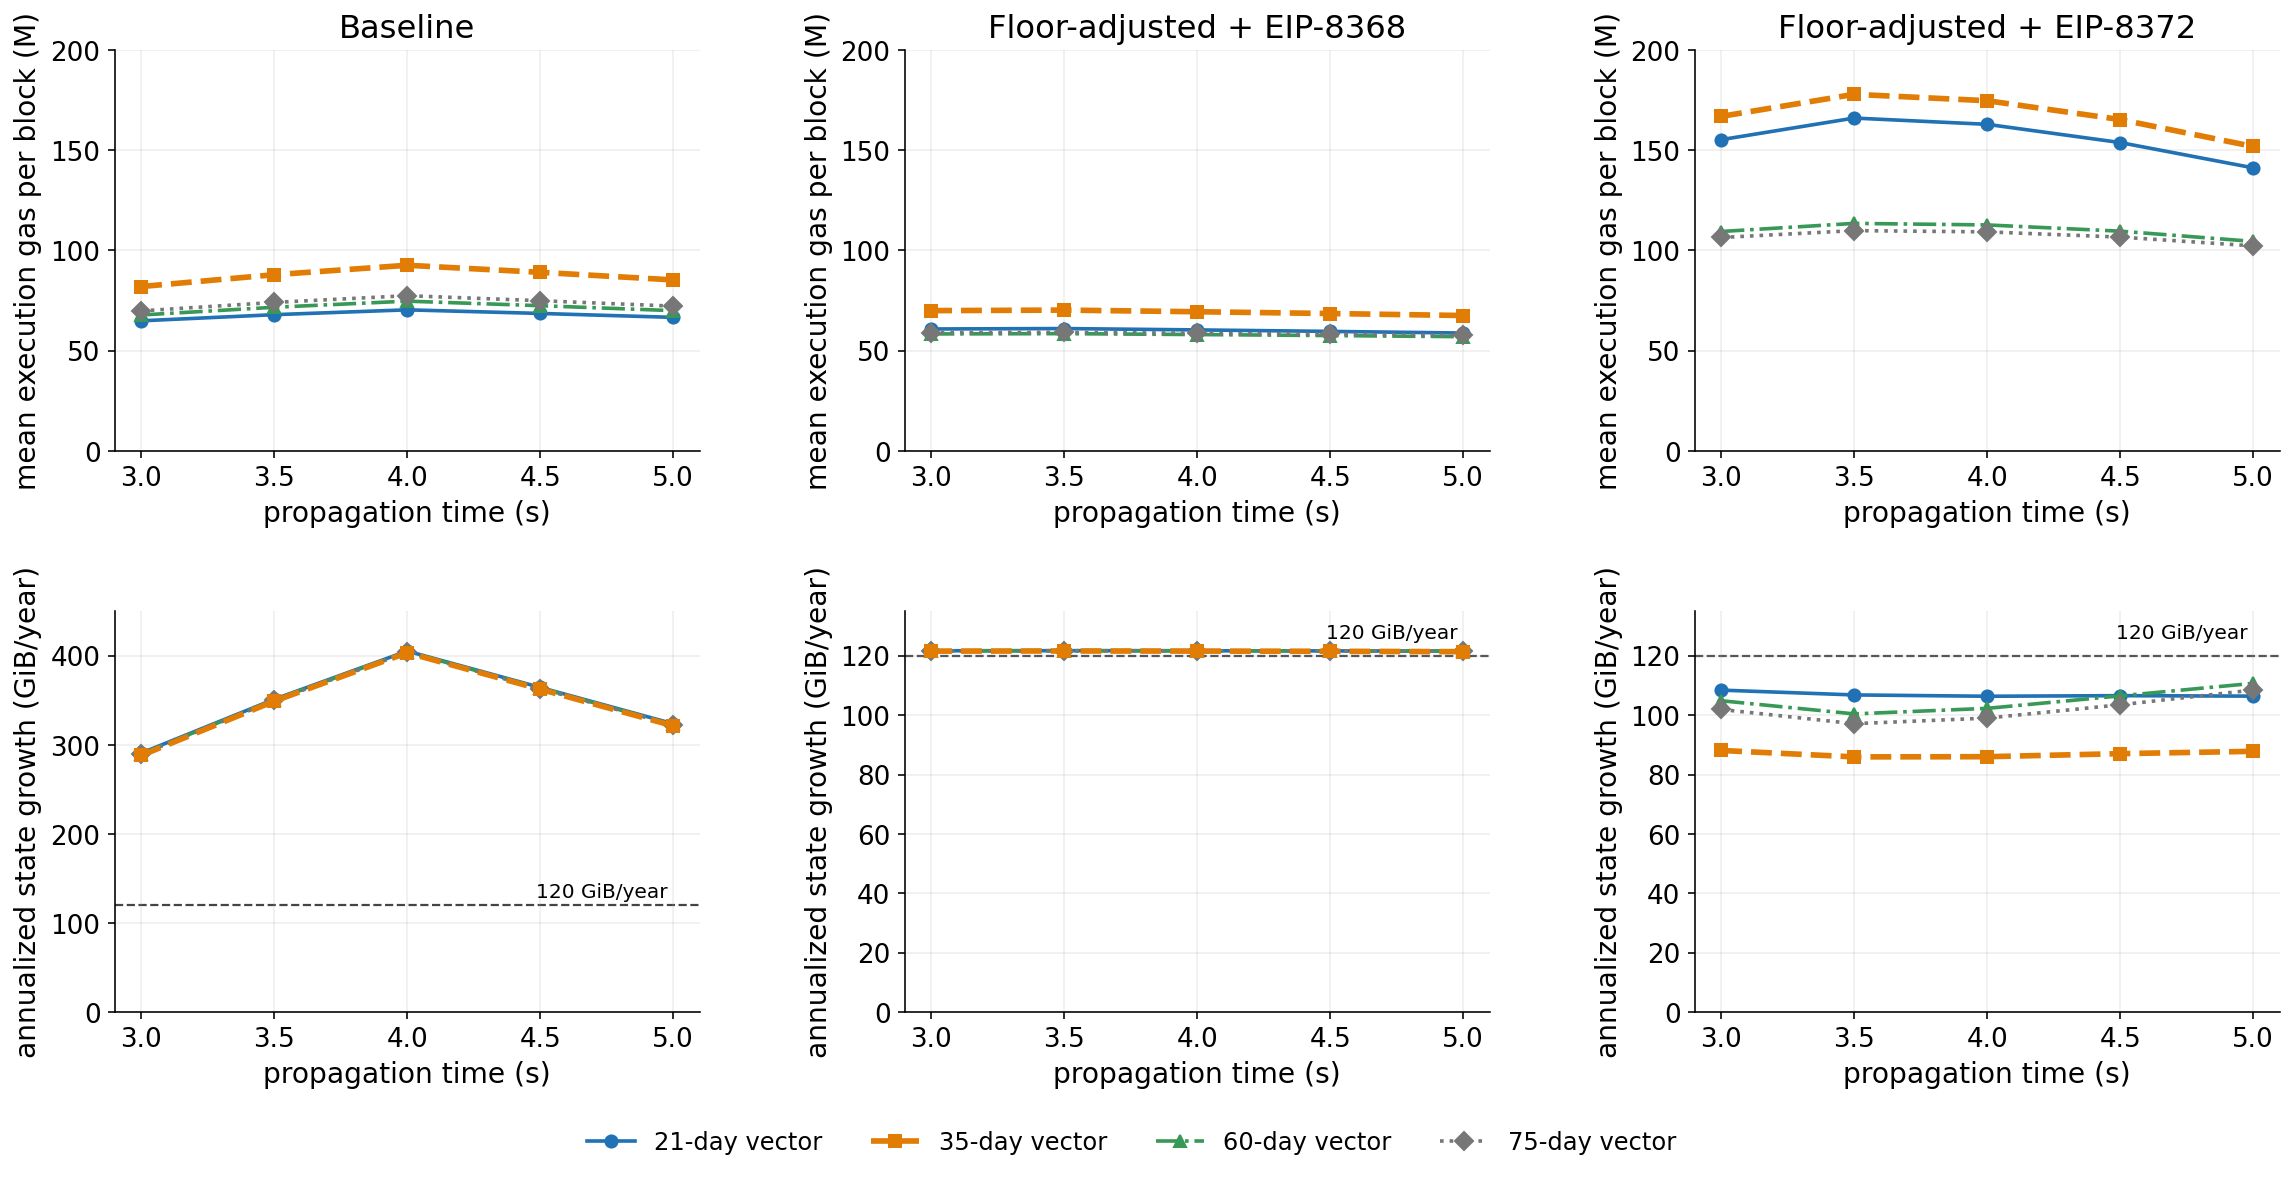
The alternative elasticity vectors preserve the broad pattern across slot-time allocations, but change the level of delivered execution gas. In the baseline and floor-adjusted EIP-8368 benchmarks, state remains the prevailing bottleneck in nearly all the blocks. The shared fee adjusts to sustain state usage near the target, so physical state growth changes little across elasticity vectors at a given configuration. The execution gas depends on both the execution elasticity and the state-demand response that determines the base fee.
EIP-8372-style calibration substantially improves execution under every elasticity vector, but does not preserve the same utilization mix when demand differs from the central estimate. Under the 35-day vector, regular gas drives most updates and normalized state usage averages approximately 72%–73% of target. With the calibrated constants k held fixed, the alternative vectors make state the bottleneck more frequently and increase realized state utilization, while generally reducing execution. This illustrates the limitation of a one-time relative-price calibration under uncertain demand.
Overall, the pattern is robust under different elasticity vectors: state remains the prevailing bottleneck in the baseline and EIP-8368 designs, while EIP-8372 substantially relieves the mismatch. Nevertheless, delivered execution and state utilization depend on the relative level of regular and state demand under the complete elasticity vector.
Robustness of EIP-7999’s throughput advantage
The table summarizes the additional execution relative to one-dimensional floor-adjusted EIP-8372 configurations, with all limits, target pairs, calibration constants, and matched workload paths retaining their central values. The ranges span all five slot-time allocations.
| Elasticity vector | Execution gain from EIP-7999 historically anchored | Execution gain from EIP-7999 maximum-throughput |
|---|---|---|
| 21-day | 19.1M–69.8M | 96.3M–124.6M |
| 35-day | 6.8M–57.7M | 85.9M–119.2M |
| 60-day | 19.9M–44.5M | 26.5M–45.4M |
| 75-day | 18.3M–39.3M | 23.1M–39.8M |
EIP-7999 configurations retain a positive mean execution gain over the one-dimensional floor-adjusted EIP-8372 configuration in all tested elasticity estimates. The gain from EIP-7999 maximum-throughput configuration becomes substantially smaller under the 60-/75-day vectors with lower execution elasticity, showing that separate prices do not eliminate demand uncertainty.
We also note that realized state growth differs: EIP-7999 remains 120 GiB/year on average, while the EIP-8372 one-dimensional benchmark uses less of its state-growth target.
Dependence on the state-demand tail
Under the unrestricted isoelastic demand model, the baseline configuration requires state activity 6.06–8.43 times the historical anchor in equilibrium. Matching CPSB to the physical state growth target requires 2.53 times the anchor in both adjusted benchmarks. These quantities extend well beyond the historical anchor, and the estimated local elasticities do not establish that state demand will keep expanding that far. We test how the execution outcomes change if state demand saturates.
The comparison uses 3-second propagation under the 35-day vector. We cap price-driven state expansion at 1.5 times and 2 times its anchor while retaining the empirical shock, so some blocks can still exceed that quantity. We re-solve equilibria and replay the same simulation paths.
| One-dimensional benchmark | Unrestricted execution | Execution with 1.5\times cap | Execution with 2\times cap |
|---|---|---|---|
| Baseline | 82.0M | 145.9M | 144.9M |
| Floor-adjusted + EIP-8368 | 70.0M | 168.3M | 152.5M |
| Floor-adjusted + EIP-8372 | 166.9M | 173.5M | 169.8M |
The extent to which state constrains execution depends strongly on the assumed state-demand tail, especially for baseline and EIP-8368. With unrestricted demand, state is the bottleneck in most blocks and sustains a shared fee that suppresses the regular branch. The 1.5x and 2x caps remove their state-controlled equilibria, sharply lower the shared base fee, and allow substantially more execution. Thus, the low execution outcomes of these two benchmarks are conditional on state-demand expansion.
Capping state demand produces a smaller additional execution gain under EIP-8372, because the relative-price calibration has already relieved much of the state constraint. Under unrestricted demand, the regular branch already determines the fee in 72.1% of blocks, versus 27.9% for state. Its equilibrium fee stays approximately 88.22 wei with or without the low caps. The minimal execution gain comes from reduced dynamic state pressure.
Limitations
Demand extrapolation and calibration. The elasticity estimates are recovered from historical gas-limit increase events, while the simulated equilibria extend the demand curves to lower prices and higher activity. The baseline requires state activity 6.06–8.43 times its historical anchor, and both adjusted benchmarks require approximately 2.53 times. These results are implications of the maintained isoelastic curves. The elasticity and state-saturation sensitivities test selected alternatives but do not identify the demand tail. EIP-8372’s scaling constants are calibrated to the equilibrium under 35-day elasticity vectors and not optimized for average utilization under the stochastic workload.
Aggregate floor accounting and demand response. The floor-price-specific data multiplier preserves the weighted historical mean of the data/floor contribution, but the simulation does not track each transaction’s floor exposure as activity and prices change. It incorporates the floor adjustment through static-data demand, while omitting additional execution and state responses when BAL-related floor exposure changes a transaction’s total bill. This differs from EIP-7999’s explicit aggregate BAL charge in parent activity prices. The approximation is particularly important at higher floor rates and in the EIP-8372 benchmark, where the regular-demand curve determines the relative-price calibration and drives most fee updates. The concentration of the historical uplift in static-data-heavy transactions supports this approximation. However, its accuracy remains uncertain when prices and the transaction mix change.
Conclusion
In this analysis, we study the post-Glamsterdam one-dimensional fee market under three configurations: baseline, floor-adjusted EIP-8368, and floor-adjusted EIP-8372. We compare their equilibrium and dynamic simulation outcomes with EIP-7999 using the same historical demand anchors and simulated demand shocks.
Under baseline and EIP-8368, state predominantly determines the shared base fee, constraining execution activity. EIP-8368’s CPSB adjustment preserves the intended physical state-growth budget but does not resolve this pricing constraint. EIP-8372 substantially increases execution by calibrating state pricing and normalizing state capacity so that both branches reach their targets in equilibrium. Under varying demand conditions, however, the shared base fee still responds to the bottleneck branch and cannot adjust resource prices independently.
The selected EIP-7999 configurations deliver more execution and operate closer to the state growth target, with different levels of hard-limit operation across the historically anchored and maximum-throughput selections. These results support the multi-dimensional fee mechanism with separate resource prices to reduce cross-resource pricing constraints. Under the demand model and shock patterns calibrated to historical data, the tested EIP-7999 configurations deliver more average execution than the one-dimensional benchmarks.
Appendix: EIP-8372 State Pricing and Deployment Capacity
The large CPSB values in the EIP-8372-calibrated benchmark should be interpreted together with the scaled raw state-gas limit. They change the relative price of state creation without proportionally reducing the amount of state that can fit in a block.
State capacity under normalization
Let c_0 be the state-budget-matched CPSB and k the demand-calibration scale:
A quantity of z metered state bytes consumes the following fraction of state capacity:
Increasing k changes state pricing but preserves the state-byte capacity.
Under the configuration with 3-second propagation time, the calibration is
The equilibrium shared base fee is 88.22 wei.
Using the exact limit of 533{,}959{,}303 gas and the implemented integer percentage scale, the raw state-gas limit is approximately 2.014\times10^{12} gas. The resulting maximum metered state quantity is
For comparison, consider the Glamsterdam configuration with a 200M gas limit, CPSB = 1,530, equal raw limits, and a target-to-limit ratio of 1/2:
| State-capacity measure | 200M / CPSB = 1,530 Glamsterdam |
EIP-8372 Calibrated configuration under 3-second propagation |
|---|---|---|
| Maximum metered state bytes per block | 130,719 | 98,046 |
| State bytes corresponding to the gas target | 65,359 | 49,023 |
| Annualized growth at target | Approximately 160 GiB/year | Approximately 120 GiB/year |
Relative to the Glamsterdam reference, maximum state-byte capacity is approximately 25% lower, so each byte consumes approximately one third more of the available state capacity. This difference comes from reducing the intended annual growth budget from approximately 160 to 120 GiB, not from the additional EIP-8372 demand-calibration scale. The EIP-8368-style configuration with the same state-growth target has approximately the same byte capacity.
Code deployment check
Consider a deployment containing 64 KiB of runtime code, the maximum deployed runtime-code size under EIP-7954 plus the assumed 120-byte account-creation contribution, with no additional state created by the transaction:
Its state-capacity requirement under the calibrated three-second configuration is approximately
The deployment therefore fits within the modeled state-gas budget, although it exceeds the approximately 49,023-byte target.
Relative prices and realized state growth
In the aggregate demand model, a state byte costs cb, while one unit of ordinary execution gas costs b. A larger CPSB makes state more expensive relative to execution, but does not translate into a cost in ETH per state byte.
Under the configuration with 3-second propagation time,
The large gas coefficient is paired with a low equilibrium base fee.
In the simulation, this configuration produces approximately 88.1 GiB/year, corresponding to 73.4% normalized state-target utilization.
Appendix: data charge vs. blob charge
EIP-7999’s data reserve is intended, among other things, to discourage rollups from using calldata instead of blobs. Its activation threshold is 1/12 of the blob base fee. With data metered at 16 gas per byte, the corresponding data price is 4/3 of the blob price per counted byte. This operates through the fee-update rule rather than an instantaneous minimum-price clamp.
In our previous analysis, we omit this reserve because future blob demand and its resulting fee path remain uncertain. The table compares the selected configurations’ equilibrium data charges with the mean blob charge across 1,000 historical blocks, covering approximately 3.3 hours on 29 December 2025.
| Benchmark | Propagation time | Configuration | Gas per counted byte | Equilibrium base fee | Data charge per byte |
|---|---|---|---|---|---|
| Baseline one-dimensional | 3.0s | 359.6M common limit | 64 | 86,981 wei | 5,566,770 wei |
| Floor-adjusted + EIP-8368 | 3.0s | 534.0M common limit | 96 | 332,742 wei | 31,943,270 wei |
| Floor-adjusted + EIP-8372 | 3.0s | 534.0M common limit | 96 | 88.22 wei | 8,469 wei |
| EIP-7999 historically anchored | 4.0s | E225/D60 | 16 | 73.06 wei | 1,169 wei |
| EIP-7999 maximum throughput at 3s | 3.0s | E300/D67.5 | 16 | 46.42 wei | 743 wei |
| Historical blobs: sample mean | — | 1,000 historical blocks | 1 | — | 3,959,687 wei |
For the displayed baseline and EIP-8368 configurations, state-controlled shared fees keep floor-priced calldata more expensive than the sampled mean blob price. EIP-8372 recalibration substantially lowers the shared fee, making calldata much cheaper than this historical reference. The selected EIP-7999 configurations have even lower data charges.
With today’s blob fee, enabling EIP-7999’s reserve would make a below-threshold data fee rise with usage toward the reserve threshold. Because calldata and BAL share the data base fee, this would also increase BAL charges and could constrain BAL-generating execution and state activity.
This identifies a design question for EIP-8372 and EIP-7999: how should execution scaling interact with the relative prices of blobs, calldata, and BAL? Allowing cheaper calldata may attract rollup demand and increase competition for payload capacity. Maintaining a blob-linked reserve discourages that substitution but also raises the cost of BAL-producing activity under EIP-7999. Whether transaction content and BAL should receive the same reserve treatment therefore deserves investigation.