by Fei Wu. This work was partially conducted during my internship at the EF. I thank my mentor @misilva73 for helpful discussions and comments.
Overview
Previously, we have presented our analyses of the equilibrium and dynamic simulation of EIP-7999’s multidimensional fee market, comparison with the post-Glamsterdam one-dimensional fee market. We combine and extend these analyses into a paper: More Meters or More Prices? One- vs. Multi-dimensional Fee Mechanisms on Ethereum.
In the previous post, we studied three one-dimensional benchmarks: the baseline (64-gas-per-byte floor and CPSB = 1530), floor-adjusted + EIP-8368, and floor-adjusted + EIP-8372. The strongest is floor-adjusted + EIP-8372 given the current resource demand, which we call the normalized benchmark in the paper: the transaction floor price is adjusted to each propagation allocation, and EIP-8372 scales CPSB and the state gas limit by a common factor, so that regular gas and state gas reach their targets at the same base fee in equilibrium. It keeps the EIP-1559 target-to-limit ratio of 1/2 and the EIP-1559 update rule. Under block-level demand variation, it delivers 151.9M–177.9M execution gas per block, but regular gas and normalized state gas both stay below their targets on average, giving 86.0–88.1 GiB/year of state growth against the 120 GiB/year target.
In the paper, we push this benchmark further. We first raise its target-to-limit ratio up to 4/5 to see whether it delivers more execution. The EIP-1559 update rule then turns out to be a constraint, because it cannot lower the base fee to the few-wei level that a high target requires. We then replace it with the fake-exponential update of EIP-4844. Finally, we compare these one-dimensional variants with EIP-7999. Throughout, we measure congestion as the share of near-limit blocks, whose gas usage reaches at least 98% of a hard limit. The results presented in this post can be reproduced from this repository.
Main results
-
A higher target ratio for floor-adjusted + EIP-8372 delivers more execution, but contracts state growth and raises congestion. From 1/2 to 4/5, execution rises from 151.9M–177.9M to 199.0M–215.0M, but state growth falls from 86.0–88.1 to 56.7–68.7 GiB/year, and near-limit blocks rise from about 4% to 13.2%–20.6%. Under the EIP-1559 update, the base fee stays at 18–27 wei on average, far above its 2.4–7.2 wei equilibrium, and state, the most price-responsive resource, contracts the most.
-
The EIP-1559 update rule prevents the fee from falling. The EIP-4844-style update allows lower fees and supports more execution/state, but brings more congestion. At a 4/5 ratio, execution rises to 214.8M–244.2M and state growth recovers to 94.0–96.0 GiB/year, but 38.8%–40.8% of blocks are near a limit, and regular gas and state gas both still stay below their targets.
-
EIP-7999 delivers more execution with state growth at its target, at similar or lower congestion. At a similarly low share of near-limit blocks, the conservative EIP-7999 configurations deliver 4%–34% more execution than floor-adjusted + EIP-8372 at 1/2. Against the EIP-4844-style variant, the maximum-throughput configurations deliver 19.5M–56.2M more execution with fewer near-limit blocks.
Raising the target-to-limit ratio
We vary the target-to-limit ratio of floor-adjusted + EIP-8372 over 1/2, 3/5, 2/3, 3/4, and 4/5, keeping the gas limit and floor price of each propagation allocation. At each ratio, we recalibrate CPSB so that state usage at the target still corresponds to 120 GiB/year, and recompute the EIP-8372 scaling factor.
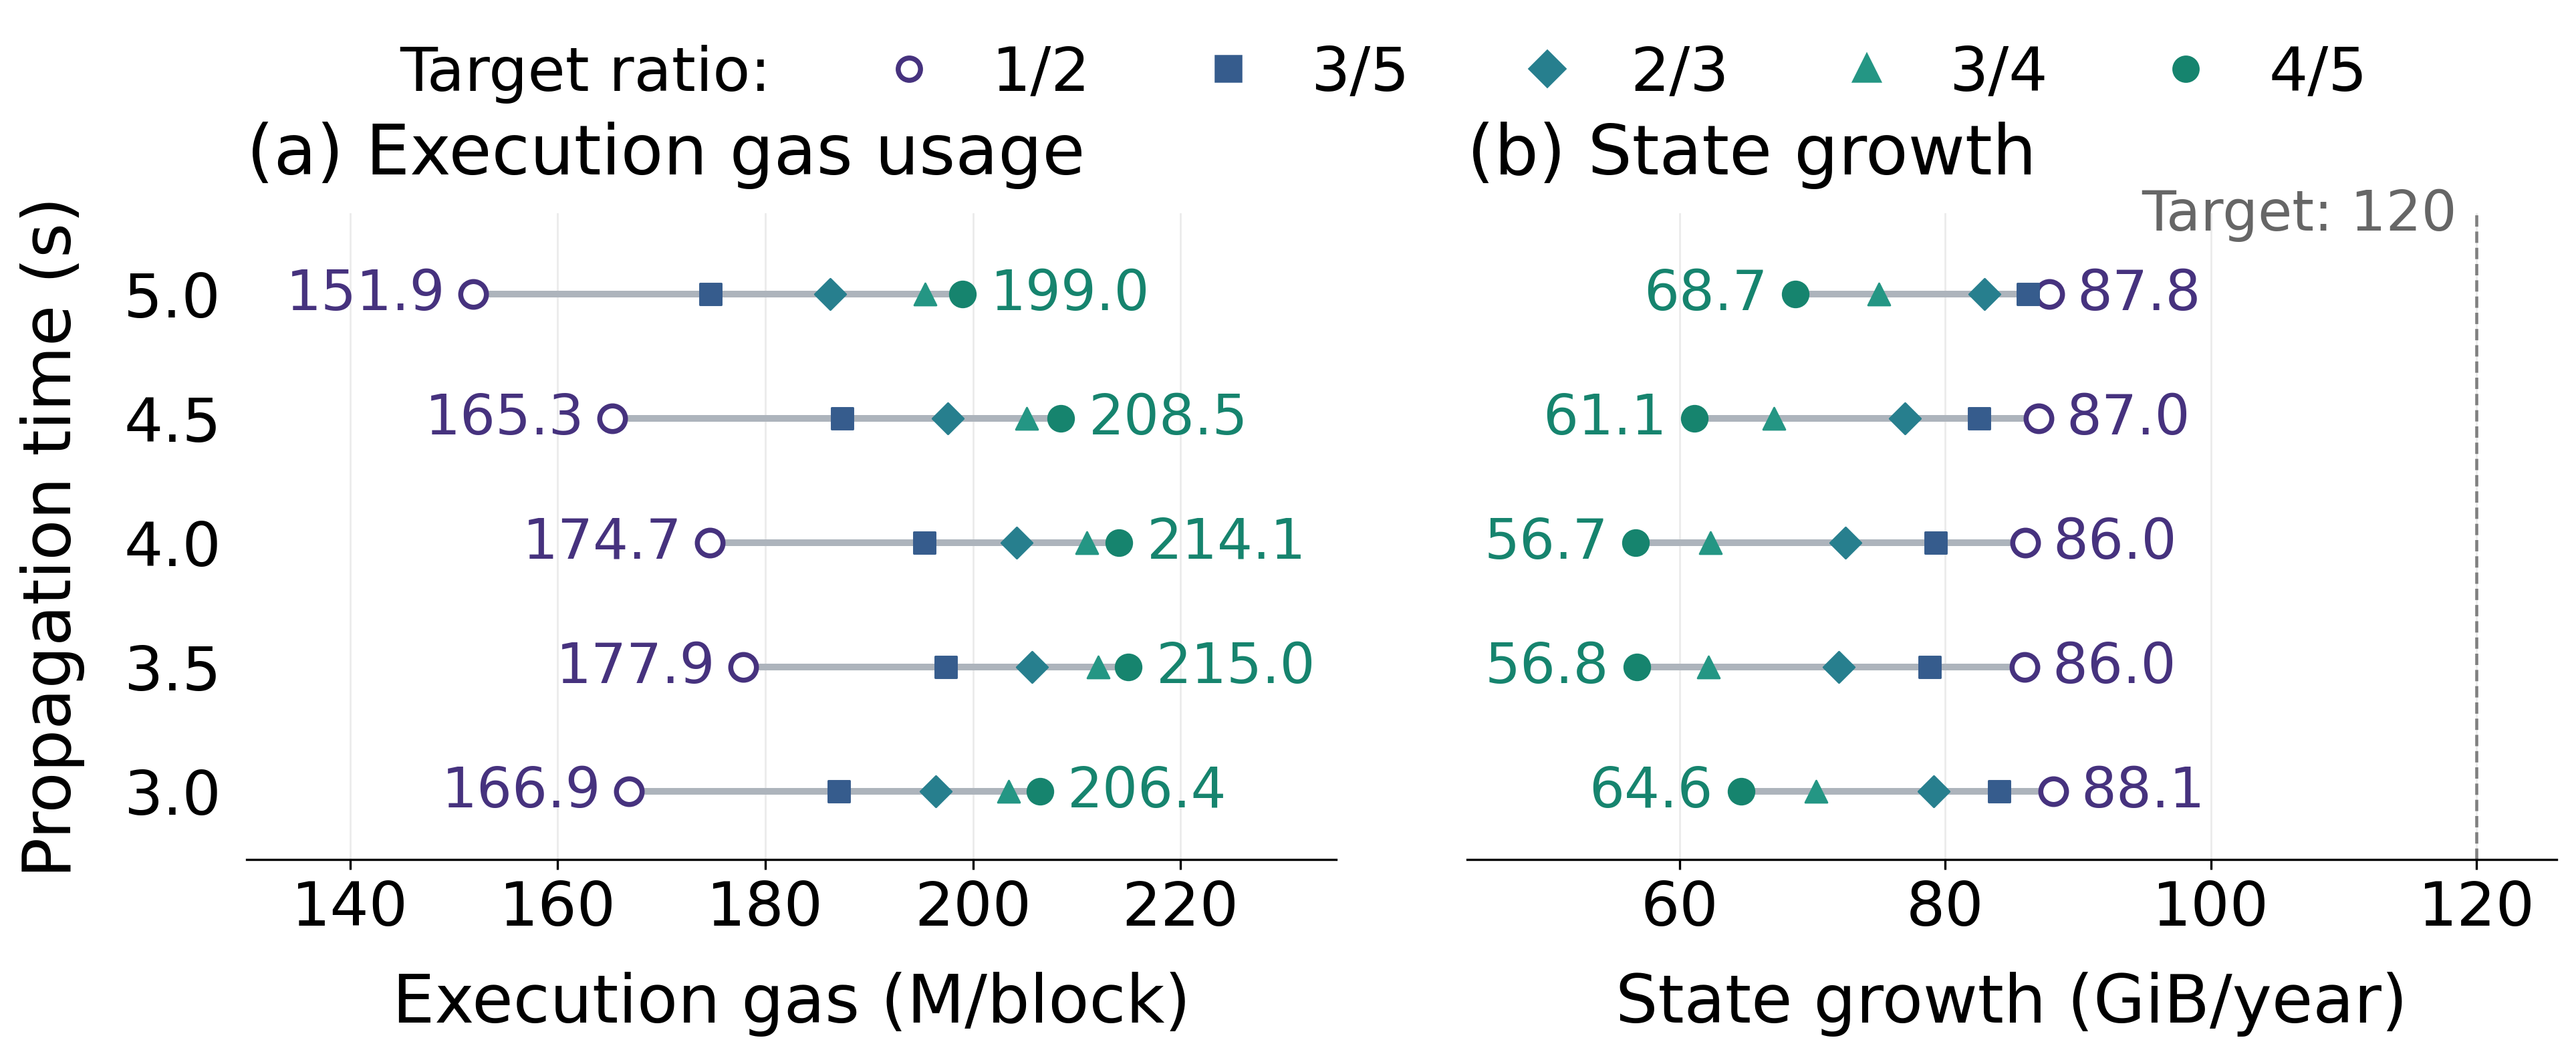
One-dimensional floor-adjusted + EIP-8372 benchmark under the EIP-1559 update, across target-to-limit ratios and propagation allocations. (a) Mean execution gas per block. (b) Annualized state growth, with the dashed line marking the 120 GiB/year target. Each point is the mean over the same 32 simulated demand paths.
Execution rises with the ratio at every allocation, reaching 199.0M–215.0M at 4/5. But state growth moves further away from its target, falling to 56.7–68.7 GiB/year, and blocks become more congested: at 4/5, 13.2%–20.6% of blocks are near a limit, against about 4% at 1/2.
The EIP-1559 update cannot lower the fee to its new equilibrium. A higher target clears at a much lower fee: at 4/5, the base fee at which both branches reach their targets is only 2.4–7.2 wei. Under EIP-1559, a block below the target lowers the base fee by
where G_t is the gas usage of the larger branch. This decrease rounds to zero unless the block falls short of the target by at least 8/b_t of it. Once the fee is below 8 wei, no block can lower it, while every block above the target raises it by at least 1 wei. In the simulations, the fee never falls below 8 wei and averages 18.3–27.2 wei, about four to eight times its equilibrium value. In equilibrium, the 4/5 design would deliver 245M–280M of execution; in simulation, it delivers 199.0M–215.0M.
A fee above equilibrium contracts every resource, but state the most, because state is the most price-responsive resource. A higher ratio also lowers the per-block state byte limit relative to the target, from twice the target at 1/2 to 1.25 times at 4/5, which clips bursts of state creation.
Replacing the EIP-1559 update with an EIP-4844-style update
To let the fee reach these low levels, we replace the EIP-1559 update of floor-adjusted + EIP-8372 at a 4/5 ratio with the persistent excess-gas counter and fake exponential of EIP-4844, keeping the configurations and demand paths fixed:
The counter keeps the small shortfalls that EIP-1559 rounds away, and the denominator 8T_G matches the response of EIP-1559. The table compares the two update rules at a 4/5 ratio. Each cell shows the EIP-1559 result followed by the EIP-4844-style result.
| Propagation | Execution (M) | State growth (GiB/year) | Near-limit blocks | Mean base fee (wei) |
|---|---|---|---|---|
| 3.0s | 206.4 → 225.9 | 64.6 → 96.0 | 17.7% → 40.8% | 22.3 → 6.6 |
| 3.5s | 215.0 → 244.2 | 56.8 → 94.0 | 13.2% → 39.1% | 18.3 → 3.6 |
| 4.0s | 214.1 → 243.6 | 56.7 → 94.0 | 13.4% → 38.8% | 18.8 → 3.7 |
| 4.5s | 208.5 → 232.5 | 61.1 → 95.2 | 16.0% → 39.6% | 21.5 → 5.4 |
| 5.0s | 199.0 → 214.8 | 68.7 → 95.6 | 20.6% → 39.9% | 27.2 → 10.5 |
With the EIP-4844-style update, the fee gets close to its equilibrium, so execution and state growth both recover. Two problems remain.
Congestion rises sharply. At a 4/5 ratio, the limit is only 1.25 times the target. With a lower fee, demand bursts reach the limit far more often, and 38.8%–40.8% of blocks are near a limit.
Both branches still stay below their targets. Regular gas averages 85.8%–87.1% of the target and normalized state gas 78.3%–80.0%. The fee follows the larger of the two branches in each block, which now averages 98.8%–100.0% of the target, so whenever one branch is above target, the other pays the higher fee as well. One fee can keep the larger branch on target, but not both. At a 1/2 ratio, the same change of update rule makes almost no difference (execution changes by less than 1.5M), because the fee there is 48–191 wei and rounding rarely matters.
Comparison with EIP-7999
We compare these one-dimensional variants with the two EIP-7999 selected configurations mentioned in the previous post, chosen from the tested execution and data targets at each propagation allocation:
- Conservative: the highest-execution configuration inside the execution–data frontier, so that its equilibrium execution fee is above 1 wei, and whose share of near-limit blocks does not exceed the historical 4.73% (860,505 mainnet blocks from February to May 2026).
- Maximum throughput: the configuration with the highest mean execution.
The conservative rule is stricter than the “historically anchored” rule of the previous posts, which allowed 20% more near-limit blocks than the historical share, so some selections and numbers differ slightly.
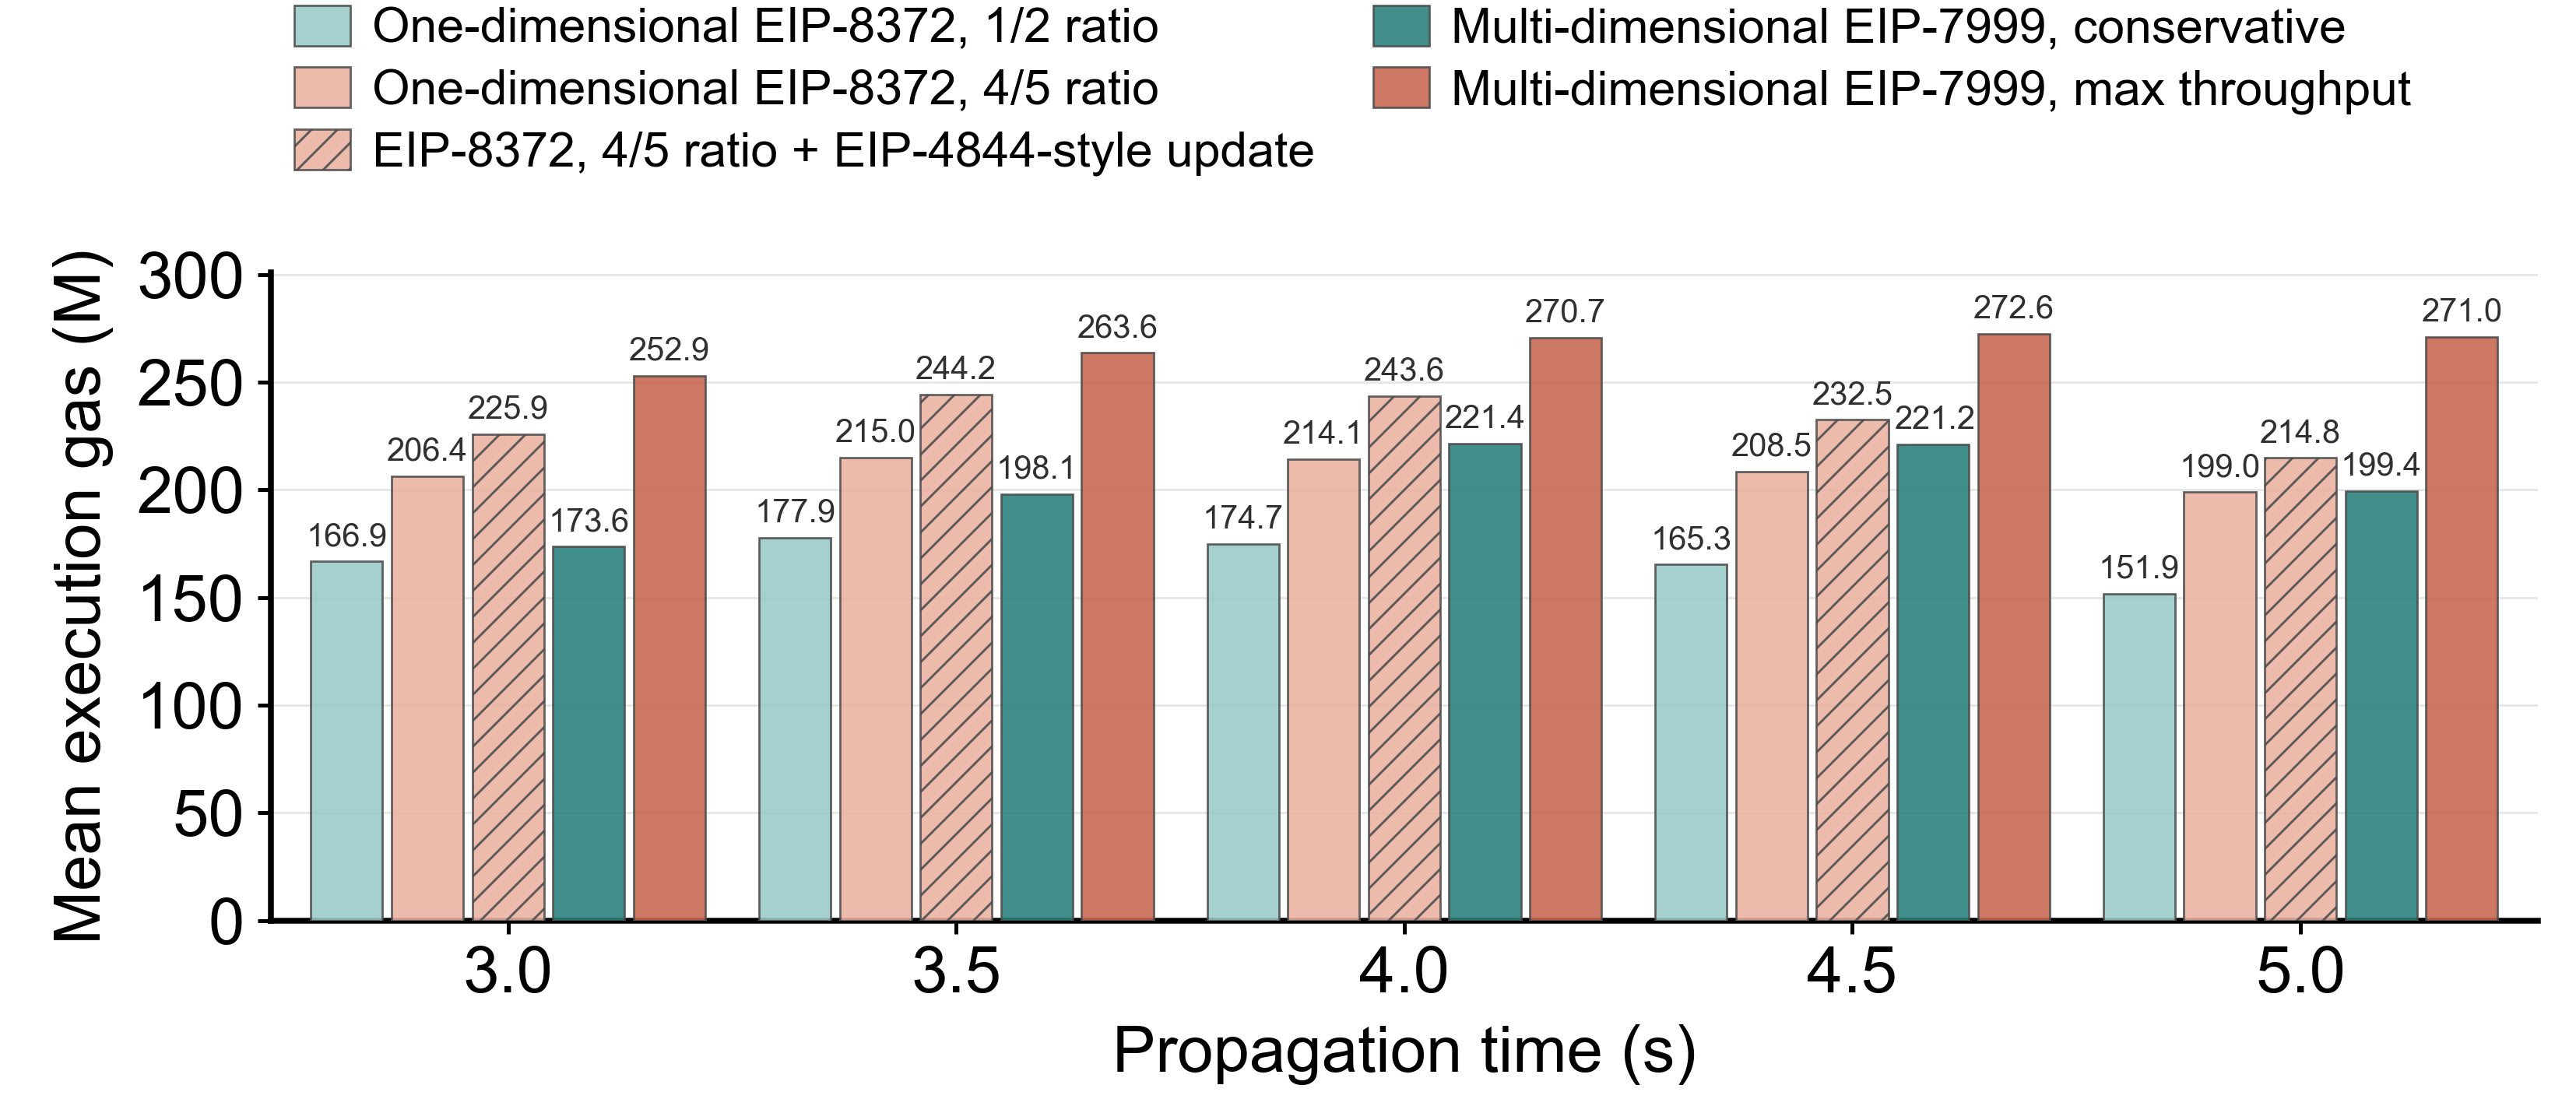
Mean execution gas per block of the one-dimensional floor-adjusted + EIP-8372 benchmark (“One-dimensional EIP-8372”) at target-to-limit ratios of 1/2 and 4/5, and of the two EIP-7999 selections, under the same 32 demand paths. Labels are in millions of gas per block.
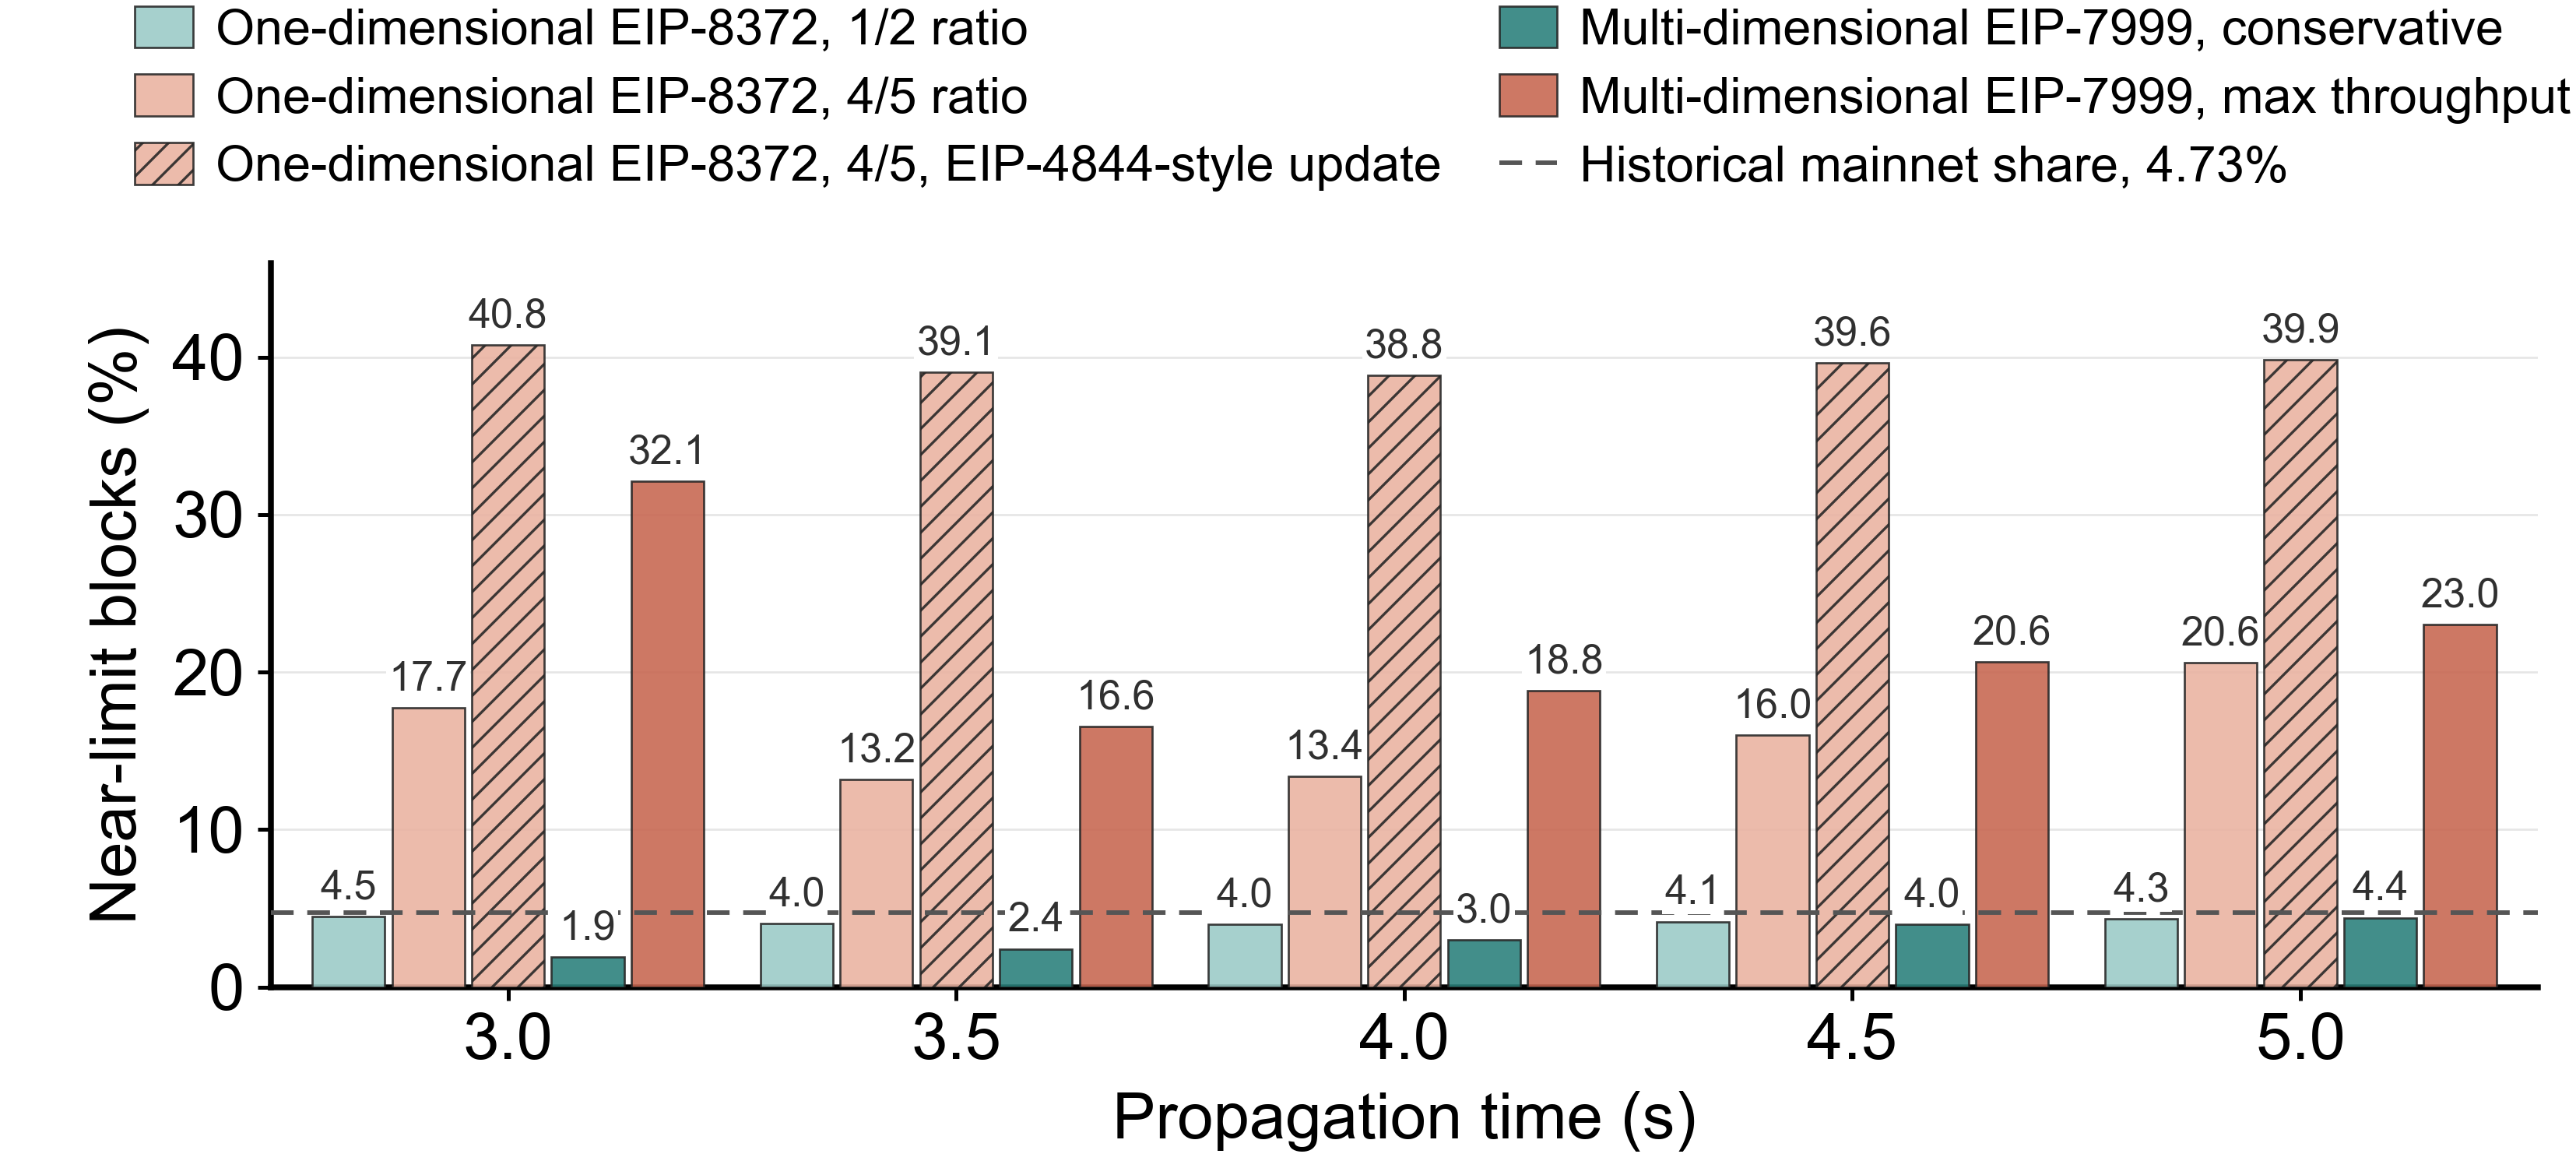
Share of near-limit blocks, whose gas usage reaches at least 98% of a hard limit, for the same designs and the EIP-4844-style variant of floor-adjusted + EIP-8372 at 4/5. The dashed line marks the historical share of 4.73% on mainnet from February to May 2026.
EIP-7999 keeps state growth at its 120 GiB/year target in every configuration, while the floor-adjusted + EIP-8372 variants deliver 56.7–96.0 GiB/year.
At similarly low congestion, EIP-7999 delivers 4%–34% more execution. The conservative configurations and floor-adjusted + EIP-8372 at 1/2 have 1.9%–4.4% and 4.0%–4.5% of blocks near a limit, both close to or below the historical share. The conservative configurations deliver 6.8M–56.0M more execution at every allocation.
A higher one-dimensional target ratio closes part of the execution gap only by raising congestion. At 4/5, floor-adjusted + EIP-8372 exceeds the conservative configurations by 32.8M at 3 seconds and 17.0M at 3.5 seconds and falls behind at longer allocations, but with 13.2%–20.6% of blocks near a limit, against 1.9%–4.4%.
At higher congestion, EIP-7999 still delivers more. The maximum-throughput configurations deliver 46.5M–72.0M more execution than floor-adjusted + EIP-8372 at 4/5, with somewhat more near-limit blocks (16.6%–32.1% against 13.2%–20.6%). Against the EIP-4844-style variant, they deliver 19.5M–56.2M more execution with fewer near-limit blocks (16.6%–32.1% against 38.8%–40.8%).
More generally, we checked every one-dimensional run we simulated: the baseline and floor-adjusted + EIP-8368 benchmarks of the previous post, floor-adjusted + EIP-8372 at the five target ratios, and its EIP-4844-style variant, each at five propagation allocations. For each run, at least one tested EIP-7999 configuration at the same allocation, inside the execution–data frontier, delivers more execution, keeps state growth at its target, and has no larger share of blocks at a hard limit. The smallest such margin is 6.8M, for floor-adjusted + EIP-8372 at 1/2 and 3 seconds.
Limitations
Demand calibration. The results are conditional on the demand model calibrated from the February and July 2025 gas-limit increases, and the tested execution targets extend well beyond observed demand. In the paper, we test robustness to elasticities estimated from 21-, 60-, and 75-day windows around these increases. Under every calibration, state still sets the shared base fee in the baseline and floor-adjusted + EIP-8368 benchmarks, and EIP-7999, with its targets reselected for each calibration, still delivers more execution than floor-adjusted + EIP-8372 and its EIP-4844-style variant. The size of the gain depends on the calibration and is generally smaller when execution demand is less price-responsive.
Tested variants only. We tested the one-dimensional variants described here, not every possible design. The paper also shows that a one-time EIP-8372 calibration no longer aligns the two branches when demand differs from the calibration, and we did not test a mechanism that recalibrates the scaling factor as demand changes.
Conclusion
Raising the target ratio and improving the update rule both help the one-dimensional mechanism, but each brings a new cost. Under the EIP-1559 update, a higher target ratio cuts state growth and raises congestion. The EIP-4844-style update recovers state growth only by letting far more blocks reach the limit. Because the one single base fee follows the bottleneck resource, neither change keeps both near their targets. Under the calibrated demand model, EIP-7999 delivers more execution with state growth at its target, at similar or lower congestion, which supports moving from separate metering to separate pricing as Ethereum scales.