Edit: The updating mechanics became corrupted in the old post so it was suggested to me to repost the text. This new version is significantly revised. In a conversation with Justin Drake he raised an interesting question. What happens to the equilibrium if the starting conditions are 2^{20} validators and b = 0.05, i.e. if the conditions are set such that even at 100 % staking, the yearly issuance cannot exceed the yearly burn? This was not accounted for and is a special case of the model for how the deposit ratio and burn rate relate to the circulating supply from a later section, but setting d = 1. I have moved the equation earlier in the text to cover this case. Furthermore I have extended the modeling (new Section 4 and 5), edited the text for content and added figures to illustrate the current policy. Modeling and visualization of the circulating supply equilibrium under current policy is now the main focus of the text.
Hello. I’m a researcher from another field (mainly machine learning) and find blockchain tech very interesting. I have been following Ethereum for a while and appreciate the ethos of openness. The effects of a deflationary Ethereum, and the potential equilibrium for the circulating supply, seem to me like relevant topics to explore. Feel free to correct things I may have gotten wrong.
Abstract
This text explores potential equilibria for the circulating supply of Ethereum. The equality where yearly issuance equals yearly burn is used to create an equation for how the equilibrium depends on burn rate and deposit size. Other relationships are also presented, such as how staking yield relates to deposit size, the impact of potential active validator caps, as well as how both the equilibrium and the deposit ratio can be derived from yield and burn rate. The equations are then extended to account for assumptions for how the burn rate will be constrained by increasing deposit sizes and how the demand for yield changes across deposit ratio. The relationships are plotted across reasonable assumptions concerning variable values. A base case of around 2.5 % burn rate and stabilized demand for staking at 3 % yield are positioned within the plots; it gives equilibria between 27.3-49.5 million ETH depending on model. The text concludes by discussing if a minimum viable issuance policy, sustained by an adaptive base reward factor, could be beneficial for Ethereum. Such a policy could lead to perpetual deflation.
1. Introduction
With the introduction of EIP-1559, a deflationary mechanism has been added to Ethereum, burning base fees. This mechanism counteracts the inflation from ETH issued for securing the network. From a “monetary policy” perspective, it could be good to estimate the equilibrium for the circulating supply under current circumstances, and to make some projections for different equilibria under various assumptions (see the active validator cap proposal, and other discussions that are connected to, or implicitly depend on, estimates of the future circulating supply). The purpose of the text is to provide insights into how different variables in the ecosystem relate to each other and how they affect the equilibrium of the circulating supply. Independently, the larger question of minimum viable issuance under proof of stake is also discussed towards the end of the text. Here input from the community would be needed to highlight potential drawbacks and benefits of such a policy.
Section 2 briefly reviews the current burn rate and proof-of-stake issuance. In Section 3, the basic equation for the circulating supply equilibrium is stipulated and then extended to account for corner cases and active validator caps. The connection between staking yield and deposit size is also examined. Section 4 introduces a constrained burn-rate model that expects a reduced burn rate with an increase in staking. Section 5 investigates the relationship between burn rate, yield, and deposit ratio at the equilibrium. An adaptive yield demand curve is also introduced to account for how the demand for staking yield may vary across deposit ratio. This section also relates the deposit ratio to minimum viable issuance in the proof-of-stake era, something that is further examined in Section 6 where a variable base reward factor is shown to facilitate such an issuance policy. This could create perpetual deflation. Some benefits and drawbacks of such a policy are offered and conclusions are provided in Section 7.
2. Current statistics
Since its inception, EIP-1559 has burned close to 8 000 ETH/day. This corresponds to a yearly burn B of around 2.9 million ETH. Given the current circulating supply S \approx 117.4 million ETH (as of September 2021), the burn rate is given as b = B/S \approx 0.025. Thus, around 2.5 % of the circulating supply is burned each year at the current burn rate.
The current deposit size D for the staking contract is around 7.5 million ETH. The yearly issuance I of ether to validators under proof of stake can be computed from the deposit size and the base reward factor F as
I = cF \sqrt{D}
where c is a constant c \approx 2.6 derived from the number of epochs in each year and compensating for the fact that the protocol denominates ether in gwei. The base reward factor F is controlled by the developers and is set to 64. Since it determines issuance, and thus how high rewards are for staking, it can be used to control staking demand in Ethereum, as discussed in Section 6. Inserting these numbers into the equation gives a yearly issuance of around 455 000 ETH.
3. Equilibrium under current policy and with an active validator cap
3.1 Equilibrium as a function of deposit size and burn rate
The yearly burned ether B can be modeled as a burn rate b of the circulating supply S,
B = bS,
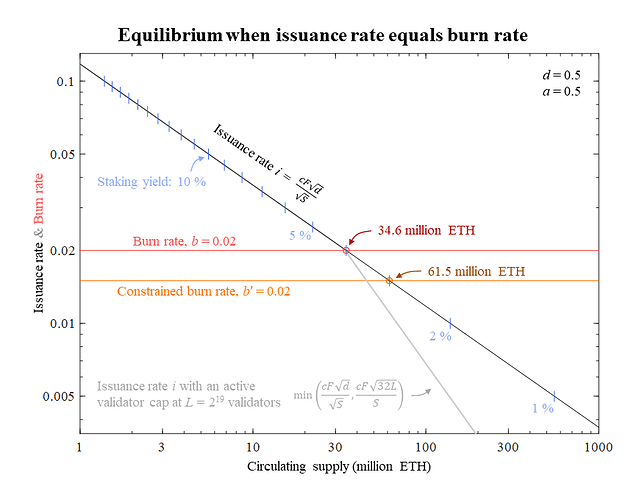
The equilibrium when I = B gives
cF \sqrt{D} = bS,
which means that the circulating supply at the equilibrium will be
S = \frac{cF \sqrt{D}}{b}.
3.2 Equilibrium with burn rate higher than issuance at 100 % staking
What happens if the initial conditions are set such that even at 100 % staking, the yearly issuance does not exceed the yearly burn? This example is somewhat academic since it is hard to envision a lively transacting chain at close to 100 % staking (as further discussed in the following sections). But it should be modeled for completeness, and it also points to a need for exploring alternative models of the burn rate, which is done in Section 4.
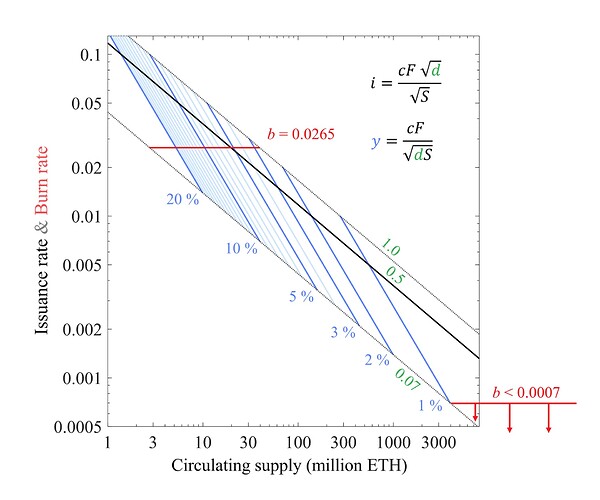
The remainder of this section resolves the case when 100 % staking issuance is lower than the burn. This happens when
bD > cF \sqrt{D},
i.e., when D = S and the yearly burn B = bD, specified at a deposit size corresponding to the circulating supply is bigger than the issuance I = cF \sqrt{D} at the same deposit size. To understand why S can be replaced by D in the equation, consider that D can never be larger than S, which means that bD can never be larger than bS. If the yearly burn bD is larger than issuance, then certainly so is the yearly burn specified as bS. The inequality can be simplified
b^2D^2 > c^2F^2D,
to derive the condition for when the burn rate is bigger than the issuance at 100 % staking,
D > \frac{c^2F^2}{b^2}.
The deposit size will in this case shrink each year until the equilibrium is achieved, which happens when
D = \frac{c^2F^2}{b^2},
which provides us with the equation for the ultimate circulating supply when the inequality is true
S = \frac{c^2F^2}{b^2}.
The equilibrium is in this case thus reached independently of the initial deposit size. Combining the findings, the complete equation is:
S = \left\{ \begin{array}{ c l } \frac{c^2F^2}{b^2} & \quad \textrm{if } D > \frac{c^2F^2}{b^2} \\ \frac{cF \sqrt{D}}{b} & \quad \textrm{otherwise} \end{array} \right..
3.3 Equilibrium relative to staking yield and burn rate
To produce a base case for a potential equilibrium using the proposed model, it is necessary to estimate variables b and D. Since a rather wide range of variable values is reasonable, the plots of this and the following sections show the equilibrium across wide ranges, so that the reader can draw their own conclusions. Still a specific “base case” can help. The current approximate burn rate of 0.025 can be used. To define a reasonable D it is instead best to first estimate the yield y around which staking demand and thereby the deposit size D will stabilize. The issuance can be described as I = yD as well as I = cF \sqrt{D}; the equality can be used to derive how D depends on yield:
yD = cF \sqrt{D},
y^2D^2 = c^2F^2D,
D = \frac{c^2F^2}{y^2}.
The yield at which staking demand stabilize could for example be set to 3 % in the base case. This would give a deposit size of
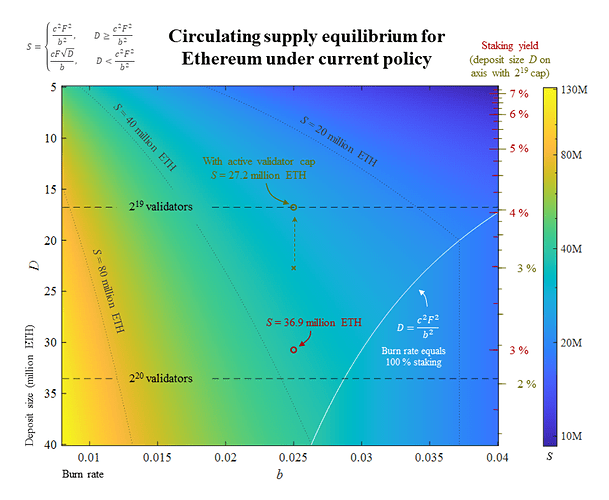
D = \frac{c^2F^2}{y^2} = \frac{2.6^2 \times 64^2}{0.03^2} \approx 30.7 million ETH.
Such a deposit size gives an equilibrium of
S = \frac{cF \sqrt{D}}{b} = \frac{2.6 \times 64 \sqrt{30.7 \times 10^6}}{0.025} \approx 36.9 million ETH.
The complete equation for how the equilibrium depends on burn rate and stabilized staking yield can also be derived. It is:
S = \frac{cF \sqrt{\frac{c^2F^2}{y^2}}}{b},
S = \frac{c^2F^2 }{yb}.
3.3.1 Introducing an active validator cap
If an active validator cap is applied and reached, the relationship between yield and deposit size changes, and the equilibrium also becomes independent of deposit size (note that with the constrained burn-rate model introduced in Section 4, this is no longer true, because that model assumes that increased staking will push down the burn rate). Setting the cap at L validators, the yearly issuance can be defined as cF \sqrt{32L}, and the deposit size at the equilibrium when the yield stabilizes can be derived directly from
yD = cF \sqrt{32L}
as
D = \frac{cF \sqrt{32L}}y.
At a 3 % yield, when setting the active validator cap to 2^{19} validators, the deposit size for the base case would be
D = \frac{2.6\times64\sqrt{32\times2^{19}}}{0.03} \approx 22.7 million ETH.
However, since issuance is fixed when the cap is reached, the equilibrium for the base case is derived independently of D as
S = \frac{cF \sqrt{32L}}{b} = \frac{2.6 \times 64 \sqrt{32 \times 2^{19}}}{0.025} \approx 27.3 million ETH.
3.4 Illustrating the equilibrium
Figure 1 shows how the equilibrium varies with deposit size, staking yield (with or without an active validator cap) and burn rate. The figure is generated by using the equations developed in this section and the base cases are indicated with circles. Note that the circulating supply is computed without an applied active validator cap, which would bound the circulating supply S above it in the figure, independent of the deposit size.
Figure 1. The circulating supply Equilibrium for Ethereum under current policy, plotted against the deposit size D (left y-axis), yield (right y-axis) and burn rate b = B/S (x-axis). Dashed lines indicate potential active validator caps which, if applied, would bound the circulating supply S above the line. They are assumed to not be applied in this figure, except for beige annotations. Among these, the yield with an active cap (beige) is positioned relative to D but the corresponding equilibrium for S can be found at the actual cap (indicated by dashed beige arrow). Thin dotted lines indicate the circulating supply at 20, 40, and 80 million ETH (note that S is log-scaled). Plotted in white is the limit at which burned ether equals issuance from 100 % staking. This line is unlikely to be reached since the burn rate can be expected to fall at very high staking ratios. The circled base cases indicate circulating supply equilibria for a 2.5 % burn rate and 3 % yield with (beige) or without (red) an active validator cap at 2^{19} validators. Vector graphics for the figure: Equilibrium under Current Policy.pdf (125.3 KB)
4. Equilibrium under current policy with a constrained burn rate
4.1 Without an active validator cap
As mentioned in the previous Section 3, there is reason to consider a modification of the definition of the burn rate. When the deposit ratio is high, the burn rate as a proportion of the total circulating supply can be expected to fall. In this scenario, holders prefer to stake their ether over using it transacting on-chain. To account for this, in order to better model how present burn rates translate to future burn rates, the constrained burn rate b' can instead be defined as
b' = \frac{B}{S-aD},
with reduced burning of staked ether. The more ether that is staked, the less is burned. The variable a determines the proportion of staked ether to be unaccounted for when computing the constrained burn rate. The circulating supply equilibrium under a constrained burn rate is given by inserting the redefined yearly burn b'(S-aD) into the equality of yearly issuance and burn:
b'(S-aD) = cF \sqrt{D},
S = \frac{cF \sqrt{D}}{b'} + aD.
The circulating supply when the yearly burn is higher than yearly issuance at full staking can be determined in a similar way as in Section 3.2. The inequality for higher burn than issuance at S = D is
b'(D-aD) > cF\sqrt{D},
which can be resolved to
D^2(1-a)^2 > \frac{c^2F^2D}{b'^2},
D > \frac{c^2F^2}{b'^2(1-a)^2}.
The deposit size will in this case shrink each year until the equilibrium when
D = \frac{c^2F^2}{b'^2(1-a)^2},
and thereby
S = \frac{c^2F^2}{b'^2(1-a)^2}.
The equation for the circulating supply with a constrained burn rate model can thus be derived as
S = \left\{ \begin{array}{ c l } \frac{c^2F^2}{b'^2(1-a)^2} & \quad \textrm{if } a \neq 1 \textrm{ and } D > \frac{c^2F^2}{b'^2(1-a)^2} \\ \frac{cF \sqrt{D}}{b'} + aD & \quad \textrm{otherwise} \end{array} \right..
If a is set to 1, only the non-staked ether is included when computing the burn rate. However, such a strong assumption is likely incorrect. At very high deposit ratios, participants in the ecosystem are likely using derivatives of staked ether (e.g., stETH) for many use cases, converting to ETH specifically for paying transaction fees. So while a = 0 (the definition used in Section 3) may overestimate the burn when projecting current burn rates to scenarios with a higher deposit ratio, a = 1 (only non-staked ether is included when modeling burn rate) may instead underestimate the burn. Setting a = 0.5 seems like a reasonable compromise at this point.
It is now possible to compute the equilibrium for the base case. The constrained burn rate is b' = B/(S-aD) \approx 0.027 when using current statistics. Stabilized staking demand at 3 % yield gives a deposit size of 30.7 million ETH, as computed in Section 3.3. The equilibrium is thus
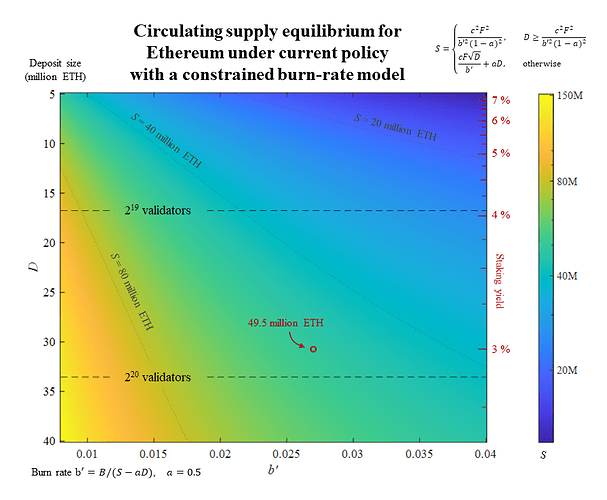
S = \frac{cF \sqrt{D}}{b'} + aD = \frac{2.6 \times 64 \sqrt{30.7 \times 10^6}}{0.027} + 0.5 \times 30.7 \times 10^6 \approx 49.5 million ETH.
Figure 2 shows how the circulating supply equilibrium varies with D and b', using a = 0.5. Note that the condition where the burn rate equals 100 % staking (white line in Figure 1) is outside of the boundaries of this figure. With a constrained burn rate of 0.04 (the right edge of the x-axis), the condition is only met at
D = \frac{c^2F^2}{b'^2(1-a)^2} = \frac{2.6^2 \times 64^2}{0.04^2(1-0.5)^2} \approx 69.2 million ETH,
or conversely with a 40 million deposit size, at a constrained burn rate of
b' = \frac{cF}{\sqrt{D}(1-a)} = \frac{2.6 \times 64}{\sqrt{40 \times 10^6}(1-0.5)} \approx 0.053.
Figure 2. The circulating supply Equilibrium for Ethereum under current policy using a constrained burn-rate model, plotted against the deposit size D (left y-axis), staking yield (red, right y-axis) and constrained burn rate b’ (x-axis). Dashed lines indicate potential active validator caps which are not applied. Thin dotted lines indicate the circulating supply at 20, 40, and 80 million ETH (note that S is log-scaled in the figure). The red circle indicates the base case with b’ = 0.027 and stabilized demand for staking at 3 % yield, which gives an equilibrium of 49.5 million ETH when using the constrained burn-rate model. Vector graphics for the figure: Equilibrium - constrained burn rate.pdf (148.0 KB)
4.2 With an active validator cap
When using the constrained definition of the burn rate b' under a policy with an active validator cap, inactive validators will serve to raise the equilibrium for the circulating supply. The fact that ether locked up by validators cannot be used for transacting is assumed to reduce the rate at which ether is burned. When the number of validators is higher than the active validator cap L, the point where yearly issuance equals yearly burn is
b'(S-aD) = cF \sqrt{32L},
which can be resolved into the equation for the equilibrium
S = \frac{cF \sqrt{32L}}{b'} + aD.
The circulating supply when the yearly burn is higher than yearly issuance at full staking once again needs to be determined. With an active validator cap, the inequality for higher burn than issuance at S = D is
b'(D-aD) > cF\sqrt{32L},
which can be resolved to
D(1-a) > \frac{cF\sqrt{32L}}{b'},
D > \frac{cF\sqrt{32L}}{b'(1-a)}.
The deposit size will in this case shrink each year until the equilibrium when
D = \frac{cF\sqrt{32L}}{b'(1-a)},
and thereby
S = \frac{cF\sqrt{32L}}{b'(1-a)}.
The conditional statement for the equilibrium when using an active validator cap is then
S = \left\{ \begin{array}{ c l } \frac{cF\sqrt{32L}}{b'(1-a)} & \quad \textrm{if } a \neq 1 \textrm{ and } D > \frac{cF\sqrt{32L}}{b'(1-a)}\\ \frac{cF \sqrt{D}}{b'} + aD & \quad \textrm{elseif } D < 32L \\ \frac{cF \sqrt{32L}}{b'} + aD & \quad \textrm{otherwise} \end{array} \right..
The deposit size at 3 % staking yield and an active validator cap is the same as established in Section 3.3.1, 22.7 million ETH. Using b' = 0.027, the circulating supply at the equilibrium is
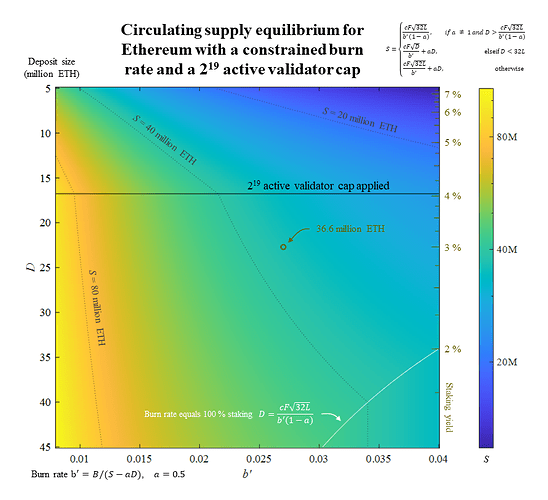
S = \frac{2.6 \times 64 \sqrt{32 \times 2^{19}}}{0.027} + 0.5 \times 2.27 \times 10^7 \approx 36.6 million ETH.
Figure 3 shows how the circulating supply varies with the deposit size and the constrained burn rate b’ when the active validator cap is applied at 2^{19} validators. The computed equilibrium of 36.6 million ETH is indicated by a beige circle. The plot has been extended to D = 45 million ETH so that the dotted line indicating 40 million ETH stretches across all three conditions of the equation for the circulating supply.
Figure 3. The circulating supply Equilibrium S for Ethereum with an active validator cap at 2^{19} validators (black horizontal line) using a constrained burn-rate model, plotted against the deposit size D (left y-axis), staking yield (beige, right y-axis) and constrained burn rate b’ (x-axis). Thin dotted lines indicate the circulating supply at 20, 40, and 80 million ETH (note that S is log-scaled in the figure). The beige circle indicates the base case with b’ = 0.027 and stabilized demand for staking at 3 % yield, which gives an equilibrium of 36.6 million ETH when using the constrained burn-rate model. Vector graphics for the figure: Equilibrium - constrained burn rate - 2^19 cap.pdf (149.6 KB)
5. Relationship between burn rate, stabilized yield, and deposit ratio
5.1 Deposit ratio for previous examples
It can be noted that the deposit ratio
d = \frac{D}{S}
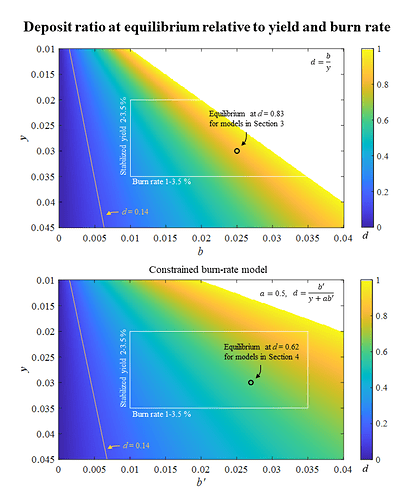
is rather high at the equilibrium for the base cases; 0.83 for the basic burn-rate model in Section 3: 30.7/36.9 \approx 0.83, 22.7/27.3 \approx 0.83, and 0.62 for the constrained burn-rate model in Section 4: 30.7/49.5 \approx 0.62, 22.7/36.6 \approx 0.62.
5.2 Minimum viable issuance and deposit ratio
Ethereum has had a policy of minimum viable issuance during the proof-of-work era, stipulating that the issuance of new tokens should be high enough to secure the blockchain, but not higher. Under proof of stake, the deposit ratio will be an important factor determining the security of the chain. If the deposit ratio is too low, Ethereum becomes less secure. A previous proposal suggests a Simplified Active Validator Cap at 2^{19} validators and 16.8 million ETH, corresponding to d \approx 0.14 at the current circulating supply. The purpose of the cap is to increase “confidence that a given level of hardware will always be sufficient to validate the beacon chain,”. One interpretation is that such a deposit ratio should ensure sufficient security, according to Buterin. Further input about the minimum viable deposit ratio for long-term security would be welcome from the community.
Are there any consequences of letting the deposit ratio become very high, i.e., is there a “too high” when it comes to the deposit ratio? This text does not answer that question, but attempt to provide some insights regarding the relationship between proof-of-stake variables that can be used in a further discussion. With an increasing deposit ratio, it seems inevitable that economic activity will be reduced in favor of locking up ether for staking. This reduces the “velocity of money” and adds an inflationary pressure both due to increased issuance and decreased burn rate. Although stakers can be expected to be more aligned with the interests of the network than miners, it seems as if a number of stakeholders of Ethereum could benefit from retaining a minimum viable issuance policy also under proof of stake. A further discussion is offered in Section 6.
To fully examine the issuance policy under proof of stake, it is desirable to understand how the deposit ratio relates to the burn rate and the yield at which staking demand stabilizes. This is done in the remainder of this section.
5.3 Deposit ratio as a function of yield and burn rate
As indicated in Section 5.1, the deposit ratio at the equilibrium can be derived independently of any validator cap as a function of the yield at which staking demand stabilizes and the burn rate. With the basic burn-rate model, the equilibrium of yearly burn and issuance,
bS = yD,
can be simplified to
\frac{D}S = \frac{b}y,
d = \frac{b}y.
For the constrained burn-rate model, the equilibrium of yearly burn and issuance,
b'(S-aD) = yD,
can instead be simplified to
\frac{S}D-a = \frac{y}{b'},
\frac{1}d = \frac{y}{b'}+a,
d = \frac{1}{y/b'+a},
d = \frac{b'}{y +ab'}.
The difference between the basic and constrained burn-rate model is thus that the constrained model reduces the deposit ratio at the equilibrium by adding ab’ to the denominator.
5.3.1 Visualization
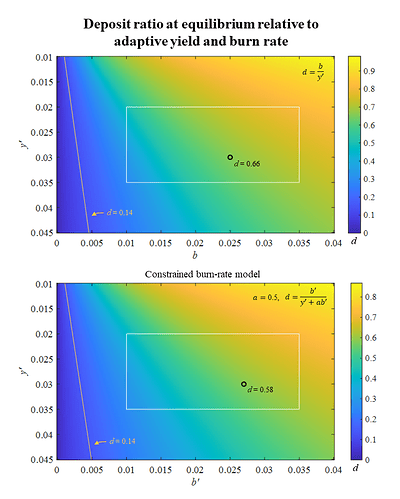
Figure 4 shows how the deposit ratio varies depending on burn rate and the yield y at which staking demand stabilizes. The top pane uses the basic burn-rate model from Section 3 and the bottom pane instead uses the constrained burn-rate model from Section 4, with a = 0.5. As previously noted, the deposit ratio at the equilibrium is the same for examples with and without an active validator cap; it is independent of any such cap.
The white rectangles cover the range between 1 % to 3.5 % for the burn rate and between 2 % to 3.5 % for the stabilized staking yield. The purpose is to highlight a range that seems reasonable, but it is not yet possible to predict that the variables will reside within these particular ranges. The deposit ratio of 0.14 discussed in the context of “minimum viable issuance” in Section 5.2 is shown with a yellow line. As evident, the line falls outside of the variable ranges that can reasonably be expected (granted with insufficient knowledge about these ranges at this time). For some combinations of y and b, the deposit ratio reaches 1. In a real-world scenario, it will never reach 1, because many tokens are lost forever, and staking demand and burn rate will fall once the deposit ratio becomes very high. The following Subsection 5.3.2 addresses this.
Figure 4. The deposit ratio at the equilibrium for the circulating supply of Ethereum, relative to burn rate and the yield at which staking demand stabilizes. The top pane shows the relationship for the basic burn-rate model described in Section 3, and the bottom pane uses the constrained burn-rate model described in Section 4. The white rectangle encloses “reasonable” variable values, y = 0.02-0.035, b = 0.01-0.035, that may need to be updated once staking has been further established. The yellow line indicates d = 0.14, which corresponds to 2^{19} validators and was discussed in Section 5.2 related to minimum viable issuance. Vector graphics for the figure: Deposit ratio relative to yield and burn rate.pdf (198.0 KB)
5.3.2 Letting demand for staking yield vary with deposit ratio
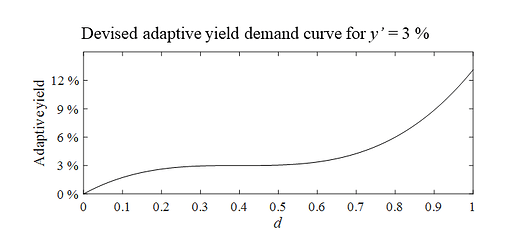
So far in this text, the demand for yield has been modeled as independent of the deposit ratio. Such a model assumes that if the demand for staking will stabilize at 3 %, then the “marginal staker” is ready to stake their ether if the yield is at or above 3 %, but will not stake otherwise. This makes it possible to use both deposit size and stabilizing yield on the left and right sides of the y-axis in the figures in Sections 3-4. For Figure 4 there is however no such need and it would be possible to allow this yield to depend on the deposit ratio, which is a more realistic model. Some participants in the eco-system are likely dead-set to stake their tokens whatever the yield, and some will be very reluctant or unable to do so even if the yield is very high. A model that assumes that the yield will stabilize at for example 3 % could therefore use an adaptive yield that plateaus at 3 % for deposit ratios between 0.1 and 0.7, but trends to 0 % at d = 0 and reaches double-digits when d approaches 1. This would allow the model to investigate the effect of various yields without creating unrealistic edge cases, such as the white area in the top right corners of both the top and bottom panes in Figure 4. Naturally, the deposit ratio will never reach 1, and could only trend towards 0 if the burn rate is close to 0.
The adaptive yield y’ which depends on the deposit ratio could for example be generated by multiplying the assumed yield with
1+\frac{5d-1}{2}^3.
Figure 5 shows how such a y’ depends on the deposit ratio when the yield is set to 3 %. As evident, the curve was designed to follow the description in the first paragraph of this subsection. Another variant would have been to rework the odds function \frac{d}{1-d} which may behave more realistically when d approaches 1. It is impossible at this time to know how the yield demands of the “marginal staker” vary with deposit ratio, but hopefully the proposed model is more accurate than assuming a flat yield demand.
Figure 5. An adaptive yield demand curve at y’ = 3 %, devised to model how demand for yield may vary across the deposit ratio. At low deposit ratios, the “marginal staker” can be expected to demand a lower yield for staking than at normal deposit ratios. At high deposit ratios, it is expected that a very high yield is needed to convince the “marginal staker” to stake their ether. The estimate is very uncertain, but likely better than assuming a flat yield demand. Vector graphics for the figure: Devised adaptive yield demand curve.pdf (49.5 KB)
Having devised an adaptive yield demand curve, it is now possible to revise the plots for how the deposit ratio varies across stabilizing yield and burn rate. Figure 6 shows the deposit ratio at the equilibrium relative to the adaptive yield y’ and burn rate. As evident, the edge case where the deposit ratio reaches 1 (white triangular area in Figure 5) has been resolved at these variable ranges.
Figure 6. The deposit ratio at the equilibrium for the circulating supply of Ethereum, relative to burn rate and the adaptive yield at which staking demand stabilizes. The adaptive yield demand curve shown in Figure 5 is applied to y’ and varies across d. The top pane shows the relationship for the basic burn-rate model described in Section 3, and the bottom pane uses the constrained burn-rate model described in Section 4. The white rectangle encloses “reasonable” variable values, y = 0.02-0.035, b = 0.01-0.035, that may need to be updated once staking has been further established. The yellow line indicates d = 0.14, which corresponds to 2^{19} validators and was discussed in Section 5.2 related to minimum viable issuance. Note that d for the two panes extends over a slightly different range but with the same color encoding. Vector graphics for the figure: Deposit ratio relative to adaptive yield and burn rate.pdf (168.9 KB)
6. Enforcing minimum viable issuance with a variable base reward factor
6.1 Overview
Previous sections have served to build an understanding of Ethereum’s monetary policy in the proof-of-stake era. If the burn rate is sustained, then issuance as a proportion of the circulating supply will rise and rise until it equals burned ether. This policy will lead to a circulating supply equilibrium where issuance equals burn rate. The circulating supply will however continue to vary also after this point in line with varying demand for staking yield and block space over the years. As mentioned in Section 5.2, the deposit ratio could end up above minimum viable issuance based on reasonable assumptions concerning future burn rates and staking yields. What would be the effect of instead keeping yields at minimum viable issuance levels, so that Ethereum may become perpetually deflationary? Such a policy could benefit many stakeholders in the Ethereum ecosystem, with a higher velocity of money, and passive value accrual also to people who are not staking their ether. Formulated a little differently:
If Ethereum attracts a higher deposit ratio than what is strictly needed for security, would it serve the ecosystem better to slowly reduce yields (e.g., adjust the base reward factor), equally rewarding all holders and participants in the ecosystem in the form of deflation?
How could such a policy be enforced? As illustrated in Sections 3-5, neither an active validator cap nor a permanent one-time reduction of the base reward factor would lead to perpetual deflation. Instead, a gradual reduction of the base reward factor in phase with a changing deposit ratio due to burned ether would be needed. Trying to beforehand specify a particular deflation rate to be maintained each year would hardly be feasible. Both the burn rate and stabilized yield can be expected to fluctuate also over longer time spans in response to changes in economic outlook, new use cases, and technological progress. Thus, a deflation rate that may seem sustainable at first could a few years later produce too low or too high (if this is deemed undesirable) deposit ratios. Therefore, it is not desirable to specify a constant factor at which the base reward factor would change each year. Instead, it could be continuously adapted to the deposit ratio, potentially factoring in ether that has not been moved for a very long time (more on this in Section 6.3.2).
6.2 Example
An example may help for understanding. This example does not account for what is technically feasible or not; it merely illustrates how to enforce minimum viable issuance. At a point where a perpetual deflation policy has stabilized, the yield y could for example be 0.03, the burn rate b, 0.02, and the deposit ratio d at the desired 0.14 of the circulating supply S. The inflation/deflation rate s is
s = dy-b = -0.0158,
which corresponds to a yearly reduction of the circulating supply by 1.58 %. The circulating supply is thus changed by a factor of 0.9842 in one year.
6.2.1 Current policy
Stepping forward one year, if the current policy is used, the following would happen:
- D – Assuming a flat yield demand curve, the marginal staker still demands 3 % yield to stake. Section 3.3 derived the equation for how deposit size depends on yield in this case D = \frac{c^2F^2}{y^2}, which gives that the deposit size will stay fixed if the yield demand is fixed and the base reward factor F left unchanged.
- d – The deposit ratio will change since the circulating supply has been reduced. Thus at year 1, d_1 = 0.14S_0/(0.9842S_0) = 0.1422
As evident, the deposit ratio rises. This would continue until d = \frac{b}y \approx 0.67 assuming a flat yield demand curve and basic burn-rate model. The reason is that the issued and burned ether at year 0 is not an equilibrium and there needs to be a continuous reduction of the base reward factor if the goal is to maintain a deposit ratio of 0.14.
6.2.2 Perpetual deflation
To retain minimum viable issuance, the base reward factor F would instead need to be adaptively adjusted to keep the deposit ratio at a desired level (in this example, 0.14). For the given values, this require reducing the deposit size: D_1 = 0.9842D_0. Ignoring fixed variables in D = \frac{c^2F^2}{y^2}, the required adjustment to the base reward factor would be
F_1 = \sqrt{0.9842 \times {F_0}^2} = 0.9921F_0.
Thus, the base reward factor would be reduced by the square root of the desired change to the deposit size. Expressed more generally: The deposit ratio can, in theory, be maintained with a yearly change of F by a factor of
\sqrt{1+s}.
Note that the computations in this section do not account for gradual changes of the variables.
6.3 Further discussion of monetary policy
The current monetary policy of Ethereum under proof of stake has gained wide acceptance. It is simple, easy to maintain, and will lead to an equilibrium. Therefore it may seem unnecessary to discuss variations of the established policy. This section does not however take a stand in favor of a perpetual deflationary policy. It is merely assuming that discussing and exploring the alternatives can be fruitful. EIP-1559 has introduced a deflationary pressure that may not have been anticipated when the original proof-of-stake monetary policy was established.
6.3.1 Money Lego
As discussed in Sections 5.2 and 6.1, high deposit ratios could potentially slow down economic activity. One aspect that influences the “velocity of money” for Ethereum going forward is therefore the degree to which liquid staking derivatives, e.g., rETH, can be used as a substitute in economic activity. In such a scenario, participants in the eco-system can use derivatives in their daily activities, converting to ether only for paying transaction fees or for dealing with parties that only accept ether. It seems plausible that in a scenario where perpetual deflation is enforced, participants would be less likely to resort to derivatives since deflation (and subsequent token price appreciation) will capture the majority of the rewards from token burns.
Staking derivatives will add an extra layer to an anticipated “Money Lego” of Ethereum. Such arrangements may pose risks, not to the proof-of-stake consensus but to an ecosystem of DApps relying on these derivatives. The day before the launch of Rocket Pool an exploit was discovered, despite the protocol going through serious auditing beforehand. What would happen if participants are incentivized to interact within the Ethereum ecosystem using staking derivatives at the bottom layer, these permeate the ecosystem, and there is an exploit?
6.3.2 Long-term effect of deflation
A long-term effect of a deflationary Ethereum is that as the circulating supply shrinks, the proportion of lost ether in relation to the ether that still can be moved will rise. Importantly, this proportion will be unknown. Therefore, at the very long time frame, determining minimum viable issuance may become harder, or such attempts even undesirable. Another aspect when rewards are accrued mainly through deflation is that this will reward holders that are very passive, and do not participate in the ecosystem on-chain at all. This could be interpreted as negative.
One thing to keep in mind is that it will be necessary to reduce the number of ether per validator in phase with the reduction of the circulating supply to retain the same decentralization, compensated by adjusting the base reward factor.
6.3.3 Effects of price and market cap
Price and market cap discussions have been purposefully left out from this text. It is not certain that a policy favoring staking above minimum viable issuance would drive the market cap higher than a model where non-staked ether is more equally favored. While it is true that favoring staking above minimum viable issuance will result in more locked up ether, it will also reduce (or more accurately, not to the same extent induce) demand for non-staked ether since the value accrual due to deflation will be slightly lower for non-staked ether than at minimum viable issuance.
A comparison with profit-sharing strategies in stock companies can be useful. Many companies are able to make a profit year after year as they mature. They can divest these profits to shareholders either by paying a dividend or through stock buybacks. Dividends have similar effects as staking rewards, and stock buybacks is a similar mechanism as burning ether. Stock buybacks will raise the price of the stock more, just as it can be expected that a perpetual-deflation policy would raise the price of the ether token the most long term. This does not alter the fact that both strategies divest profits to an equal degree. However, dividends, stock buybacks and token burns divest equally to all holders, whereas staking issuance above what is needed for security does not.
It can be mentioned here also that an increase in market cap will serve to push down the burn rate, because participants in the ecosystem will be willing to pay a lower fee in relation to the dollar-denominated market cap. But counteracting these forces is the scaling of Ethereum, which will contribute to a higher tolerance for high L1 fees when transactions move to L2; although this could initially temporarily reduce L1 demand.
7. Conclusion
This text has presented several models for how the circulating equilibrium of Ethereum relates to various variables, such as the deposit size, deposit ratio, burn rate, active validator caps, and staking yield. A base case of around 2.5 % burn rate and stabilized demand for staking at 3 % yield gave equilibria between 27.3-49.5 million ETH across models. Additional equations also illustrated how the variables relate to each other, such as how the deposit ratio depends on burn rate and demand for staking yield. The relationships can be used by the community to anticipate how changes to one of the variables affect the others. After observing that the deposit ratio can be expected to be rather high with reasonable assumptions for burn rate and staking demand, the topic of minimum viable issuance under proof of stake was lifted. It is shown that neither an active validator cap nor a one-time reduction of the base reward factor could be used to enforce minimum viable issuance. Instead, a gradual reduction of the base reward factor in phase with the reduction of the circulating supply would be needed. Some potential drawbacks and benefits of such a policy are discussed, but additional input from the community would be needed to understand if it is desirable and feasible.
This text as an attempt to learn more about the ecosystem. Hopefully, it can lead to a fruitful discussion.
