Thanks to Francesco D’Amato and Barnabé Monnot for feedback, and to participants of the RIG + friends (1, 2) meetup where parts of Orbit came together—including Barnabé’s finality stairwell.
1. Introduction
Ethereum will transition to single-slot finality (SSF) to provide fast and strong economic guarantees that transactions included in a block will not revert. This requires upgrades to the consensus algorithm (1, 2, 3, 4) and the signature aggregation scheme (1, 2, 3), as previously outlined. A third requirement is to upgrade Ethereum’s validator economics and management, with current progress on rotating participation presented in the Orbit SSF proposal. A few considerations in this area are how to incentivize validator consolidation (1, 2), how to temper the quantity of stake (1, 2, 3, 4), and how to select validators for the active set.
With SSF, the consensus mechanism will still consist of an available chain (e.g., RLMD GHOST) and a finality gadget (e.g., resembling Casper FFG or Tendermint). It remains unlikely that all validators will be able to participate in every slot, eventhough validator consolidation from EIP-7251 can offer a tangible improvement. This means that validators must be partitioned into committees, with each committee voting on the head of the available chain and/or finalizing successive checkpoints. Committees voting on the available chain must rotate slowly, but such strict requirements do not apply to the finality gadget (after validators have finalized their checkpoint).
This post will take a closer look at cumulative finality when finality committees rotate quickly or moderately, proposing strategies for validator selection and distribution. A forthcoming post is intended to review the dynamics of slower validator rotations, with a focus on the available chain. To properly model the impact of consolidation, equations for generating a “pure Zipfian” distribution for a specific quantity of stake are first presented in Section 2, with modeled staking sets generated at varying levels of purity. A method for generating committees in a new type of “epoch” is then presented in Section 3 and cumulative finality analyzed under different levels of validator consolidation and stake quantities—applying various committee selection criteria. A good evaluation measure is the “aggregate finality gap”, tallying missing finality for a block during its progression to full finality. It turns out that the activity rate of a validator should not strictly be determined by its size. Ideally, it varies with the quantity of stake and the composition of the validator set, hence “Vorbit", as in variable Orbit.
Cumulative finality is impeded at epoch boundaries when committees are shuffled. Circular finality is therefore suggested in Section 4, wherein successive epochs are repeated across a longer era, such that finality accrues in a circular fashion. A mechanism for shuffling the validator set in a spiral fashion is also introduced, to improve finality at shuffling boundaries. The impact of various selection and distribution methods is analyzed in Section 5, and the effect on finality across deposited stake is presented in Section 6. Section 7 reviews methods for predicting the optimal number of validating committees, and Section 8 reviews features related to consensus formation and staking risks.
2. Zipfian staking sets used for modeling
2.1 Pure Zipfian distribution
To model committee-based SSF, it is necessary to define the expected level of consolidation in the validator set, including a realistic range. The idea is to generate validator sets across this range and then explore how to optimally partition each set into committees. Optimization criteria relate to for example cumulative finality. An achievable consolidation level will also serve as a healthy bound when exploring consolidation incentives in a forthcoming study.
Vitalik reviewed the distribution of stakers in the early days of Ethereum and established that it was roughly Zipfian. The relationship between the staking deposit size D and the quantity of stakers N was then stipulated to D=32N\log_2{N} under a “pure” Zipfian distribution. A straightforward procedure for generating a “pure” Zipfian staking set is to distribute stakers’ balances as
When N is large (as in this case), the associated harmonic series
approaches \ln(N)+\gamma, where \gamma is the Euler–Mascheroni constant, approximately 0.577. The total quantity of stake is then
which is close to Vitalik’s approximation. Appendix A.1 shows that N therefore can be determined as
where W denotes the Lambert W function. These equations provide the blueprint for generating a pure Zipfian staking set given any specific D. The equation is first applied to D to determine N, and the harmonic series involving N is used to create the distribution. The corresponding two lines of Python code are provided in Appendix A.1.
2.2 Modeled validator sets
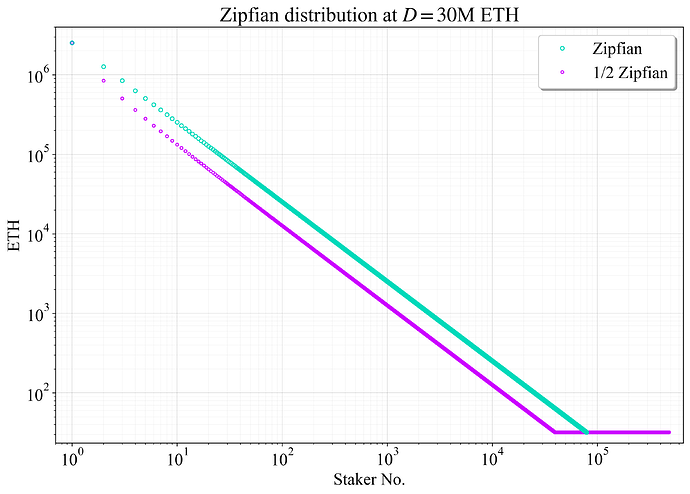
Figure 1 shows the resulting distribution of staker balances in cyan. In purple is a second distribution (“1/2 Zipfian”) created by removing half the stakers (every other staker in the sorted set, starting with the second largest), and reallocating the removed ETH across 32-ETH validators. This aims to capture a scenario where many larger stakers maintain 32-ETH validators. Even if they eventually consolidate, it could still represent an intermediate distribution of “nominal” staker set sizes over the next few years as consolidation slowly progresses. This post uses several such distributions, including also a 9/10 Zipfian distribution (removing every tenth staker), a 4/5 Zipfian distribution, and a 2/3 Zipfian distribution.
Figure 1. Log-log plot of distributions of staker set sizes used for modeling in this post, at D= 30M ETH. The set sizes in cyan follow a “pure” Zipfian distribution, and the set sizes in purple remove every other staker and reallocates the stake to 32-ETH validators.
The pure Zipfian distribution has N\approx79\,000 at D= 30M ETH staked. Ethereum’s node count is hard to estimate; crawlers can only provide lower bounds. But it would appear that the node count is a bit below the staker set size for this hypothetical distribution. The 1/2 Zipfian distribution in purple has N\approx481\,000. This is a point that hopefully will be passed through on the way to a consolidated validator set; yet it is uncertain how quickly progress will be made.
The staking sets are converted to validator sets \mathcal{V} by having stakers with more than 2048 ETH (excluding those already reallocated to 32-ETH validators) divide their stake into validators of the maximum allowed size (s_{\text{max}}=2048), thus capturing the ideal outcome. The last two validators in this procedure are set to an equal size below 2048. For example, a staker with 5048 ETH will have validators of size {2048, 1500, 1500}.
Most of the stakers hold less than 2048 ETH under the Zipfian distributions, so this only adds around 9000 validators for the pure Zipfian distribution and around 5000 validators for the 1/2 Zipfian distribution. For the Zipfian staking set, Appendix A.2 shows that the corresponding Zipfian validator set size V=|\mathcal{V}| can be estimated quite precisely as
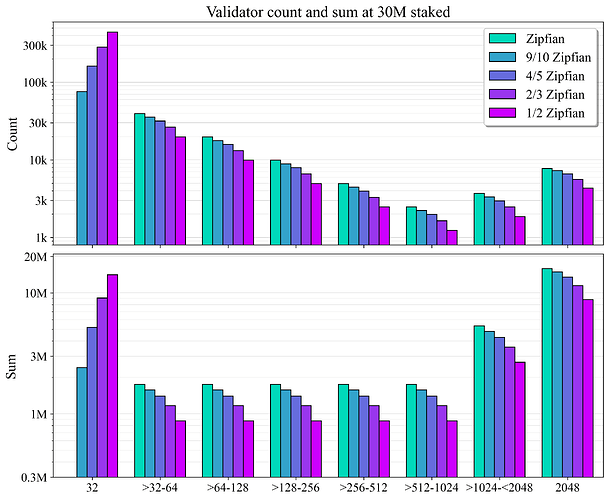
The distribution of validator counts and sums across consolidation levels is shown in Figure 2.
Figure 2. Distribution of validator count and sum at 30M ETH staked in the five modeled validator sets. Axes are log-scaled.
3. Committees, cumulative finality, and aggregate finality gap
3.1 Generation of committees
Define \hat{V_a} as a desirable upper limit for the active validator set size V_a. The protocol can allow (and wants) V_a to increase up to \hat{V_a}, but not beyond this limit. This post sets \hat{V_a}=31250, which corresponds to the committee size when 1 million validators are split up into 32 committees (reflecting approximately the current committee size). There has been some progress in enabling clients to handle larger committees, yet the finality gadget may have a slightly different profile than today (e.g., subject the network to twice the signature load). Smaller committees such as \hat{V_a}=4096 could therefore also be modeled using the same framework if required.
Let C denote the number of committees in a new form of “epoch” constituting a full rotation of the validator set. The validator set is first split up into C disjoint regular committees, ensuring V/C<\hat{V_a}. As an example, the 4/5 Zipfian staking set at D= 30M ETH consists of around 233 thousand (k) validators. An epoch must therefore be split up into at least C=8 committees, with each regular committee in that case consisting of around 29100 validators. Setting C=8 leaves room to include around V_{\mathrm{aux}}=\hat{V_a}-29\,100=2150 auxiliary validators in each committee—validators that also have been assigned to participate in some other regular committee. Once these 2150 validators have been added, the final full committees consist of \hat{V_a} validators.
To select auxiliary validators for the committees, each validator of size s ETH is assigned a weight w. The baseline weighting is
where s_{\mathrm{max}}=2048 as previously discussed. This is similar to the thresholding operation of Orbit SSF, but it uses s_{\text{max}} rather than 1024. This change differentiates validators in the range 1024-2048. Vorbit performs optimally under full differentiation, and the change also makes individual consolidation incentives (discussed in Section 8.3) reasonable above 1024. Section 5.1 discusses how Orbit can adopt full differentiation. The probability P(s) for a validator of size s ETH to be drawn as the next auxiliary validator to be included in a committee is given by:
where v represents each validator in the complementary set \mathcal{V}_{¢} not already part of the committee, and s_v is the size of validator v. The smallest validators will then tend to participate in roughly 1/C of the slots and larger validators more frequently, with outcomes depending on the quantity of stake and consolidation level (see also Figure 22).
3.2 Cumulative finality
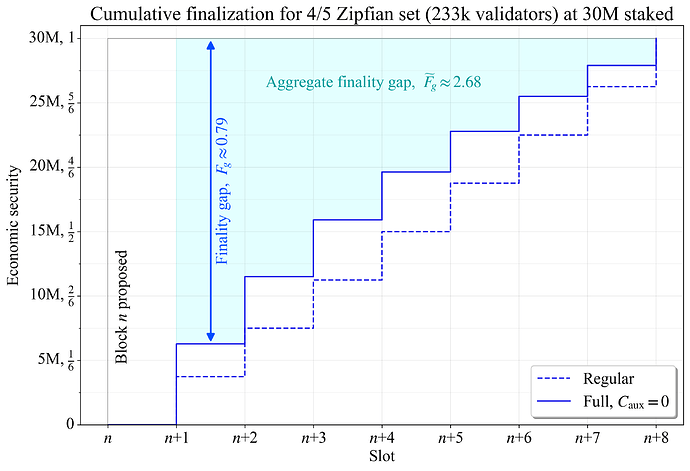
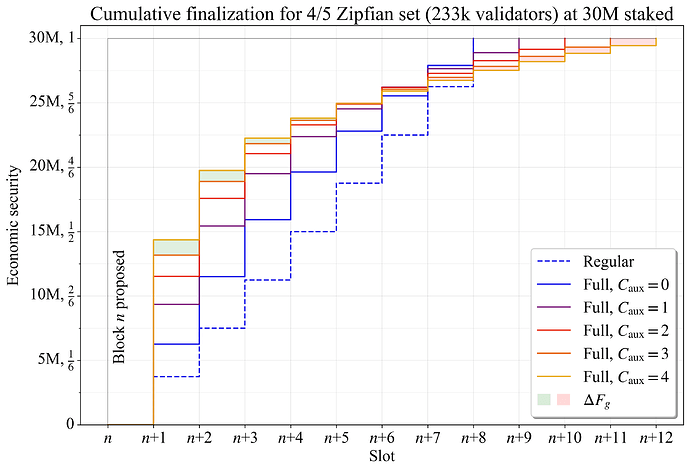
Figure 3 shows the stepwise committee-based cumulative finality for the 4/5 Zipfian staking set, with committees finalizing consecutive slots. For transactions included in block n, aggregate finality is visually accounted for at the conclusion of the slot that the committee voted in. Finality when only using the regular committee is illustrated using a dashed blue line. Since each regular committee is completely disjoint and proportionally reflects the overall distribution, each committee adds an equal marginal cumulative finality to non-finalized transactions/blocks. The solid blue line in Figure 3 shows cumulative finalization when each regular committee in the example has been supplemented by auxiliary validators up to \hat{V_a} (“Full”).
Figure 3. Cumulative finalization of block n for the 4/5 Zipfian staking set. The finality gap (blue arrow) gradually falls. The aggregate finality gap is the sum of all finality gaps until full finality (cyan area).
3.3 Aggregate finality gap
Let D_f be the quantity of stake that has finalized a block, and D the total quantity of stake deposited for staking. The finality gap F_g is the proportion of the stake that has not yet finalized a block:
While D_f is a relevant measure of economic security in isolation, D-D_f is less useful if D is unknown. A block’s finality gap will fall with each new slot as long as new validators participate in the finalizing committees. The example with full committees has a lower finality gap due to the additional finality afforded by the auxiliary validators. Since they are selected in a weighted fashion, the effect is rather pronounced eventhough only around 2150 additional validators were added in this example. The difference in the finality gap diminishes as full finality approaches. At this point, most validators will have been present as part of their regular allocation anyway, and repeating a validator does not, in this comparison, improve upon finality (an argument could potentially be made for higher economic security when repeating a validator, but this is beyond the scope of this post).
A useful utility measure when dealing with cumulative finality is the aggregate finality gap \widetilde{F}_{\!g} that a block is subjected to during consensus formation, until full finalization. It is represented by the cyan area in Figure 3 and is calculated as
3.4 Auxiliary committees
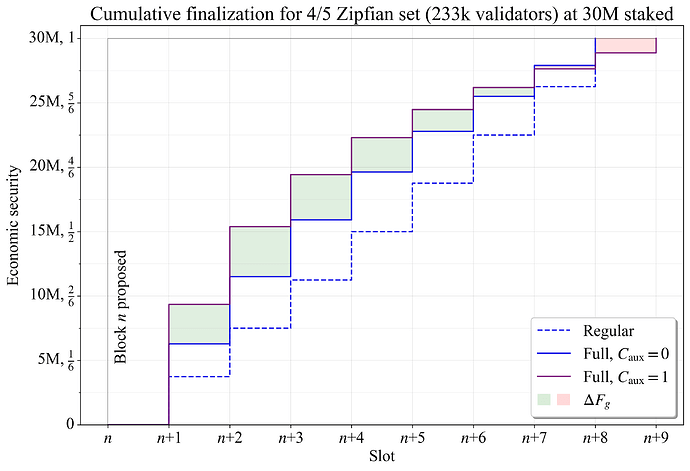
What happens if the 4/5 Zipfian set is divided into 9 committees instead of 8? The added auxiliary committee (C_{\mathrm{aux}}=1) results in \hat{V_a}/9\approx3470 auxiliary validators in each committee, facilitating a further reduction in \widetilde{F}_{\!g}. A comparison between epochs of 8 committees (blue) and 9 committees (purple) is shown in Figure 4. The difference in the finality gap \Delta F_{\!g} for block n is indicated in green for the slots when there is a reduction in the gap, and in red when there is an increase. Cumulative finality first improves due to the additional auxiliary validators, and this is the most pronounced effect. As the number of duplicated validators increases, the reduction diminishes. At the beginning of slot n+7, the validator set divided into 8 committees instead has a lower F_g, and it reaches full finality one slot earlier, at the start of slot n+8.
Figure 4. Cumulative finalization of block n for the 4/5 Zipfian staking set. When adding an auxiliary committee, there is more room for auxiliary validators with high balances in each committee (purple line), and finality therefore accrues faster during the initial phase.
The aggregate finality gap continues to fall when more auxiliary committees are added, as indicated in Figure 5. In the comparison between C_{\mathrm{aux}}=3 and C_{\mathrm{aux}}=4, \Delta F_{g} is negative starting at the beginning of slot n+5, and continues to fall all the way up to slot n+12. As a result, the aggregate finality gap \widetilde{F}_{\!g} is about equal for these two configurations.
Figure 5. Cumulative finalization of block n for the 4/5 Zipfian staking set, comparing the outcome between different numbers of auxiliary committees.
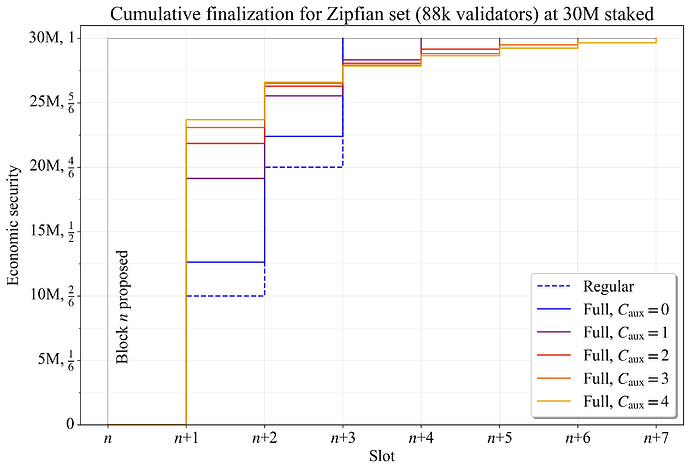
Figure 6 shows the same example for a purely Zipfian staking set. At C_{\mathrm{aux}}=4, almost 20M ETH (2/3 of the stake) will finalize the block in the first slot. As in the previous example, the benefit of adding auxiliary committees diminishes as more are added (\widetilde{F}_{\!g} stops decreasing and eventually reverses).
Figure 6. Cumulative finalization of block n for a pure Zipfian staking set, comparing the outcome between different numbers of auxiliary committees.
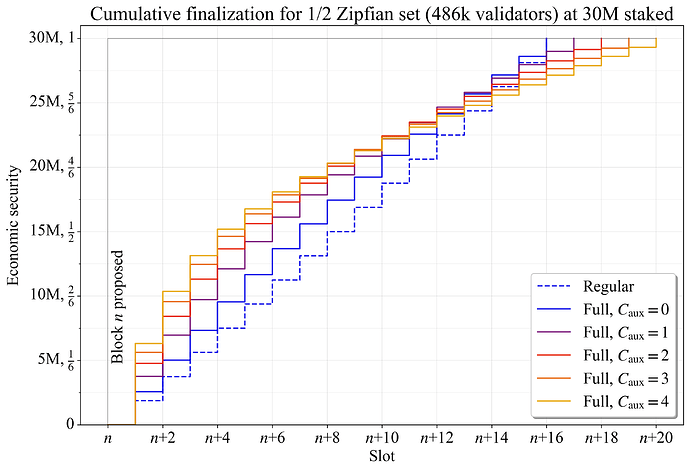
Figure 7 instead shows the outcome with a 1/2 Zipfian staking set. The approximately 486k validators need to be split into at least
committees. With no full committees, only 1.875 million ETH will finalize each round. This might seem problematic since a committee that fails to finalize will hold up finality until a sufficient amount of stake in the committee has been replaced through an inactivity leak or a similar mechanism. An accelerated inactivity leak could be considered under such circumstances. From an accountability perspective, this level of stake has however been argued to be totally sufficient.
Figure 7. Cumulative finalization of block n for the 1/2 Zipfian staking set, comparing the outcome between different numbers of auxiliary committees.
4. Circular and spiral finality
The figures in the previous subsection have all captured cumulative finality over one epoch and are representative for the first block in an epoch. During each epoch, the complete validator set is iterated over, so full finality is reached at the end of the epoch. However, if the validator set is shuffled between epochs, then only the first block of the epoch will achieve full finality by the end of the epoch. For blocks in later slots of the epoch, full finality will not be reached until the end of the next epoch. Marginal cumulative finality decreases markedly at epoch boundaries, because committees on each side of the boundary will have more validator overlaps (even when using only regular committees). Thus, when stating that full finality can be reached within eight slots for the 4/5 Zipfian staking set in Figures 3-5, this is a qualified statement. For the second block of the epoch, full finality is not reached until after 15 slots (7 slots in the first epoch and 8 slots in the subsequent epoch). Recall that C denotes the number of committees in an epoch, which is also then the number of slots in an epoch during regular operation. The average number of slots to full finality \bar{S}_{\!f} then becomes
While full finality might be more of an ideational concern, degradation from shuffling begins already at the second slot/committee if the block was proposed in the last slot of the epoch. There are two ways to improve on this: circular finality and spiral finality. Both provide benefits starting from a block’s second slot of accruing finality.
4.1 Circular finality
The most straightforward solution is to avoid shuffling the validator set each epoch. Instead, the validator set is shuffled in eras, where each era can consist of multiple epochs. The number of epochs per era E_{\text{era}} is determined from the desired number of slots per era \hat{S}_{\text{era}} and C, rounded to the nearest integer:
With this change, the first (E_{\text{era}}-1)C blocks of the era will be finalized in C slots, whereas the last C blocks will finalize in accordance with the previous equation C + (C-1)/2. Furthermore, and perhaps more importantly, cumulative finality will not degrade when crossing epoch boundaries within the era. The average number of slots to full finality among the E_{\text{era}}\times C blocks of an era becomes:
which simplifies to
As an example, set \hat{S}_{\text{era}}=64. The 4/5 Zipfian staking set with no auxiliary slots will then finalize 57 out of 64 blocks in 8 slots, with one block each among the remaining finalizing in 9, 10, 11 slots, etc. Furthermore, only the last 7 out of 64 slots in the era will suffer degraded cumulative finalization, whereas 56 out of 64 will do so without circular finality. The average number of slots to full finality becomes \bar{S}_{\!f} \approx 8.4. In contrast, without circular finality, the result is \bar{S}_{\!f}=C+(C-1)/2 = 11.5.
4.2 Spiral finality
While circular finality is effective in reducing \bar{S}_{\!f} and the proportion of blocks with degraded cumulative finality, it does not reduce the maximum time to full finality, which remains S_{f} = 2C-1. This maximum applies to the block proposed in the second slot of the last epoch of the era. A method to reduce this maximum is spiral finality, where limits are placed on how many slots validators may shift forward within the epoch when they are shuffled. This is controlled by the variable C_{\text{shift}}. Setting C_{\text{shift}}=2 means that validators may only shift two slots forward, but they can always shift back to the start of the epoch. The regular validators located in the first committee of the epoch \mathcal{C}_n can then be reassigned between committees \mathcal{C}_n and \mathcal{C}_{n+2}, the regular validators in committee \mathcal{C}_{n+1} can be reassigned between committees \mathcal{C}_n and \mathcal{C}_{n+3}, etc. If \hat{V}_a is set relatively low, it might be reasonable to make further stipulations on the random selection, to ensure an even distribution of large and small validators.
Circular and spiral finality can be combined to achieve a low average time to full finality, as well as a lower upper bound on it. In this setup, spiral finality is applied to the last epoch of an era.
5. Optimized selection and distribution of auxiliary validators
This section reviews two different methods for optimizing the distribution of auxiliary validators. The plots will as previously disregard epoch boundaries (presume circular finality). In fact, to provide a more stable results in light of the randomness inherent in the validatior selection process, finality is evaluated in a circular fashion in all plots of cumulative finality in this post. This involves computing results for C consecutive slots across all C different starting positions. Additionally, the approach ensures that spacing and distribution of validators are not attuned to epoch boundaries, and is particularly useful in Section 5.2 that introduces equally spaced validators.
5.1 Adjusted weighting
The most straightforward modification is to adjust the weighting scheme by adding the power p to the original equation:
If p>1, larger auxiliary validators are further prioritized over smaller validators. This can be useful since the smaller validators are still guaranteed to be included in one committee, and C can be relatively small (short epochs). A potential change to the Orbit slow-rotation paradigm, when validators are selected directly from the weighting and there is no regular committee, is that p instead can be set below 1. This reduces the “slope” of the thresholding mechanism, allowing smaller validators to be selected with a higher probability than for example 1/32 or 1/64. This can be beneficial for reasons discussed in Section 8.3, and will be further explored in a post covering the slowly rotating validator set.
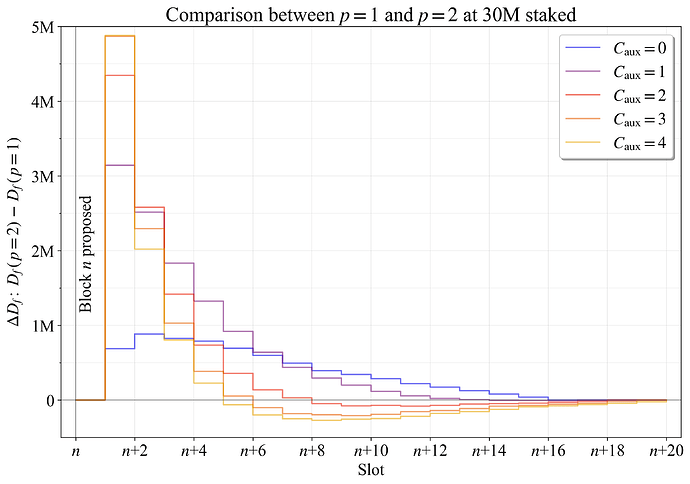
Figure 8 shows the difference in the finality gap in terms of finalized stake \Delta D_{f} when changing p from 1 to 2. The average outcome across the five validator sets (from 1/2 Zipfian to fully Zipfian) was used. The reader may also wish to review Figure 22 in Section 8.2, which shows how the change in weighting alters the probability for a validator of size s to be active.
Figure 8. Change in D_{f} at 30M staked when p is changed from 1 to 2, during a block’s progression to full finality.
As evident, D_{f} is on average almost 5M ETH higher for the first slot, when C_{\text{aux}} is between 3-4 (those lines are somewhat overlapping in the graph). This is a significant improvement, reducing the finality gap at the first slot by almost 1/6. The examples with 2-4 auxiliary committees then experience a slight reduction starting at n+5. This is because validators with the most stake become included in almost every committee: repeated validators do not increase the cumulative finality, and they occupy space in the committees, preventing new validators from finalizing the block.
5.2 Equal spacing
Since repeated validators do not increase cumulative finality, it is advantageous to equally space repeated auxiliary validators across the epoch so that repetitions occur as far apart as possible. The distribution of auxiliary validators can then be done slightly differently. The number of auxiliary inclusions \lambda can be set for a validator with stake s as
In this equation, \widetilde{V}_{\!\text{aux}} sums the auxiliary validator instances added across the full epoch among validators that are present in every slot. It is initially set to zero. For any validator v with \lambda_v > C-1, an iterative procedure sets \lambda_v = C-1, removes the validator from \mathcal{V}, adds C-1 to \widetilde{V}_{\!\text{aux}}, and recomputes \lambda for the remaining validators. The iterative procedure relying on \widetilde{V}_{\!\text{aux}} is necessary because a validator can never be included more than once per slot (\lambda \not > C).
Given \lambda, each validator is guaranteed inclusion in \lfloor \lambda \rfloor committees, with any remaining fraction used when drawing validators that will be included in one additional auxiliary committee. The final outcome is denoted \lambda_f. Auxiliary inclusions for validators are equally spaced at intervals of C/(\lambda_f+1) slots. The spacing procedure starts from the regular committee position, rounding the computed distance to the nearest integer, and wrapping around epoch boundaries using the modulo operation.
Due to randomness in the distribution of validators, slots will with this procedure generally end up slightly below or above \hat{V}_a. In general, this should not be an issue because \hat{V}_a would typically allow for some flexibility. However, to maintain consistency with the random draw in the evaluation, an iterative procedure reallocated validators from committees with more than \hat{V}_a validators to committees with fewer, still ensuring no duplications of validators within a committee.
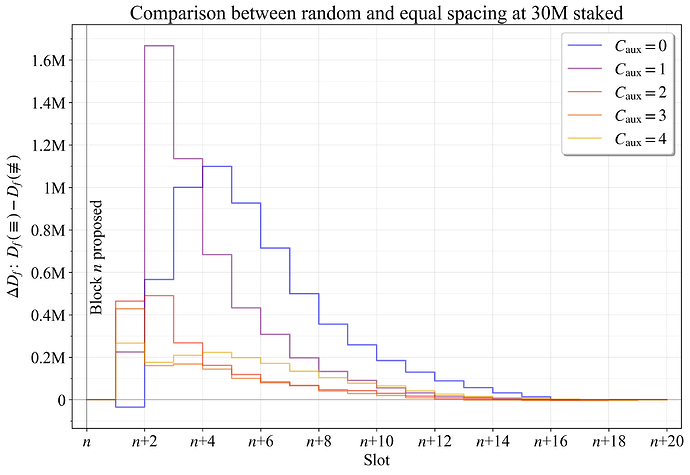
Let \equiv represent equal spacing and \not\equiv the spacing achieved due to random draw. The change \Delta D_f at 30M ETH staked, computed as D_f(\equiv) - D_f(\not\equiv), is shown in Figure 9. The variable p was set to 2 both for random and equally spaced validators.
The most significant improvement from equal spacing occurs in the second slot after the block has been proposed. By definition, the first slot will not contain any repetitions anyway. The improvements are most pronounced when there are fewer auxiliary committees, as these are the circumstances where 2048-ETH validators are not included in nearly every committee.
Figure 9. Change in D_{f} at 30M staked when validators are equally spaced across the epoch, during a block’s progression to full finality.
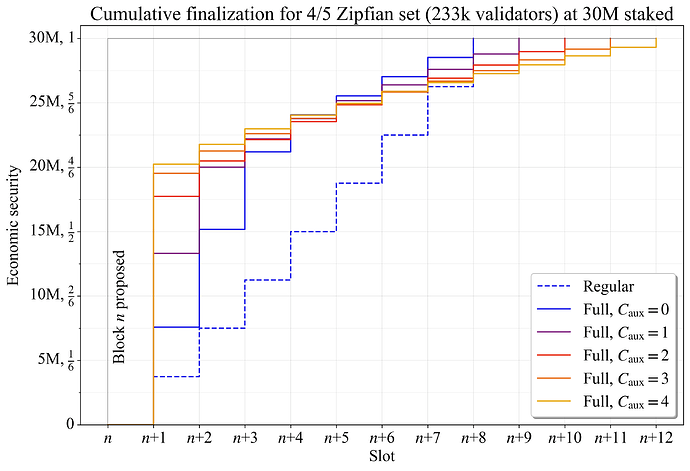
The outcome for the 4/5 Zipfian staking set using p=2 and equal spacing is shown in Figure 10. It can be compared with the previous plot in Figure 5, that shows the outcome with p=1 and random spacing. The changes increase D_f from 15M ETH to 20M ETH in the first slot when C_{\text{aux}} is 3-4 and in the second slot when C_{\text{aux}}=1.
Figure 10. Cumulative finalization of block n for the 4/5 Zipfian staking set, with p=2 and equal spacing \equiv.
6. Analysis across D
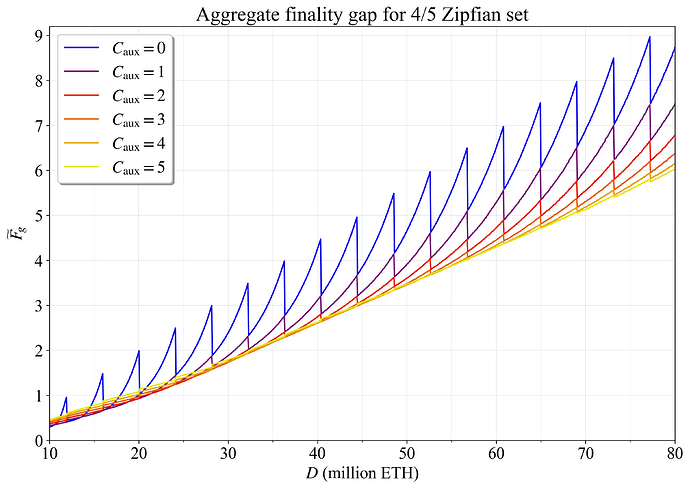
The analysis in this and the next section relies on p=2 and the randomized distribution of auxiliary validators \not\equiv. Figure 11 shows how the aggregate finality gap varies with C_{\text{aux}} across deposit size for the 4/5 Zipfian set. At lower quantities of stake, C_{\text{aux}}=0 gives the lowest \widetilde{F}_{\!g}. At higher quantities of stake, C_{\text{aux}}=5 gives the lowest among those plotted. But increasing C_{\text{aux}} all the way up to 7 will spuriously give the lowest results above 70M ETH staked. However, outcomes are very tightly overlapping at higher settings (hence they were not plotted), implying that in terms of \widetilde{F}_ {\! g}, venturing above C_{\text{aux}}=4 will not offer significant improvements.
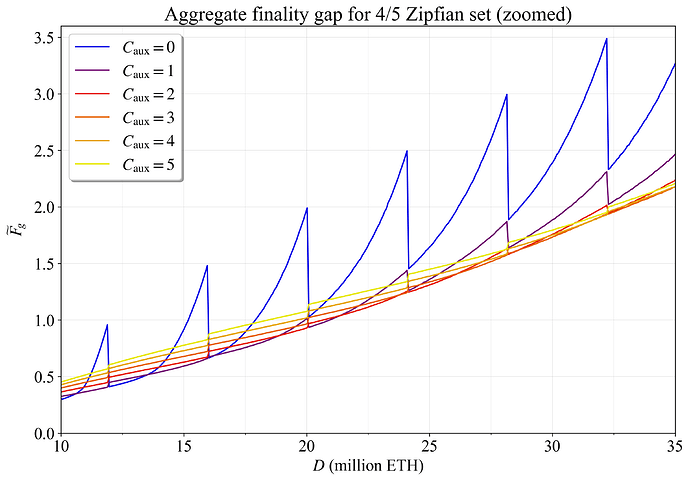
The characteristic shark fin-pattern emerges when validators are redistributed due to changes in C. As D increases while the distribution is kept fixed, V also increases. Each “fin” represents the addition of one committee. This addition gives room for more auxiliary validators, which reduces \widetilde{F}_ {\! g} when C_{\text{aux}} is relatively low. However, if C_{\text{aux}} is too high for the given validator set, the outcome is reversed, and the addition of one committee instead increases \widetilde{F}_ {\! g}. This is evident in Figure 12, which zooms in on the outcome below D= 35M ETH.
Figure 11. Aggregate finality gap for the 4/5 Zipfian set across D for various numbers of auxiliary committees.
Figure 12. Aggregate finality gap for the 4/5 Zipfian set with D\leq 35M ETH for various numbers of auxiliary committees.
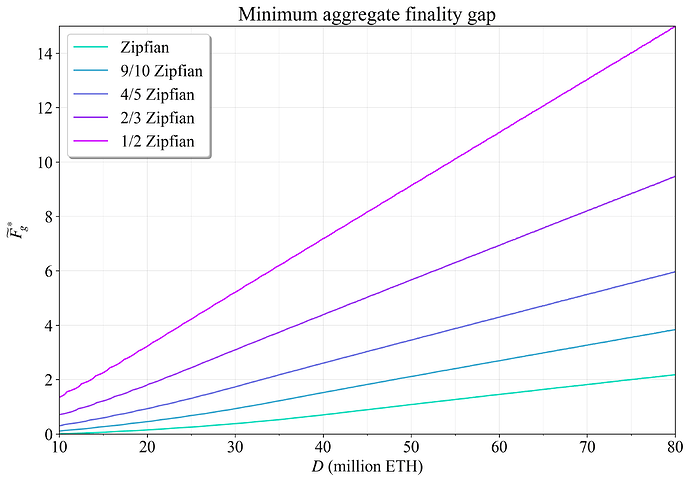
Define \widetilde{F}^*_{\!g} as the minimum aggregate finality gap, achieved at the associated minimum auxiliary committees C^*_{\text{aux}}. This corresponds to the lowest line at any specific D in Figures 11-12. Figure 13 plots \widetilde{F}^ * _ {\!g} for all five staking sets. As evident, there are two fundamental factors that degrade committe-based cumulative finality: a higher quantity of stake and a lower level of consolidation.
Figure 13. The minimum aggregate finality gap across stake. Fast finality is degraded both by a higher quantity of stake and a lower level of consolidation.
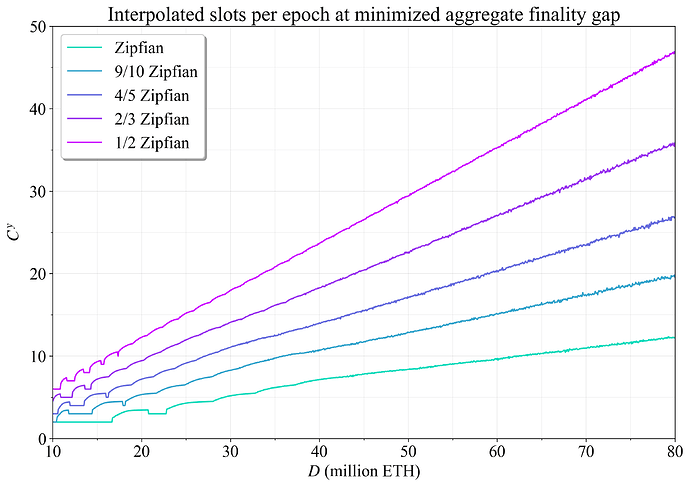
Figure 14 instead focuses on how the optimal number of committees at \widetilde{F}^*_{\!g} varies. However, the optimal number of committees will fluctuate greatly due to the fin-like pattern evident in Figure 12, and it is also a discrete measure. Therefore, parabolic interpolation (see Appendix B.3) was applied to three points around the minimum, resulting in a smoother representation of total committees, here denoted C^y. Both the aggregate finality gap and the total number of committees rise linearly with an increase in the quantity of stake, keeping the distribution fixed.
Figure 14. Interpolated total number of committees that minimizes the aggregate finality gap.
7. Predicting the optimal number of auxiliary committees
7.1 Overview
How should the number of auxiliary committees (or any other setting such as p) be determined during operation if the suggested variant of committee-based finality is pursued? Five options can be highlighted:
- Generate committees and compute \widetilde{F}_ {\! g} (or some more appropriate measure, as further discussed in Appendix B.2) for various C_{\text{aux}}-settings (e.g., 0-6), selecting the one that minimizes \widetilde{F}_ {\! g}. This solution might have a high computational load if there are several hundred thousand validators.
- Run the process for only the current and adjacent C_{\text{aux}}-settings. If the analysis is performed frequently, store the results and rely on hysteresis, switching only if a clear majority of recent evaluations are in favor. For example, a threshold of 80% over the last week could be used.
- If the computational load in (2) is still too high, a reduced validator set \mathcal{V}_ r can be relied upon, with validators in \mathcal{V}_ r drawn evenly spaced from the ordered full set \mathcal{V}. The setting for \hat{V_a} should then be reduced proportional to the reduction in the validator set before generating committees.
- Compute some simple features of the validator set related to for example variability, and determine an appropriate number of auxiliary slots based on these features.
- Specify a fixed number of auxiliary committees so that the mechanism performs reasonably well under a wide range of validator sets, e.g., C_{\text{aux}}=2.
When it comes to implementation complexity, all options are rather straightforward. A benefit of Options 1-3 is that client will need to implement the function for assigning validators to committees anyway. The remaining process is then the evaluation function described in Appendix B.1. This process does not have a high time complexity, but it might still be too computationally intensive if there are many hundred thousand validators.
Option 2 is then rather appealing, with some parallels to how hysteresis is leveraged when updating validators’ effective balance. Option 3 can further reduce the computational requirements by at least an order of magnitude (10x), perhaps up to two (100x). A question then is what accuracy that can be achieved if the validator set is reduced to for example |\mathcal{V}_ r| = 1000 or |\mathcal{V}_ r| = 5000. This is studied in Section 7.2. Another question is of course the viability of Option 4, which could further reduce the computational requirements. This is studied in Section 7.3, and Option 5 is reviewed in Section 7.4. The conclusion of the experiment, expanded on in Section 9, is that Option 2, 3 or 5 seems like the most viable, with Option 5 as a natural starting point.
The ground truth for modeling was not based on the optimal number of auxiliary committees C_{\text{aux}} but instead on the optimal number of auxiliary validators V_{\text{aux}}, mainly to circumvent the fin-like pattern in Figures 11-12. To achieve a smoother target, a more refined point V^{y}_{\text{aux}} between neighboring V_{\text{aux}} values was derived via parabolic interpolation—as previously illustrated also for C^y in Figure 14. A further small adjustment was made before interpolation, slightly weighting up \widetilde{F}_ {\! g} when a large number of auxiliary slots relative to the number of regular slots was applied. Appendix B.2-3 explains the full procedure for generating the ground truth. Appendix B.4 then describes the generation of an additional log-normal validator set to provide a greater spread in the evaluated examples. It is shown in yellow in Figures 15-20. One thousand validator sets were generated for each of the six different distributions for the analysis with D in the range 10M-80M ETH, giving a total of 6000 examples.
7.2 Prediction accuracy with a reduced validator set
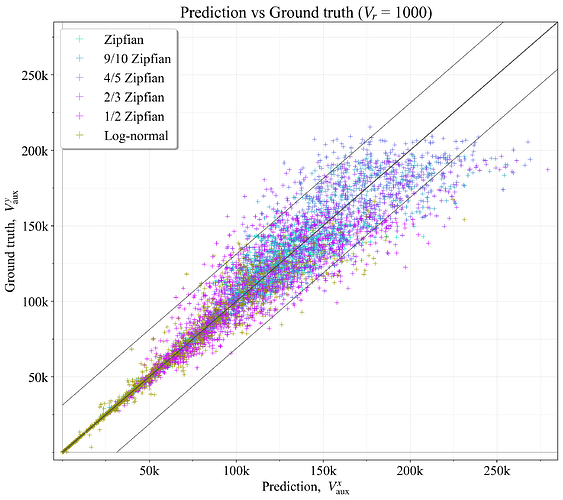
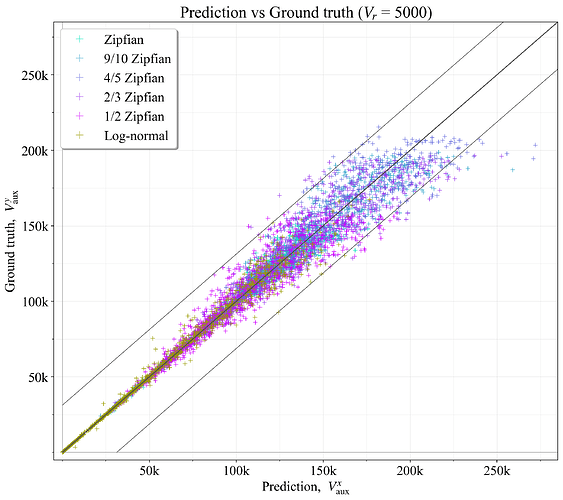
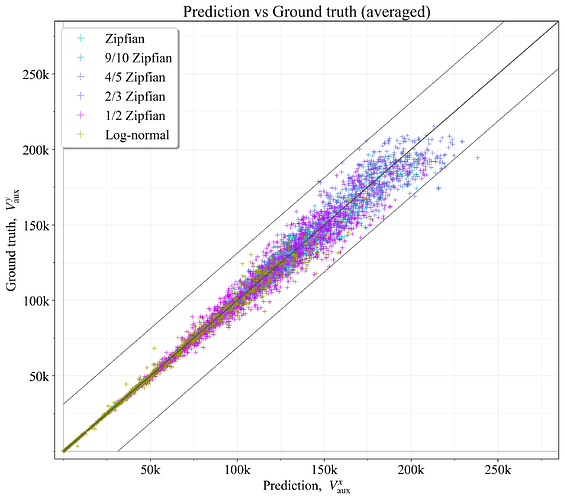
How accurate can the predictions be with a reduced validator set \mathcal{V}_r from Option 3, if \mathcal{V}_r consists of only 1000 or 5000 validators? To test this, the predicted optimal, V^{x}_{\text{aux}}, was computed on the reduced set, using the same evaluation procedure as when setting the ground truth V^{y}_{\text{aux}} on the full set (Appendix B.1). The outcome is shown in Figure 15 for 1000 validators (R^2=0.893) and in Figure 16 for 5000 validators (R^2=0.960). The broader black diagonal line represents perfect predictions, while the thinner black lines indicate the range where predictions fall within \hat{V}_{\!a}.
Figure 15. Predictions of the optimal number of auxiliary validators compared to ground truth, based on a reduced set of 1000 validators.
Figure 16. Predictions of the optimal number of auxiliary validators compared to ground truth, based on a reduced set of 5000 validators.
As evident, at higher values for V_\text{aux}, predictions become increasingly less accurate. This is related to the phenomenon shown in Figure 11, wherein the relative difference in \widetilde{F}_{\! g} will not be that large between the the best settings for C_{\text{aux}} (and thus V_{\text{aux}}). The broader implication is that getting C_\text{aux} slightly wrong will then not matter much. At the other end, getting it wrong at lower C_\text{aux} towards the bottom left corner is more of a concern. Note also that only examples where D> 40M ETH are problematic (review Figure 20 for the ground truth range 25M-35M).
The errors in the predictions stem from how the random selection influences the composition of the committees. Repeating the experiment several times and averaging the outcomes will therefore serve to improve accuracy (as would equally spaced validators described in Section 5.2). An example of the average outcome for four validator sets with V_{r} = {1000, 2000, 3000, 5000} respectively is shown in Figure 17. The predictions are now all within the \hat{V}_a boundary, and R^2=0.981. It must also be remembered that while V^{y}_{\text{aux}} by definition is the ground truth ideal outcome, it will also itself reflect a random division of validators during generation.
Figure 17. Predictions of the optimal number of auxiliary validators compared to ground truth, based on the average of four reduced sets.
7.3 Prediction accuracy using general features
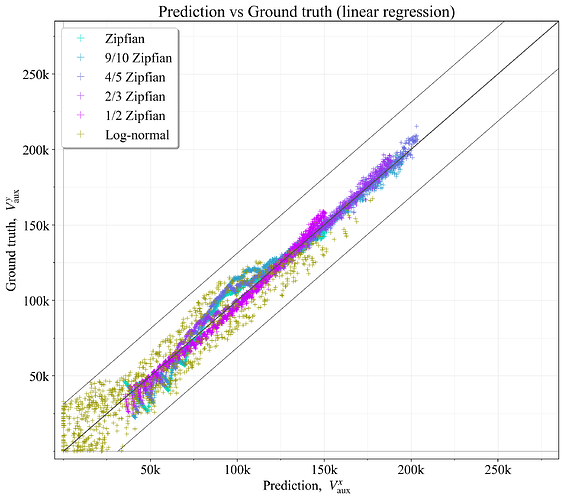
Can general features be used to determine the optimal number of auxiliary validators? To explore this, features were generated for the simulated validator sets, capturing basic properties such as validator count, deposit size, and various measures of variability. Polynomial feature expansion of degree 2 was used to generate all monomials of the original features, capturing interactions and non-linear relationships. Predictions were then made using multiple linear regression. The final features were selected through a semi-automatic forward feature selection process, manually choosing among top predictors to premier those that are easier to interpret (a key requirement is a simple model). This process resulted in a linear regression model consisting of three features: {V\sigma, V_w\delta, D^2}.
The first feature is the number of validators V multiplied by the standard deviation of the validator set \sigma. If the standard deviation is high, auxiliary validators become particularly useful for reducing the finality gap. The second feature multiplies the average absolute deviation, denoted \delta, with a weighted count of validators V_w. The weighting assigned validators of size 32 and 2048 a weight of 1, with the weight then log-linearly falling to 0 at the mean validator size \bar{\mathcal{V}}. Specifically, each validator holding s ETH, received a weighting of:
Predictions with V^{x}_{\text{aux}}<0 were set to 0 (the number of auxiliary validators cannot be negative). The predictions had R^2=0.975 and are shown in Figure 18. The wider dispersion in the lower left corner is somewhat problematic, as previously discussed. Option 4 therefore gives slightly worse outcomes than Option 3. Also note that since there was no training/test split, quite a bit of overfitting can be assumed. If Option 4 is to be pursued seriously, there would need to be a test set and a wider variety in training examples.
Figure 18. Predictions of the optimal number of auxiliary validators compared to ground truth, based on general features capturing, e.g., variability in the validator set.
7.4 Prediction accuracy using a fixed number of auxiliary committees
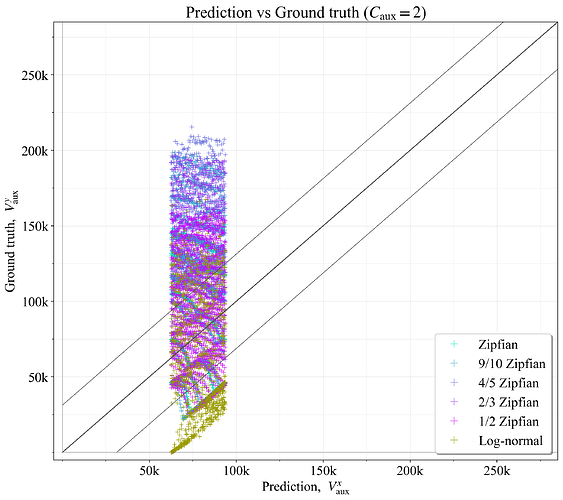
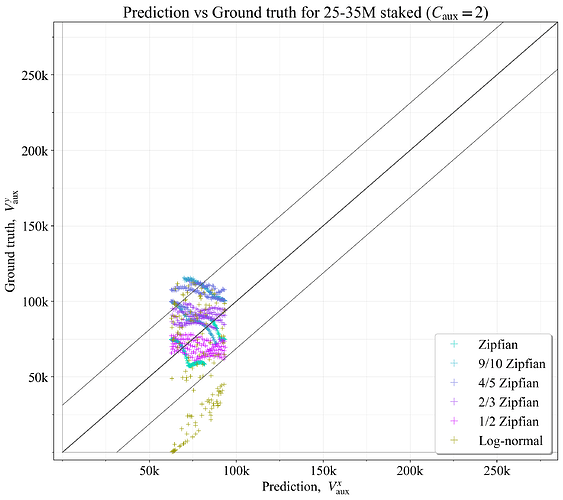
It may also be interesting to review the outcome with a fixed number of auxiliary committees. The outcome when setting all examples to a fixed C_{\text{aux}}=2 is shown in Figure 19. It generates predictions in a vertical band that is \hat{V}_a wide, with deviations from the ground truth extending well beyond \hat{V}_a. Figure 20 instead focuses on the range 25-35M ETH. In this case predictions tend to fall within \hat{V}_a, except for the log-normal distribution, which has several examples with little to no variability in validator balances (in that case, auxiliary slots bring no benefit). This illustrates that if D is kept in a narrow range, the variation in the optimal number of auxiliary committees/validators is reduced considerably. Starting with a fixed number of auxiliary committees is therefore a viable baseline strategy.
Figure 19. Predictions of the optimal number of auxiliary validators compared to ground truth, with a fixed C_{\text{aux}}=2.
Figure 20. Predictions of the optimal number of auxiliary validators compared to ground truth, with a fixed C_{\text{aux}}=2, for validator sets in the range D= 25M-35M ETH.
8. Properties related to consensus formation
8.1 Committee rotation ratio
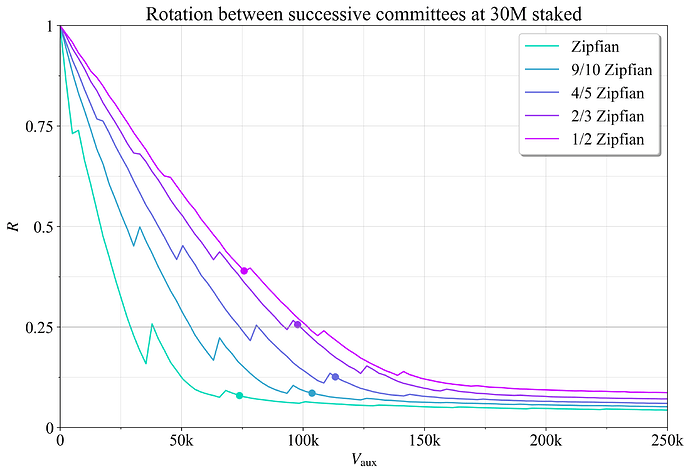
Define the committee rotation ratio R as the proportion of the stake that is replaced in successive committees following finalization. If all validators are replaced, R=1, and if all remain, R=0. Figure 21 shows how R changes across V_{\text{aux}} at 30M ETH staked. Aside from the relevance to the slow-rotation regime of the available chain, a ceiling has previously been discussed for a finality gadget leveraging Casper FFG. That suggestion, R=0.25, is indicated by a black horizontal line. The circles indicate the point where the aggregate finality gap is minimized (V^*_{\text{aux}}). This happens at rather modest rotation ratios and can of course readily be adjusted. Rotation becomes comparatively slow after adding around 150k auxiliary validator instances (C_{\text{aux}}\approx5), where 90% of the stake remains whenever a committee finalizes and rotates.
Figure 21. Committee rotation ratio R across auxiliary validators. Circles indicate the point where the aggregate finality gap is minimized.
8.2 Activity rate
The activity rate a captures the proportion of the committees that a validator is active in (defined as p in the Orbit post). The reciprocal a^{-1} captures the average number of slots until the validator has participated in one of them and will be referred to as a validator’s “apsis”—its orbital distance.
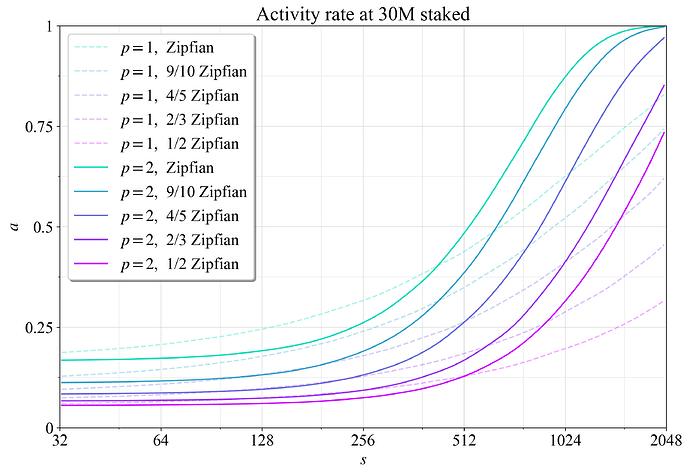
Figure 22 shows how a varies with validator size s when the aggregate finality gap is minimized (at V^*_{\text{aux}} marked by circles in Figure 21). As evident, a(s) is not a fixed property across validator sets, and will vary with, e.g., consolidation level and deposit size. Leveraging a variable orbit (“Vorbit”) seems natural, because a multitude of features that Ethereum wishes to optimize for vary with the composition of the validator set (a dynamic threshold has also previously been suggested).
Figure 22. The activity rate a across validator balances s at the minimized aggregate finality gap and 30M staked for the five sets. Note that the x-axis is log-scaled.
8.3 The activity ratio and its implications on staking economics
The activity ratio a_r = a(s_{\mathrm{min}})/a(s_{\mathrm{max}}) captures how often validators with a small balance are active, relative to validators with larger balances. The apsis ratio again denotes the reciprocal a^{-1}_r and can sometimes be easier to interpret: a^{-1}_r=32 means that small validators are present 32 times less frequenly than big validators. When a_r is small (and a^{-1}_r thus big), stakers running validators with a lower balance close to s_{\mathrm{min}} will bear a lower slashing risk than stakers running validators with higher balances close to s_{\mathrm{max}}. Inactive validators can hardly (by mistake or otherwise) make slashable actions. Someone running many small validators can therefore catch a faulty setup early so that a lower proportion of their validators are affected. Likewise, a small validator is less likely to get caught up in a catastrophic slashing event. Even if such an event only takes place every 100 years, it still meaningfully impacts the expected value of staking, particularly if the total staking yield decreases in the future.
In a slow-rotating mechanism, a_r is particularly relevant, given that stakers with a high average apsis on their validators can have even more time to, e.g., adjust faulty setups for inactive validators before they return as active. Yet a_r is relevant also in a fast-rotating mechanism. To encourage consolidation, individual incentives should compensate for the additional risks that large validators take on, relative to small validators. Individual incentives can potentially also be combined with collective consolidation incentives. The individual incentives will generally need to be higher when a_r is smaller, because the benefit of running smaller validators increases. It is therefore desirable to keep a_r closer to 1, whenever possible. This minimizes the yield differential between small and large validators, reducing “tensions” among stakers. Such tensions emerge under high yield differentials, where Ethereum will favor (or at least appear to favor) stakers with more capital.
Even if the additional yield is intended to compensate for increased risks, only stakers with high capital will have the option to choose between higher and lower risk. Stakers with more capital will also disproportionately benefit from the ability to adjust faulty setups among one of their many validators, should they decide to split up their stake. Tensions may therefore also emerge if a large staking service provider (SSP) relies on small validators to reduce its risk profile, and collective incentives as a result bring down everyone’s yield. There may for example be calls to discouragement attack the specific SSP’s validators, introducing an unhealthy dynamic to consensus formation. There are similarities to the type of issues that may emerge in MEV burn when using an English auction, where SSPs will need to specifically target each other through early builder bids to remain competitive.
In Figure 22, a_r is approximately 1/6 for the Zipfian staking set at p=2. Validators with 2048 ETH are always present, and validators with 32 ETH are only present as regular validators in one of the 6 committees of the epoch. This situation is generally better than if the smallest validators only are present once every 32 slots, as with the Orbit thresholding mechanism. The Orbit thresholding mechanism can however be adjusted by setting p<1. In a subsequent post, addressing slow rotation for the available chain, that avenue is intended to be explored further, together with other related consensus issues beyond the scope of this post.
Allowing 1-ETH validators would further reduce the activity ratio, requiring an increased yield differential. Smaller validator balances such as 1 ETH will thus require a communication effort to explain why these validators receive a markedly lower yield, and why large staking service providers cannot be prevented from relying on 1-ETH validators to lower their risk profile (but certainly nudged in the opposite direction via public discourse).
9. Conclusion and discussion
Cumulative committee-based finality has been reviewed under fast-rotating validator committees. A good measure for evaluating cumulative finality is the aggregate finality gap \widetilde{F}_{\!g}, which aggregates the finality gap for a block during its progression to full finality. The four main avenues for reducing (improving) \widetilde{F}_{\!g} are:
- adding a few auxiliary committees (around 2-4) beyond those required for all validators to cast one vote in an epoch,
- including the largest validators in almost every committee,
- equally spacing auxiliary validators to minimize successive repetitions,
- pursuing “circular finality” (repeating epochs over a longer era) and “spiral finality” (constrained shuffling) to mitigate degradation in cumulative finality during shuffling.
Five validator sets were used in the analysis, capturing various levels of Zipfianness. Section 6 made it clear that both insufficient validator consolidation and a higher quantity of stake (keeping the distributions fixed) impede finality, thereby increasing \widetilde{F}_{\!g}. When considering tempering the quantity of stake, one argument has been that it will generate a higher quantity of small validators. Regardless of the merits of this theory, it should be noted that a higher quantity of stake and a large proportion of small validators combines to produce the worst conditions for accruing finality, as shown in Figure 13.
Methods for dynamically adjusting the number of auxiliary commitees were reviewed. The best method is to simply simulate and evaluate the outcome with the same or one more/less auxiliary committees. This can be done on a reduced validator set to improve performance, if necessary. However, it is not a strict requirements that the number of auxiliary slots should change dynamically. The optimal setting for a given point in time is likely to remain viable for quite a while.
Properties related to consensus formation are important to keep in mind. As shown in Section 8, the committee rotation ratio R falls rather quickly with added auxiliary validators. It would be beneficial to map out more specific requirements on R from a consensus perspective going forward, both for the available chain and the finality gadget. Requirements regarding the activity ratio a_r are easier to understand in some respects; a higher ratio is better when considered in isolation, as it reduces tensions and yield differentiation.
The assumption of a pure Zipfian staking distribution becomes rather dubious if the range is extended much further. If the minimum staking balance is reduced from 32 ETH to 1 ETH, there will not necessarily be an exponential increase in stakers. One reason is that fixed costs for running a validator eventually surpass yield revenue as the staking balance decreases. For example, when focusing exclusively on fixed costs, if running a 32-ETH validator requires a 1% yield to remain profitable, then running a 1-ETH validator would require a 32% yield. Another point to keep in mind when considering a move to allow for 1-ETH validators is the decreased activity ratio a_r that it would bring. At the same time, allowing users with less capital to become active participants in the consensus process is of course fundamentally valuable and something to strive for.
Appendix A: Zipfian distribution
A.1 Quantity of stakers under a pure Zipfian distribution
For large N, the harmonic series
approaches \ln(N)+\gamma, where \gamma is the Euler–Mascheroni constant, approximately 0.577. The total quantity of stake is
The task now is to deduce N, given a specific D. Let u = \ln(N) + \gamma. Then N = e^{u - \gamma}, and the equation can be rearranged as follows:
Use the definition of the Lambert W function, which gives u = W(z), where
z = \frac{D}{32} e^\gamma:
Recall that u = \log(N) + \gamma. Substituting this in gives
and thus
Both sides are finally exponentiated to solve for N:
The equation provides a simple way to deduce N given D, such that the baseline Zipfian distribution in the form of the harmonic series can be used in accordance with the previous specification. The following two lines of Python code generate the staking set S for a specific deposit size, where eg=np.euler_gamma:
N = round(np.exp(scipy.special.lambertw(D*np.exp(eg)/(32))-eg))
S = 32*N/np.arange(1, N + 1)
A.2 Quantity of validators under a pure Zipfian distribution
Recall that the number of stakers is as previously derived
Among these N stakers, 1/64 will have a stake of 2048 or higher:
Under ideal circumstances, that stake will be divided up into
validators. However, the \frac{N}{64} stakers will roughly add an expected \gamma validators each to that figure, due to waste when splitting up stake into its last validators (i.e., the cumulative effect of the fractional parts). There are 63N/64 stakers with less than 2048 ETH. The total number of validators under a pure Zipfian distribution, where stakers maximize consolidation, is thus
The equation is a fairly exact approximation. For example, at 30M ETH, the outlined procedure gives 88065 validators, and the equation (after rounding N in the first step) gives 88065.385 validators.
Appendix B: Prediction and evaluation
B.1 Evaluation procedure
Cumulative finality of a block is simulated by a boolean mask that iterates through the committees, entering every validator seen up to and including a particular slot/committee. Thus, the starting point is a binary mask of all validators in the committee of the first processed slot. The operation then progresses through the slots of the epoch, entering previously unseen validators from a committee to the binary mask applicable to a specific slot. Finalized validators are then summed at each slot, from which D_f and thus \widetilde{F}_ {\! g} are computed. For best accuracy, the evaluation is performed in a circular fashion, as previously discussed. If S_{\text{ep}} is high, there can be an upper limit on how many starting points that are evaluated, e.g., starting at every other or every third slot. The evaluation for Section 6 used a limit of ten different starting points.
A potential optimization is to also compute a separate mask (or list of indices) that specifies only the newly unseen validators for each slot. This mask/list specifies if the validator is present in the current committee AND NOT present in the cumulative finality mask computed up to the previous committee. The benefit is that summation can be done only of the newly added validators, subsequently adding the cumulative sum derived at the previous slot/committee.
B.2 Weighted aggregate finality gap
The aggregate finality gap \widetilde{F}_ {\! g} generally seems like a well-balanced optimization criterion. Yet in some scenarios, it may be desirable to prioritize high finality in the initial slots (thus also slowing down rotation), while in others, a short time to full finality overall may be preferred (thus also increasing the activity ratio discussed in Section 8.3). A weighted aggregate finality gap can therefore be useful. This post used a weighting that provides a slightly shorter time to full finality on average. This helped resolve edge cases in the log-normal set (Appendix B.4) where the mechanism was brought very close to full finality, but the last fraction of finality took several slots. However, the opposite direction can also be explored, factoring in, for example, requirements concerning rotation speed.
Define a scenario where full finality can be achieved in 2 regular slots, but two auxiliary validators are added, as {2|4}. The weighting was designed to affect the following outcomes equally: {2|4}, {4|7}, {10|15} and {21|28}. This weighting for {a|b} was:
The constant k was set to 2^6 and the weight applied to each evaluated number of auxiliary slots. This can be done in two ways: \widetilde{F}_ {\! gw} = \widetilde{F}_ {\! g}(1+w) or \widetilde{F}_ {\! gw} = \widetilde{F}_ {\! g} \ +w, with the first being used in this work.
B.3 Interpolated ground truth
The ground truth for modeling was not auxiliary committees C_{\text{aux}} but instead the number of auxiliary validators V_{\text{aux}} to be added. The main reason why C_{\text{aux}} is generally undesirable as a ground truth is related to the fin-like pattern in Figures 11-12. The optimal C_{\text{aux}} will shift at the boundaries where regular committees require one more regular slot, causing the ground truth to oscillate as D rises. Targeting auxiliary validators avoids this issue. The total number of committees C shown in Figure 14 could have been used as well, but this precludes parabolic interpolation with \widetilde{F}_ {\! gw} for the regular committee as one of the interpolation points.
A remaining issue is that the V_{\text{aux}} that minimizes \widetilde{F}_ {\! gw} is discretized into steps differing by \hat{V}_ {\!a}, since the minimum can only be defined at integers in C_ {\text{aux}}. Define the number of auxiliary committees that minimizes \widetilde{F}_ {\! gw} as C^*_{\text{aux}}. Parabolic interpolation was performed across the three neighboring points, \widetilde{F}_ {\! gw}(C^*_{\text{aux}}-1), \widetilde{F}_ {\! gw}(C^*_{\text{aux}}) and \widetilde{F}_ {\! gw}(C^*_{\text{aux}}+1) to derive a relative position:
Define V_{\text{aux}}(C^*_{\text{aux}}) as the number of auxiliary validators at the optimal number of auxiliary committees. The ground truth V^{y}_{\text{aux}} is given by the w_{V}-weighted average of neighboring values. Thus, if w_{V}<0, it becomes
with a corresponding weighting applied if w_{V}>0. Predictions for the number of auxiliary validators in Section 7 are correspondigly defined as V^{x}_{\text{aux}}.
B.4 Generation of a log-normal distributed validator set
To provide a wider variety of examples of validator sets, an additional set with a log-normal distribution was generated. The mean \mu_{\mathcal{V}} was first drawn from a normal distribution centered at 400 ETH with a standard deviation of 128 ETH, restricted to lie within the range s_{\text{min}} = 32 ETH to s_{\text{max}} = 2048 ETH. Next, the standard deviation \sigma of the log-normal distribution was drawn uniformly from the interval [0, 3]. To provide edge cases with validator sets that have no variability at all, any \sigma below 0.2 was set to 0.
Given the selected mean \mu_{\mathcal{V}} and standard deviation \sigma, the mean of the log-normal distribution in the logarithmic space \mu was computed as
with the goal of keeping the mean in the original space close to \mu_{\mathcal{V}}. Validators were then generated up to the sought quantity of stake D by sampling from a log-normal distribution defined by the parameters \mu and \sigma, ensuring that each generated validator remained within the bounds s_{\text{min}} to s_{\text{max}}.
